

On-Site Melanoma Diagnosis Utilizing a Swellable Microneedle-Assisted Skin Interstitial Fluid Sampling and a Microfluidic Particle Dam for Visual Quantification of S100A1
- PMID: 38417122
- PMCID: PMC11040363
- DOI: 10.1002/advs.202306188
On-Site Melanoma Diagnosis Utilizing a Swellable Microneedle-Assisted Skin Interstitial Fluid Sampling and a Microfluidic Particle Dam for Visual Quantification of S100A1
Abstract
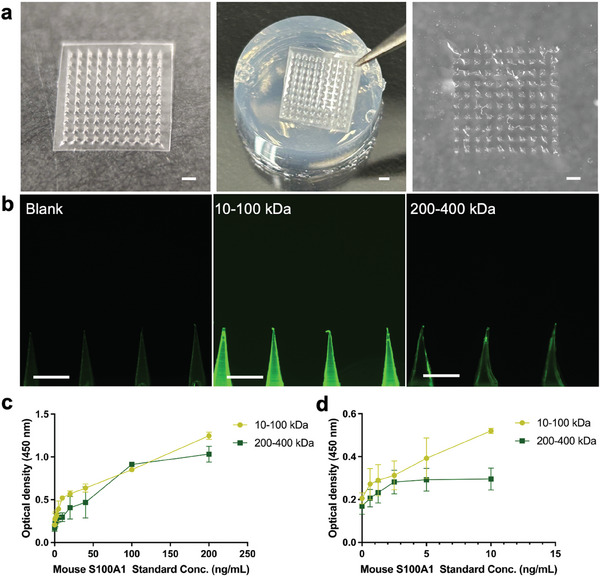
Malignant melanoma (MM) is the most aggressive form of skin cancer. The delay in treatment will induce metastasis, resulting in a poor prognosis and even death. Here, a two-step strategy for on-site diagnosis of MM is developed based on the extraction and direct visual quantification of S100A1, a biomarker for melanoma. First, a swellable microneedle is utilized to extract S100A1 in skin interstitial fluid (ISF) with minimal invasion. After elution, antibody-conjugated magnetic microparticles (MMPs) and polystyrene microparticles (PMPs) are introduced. A high expression level of S100A1 gives rise to a robust binding between MMPs and PMPs and reduces the number of free PMPs. By loading the reacted solution into the device with a microfluidic particle dam, the quantity of free PMPs after magnetic separation is displayed with their accumulation length inversely proportional to S100A1 levels. A limit of detection of 18.7 ng mL-1 for S100A1 is achieved. The animal experiment indicates that ISF-based S100A1 quantification using the proposed strategy exhibits a significantly higher sensitivity compared with conventional serum-based detection. In addition, the result is highly comparable with the gold standard enzyme-linked immunosorbent assay based on Lin's concordance correlation coefficient, suggesting the high practicality for routine monitoring of melanoma.
Keywords: S100A1; interstitial fluid; malignant melanoma; microfluidics; swellable microneedle.
© 2024 The Authors. Advanced Science published by Wiley‐VCH GmbH.
Conflict of interest statement
The authors declare no conflict of interest.
Figures


Similar articles
-
Turbulence-enhanced microneedle immunoassay platform (TMIP) for high-precision biomarker detection from skin interstitial fluid.Biosens Bioelectron. 2025 Aug 15;282:117480. doi: 10.1016/j.bios.2025.117480. Epub 2025 Apr 15. Biosens Bioelectron. 2025. PMID: 40279736
-
Microfluidic Particle Dam for Visual and Quantitative Detection of Lead Ions.ACS Sens. 2020 Jan 24;5(1):19-23. doi: 10.1021/acssensors.9b01945. Epub 2019 Dec 12. ACS Sens. 2020. PMID: 31808335
-
Swellable PVA/PVP hydrogel microneedle patches for the extraction of interstitial skin fluid toward minimally invasive monitoring of blood glucose level.Analyst. 2022 Mar 28;147(7):1478-1491. doi: 10.1039/d1an02288a. Analyst. 2022. PMID: 35285841
-
Microneedle-Integrated Sensors for Extraction of Skin Interstitial Fluid and Metabolic Analysis.Int J Mol Sci. 2023 Jun 8;24(12):9882. doi: 10.3390/ijms24129882. Int J Mol Sci. 2023. PMID: 37373027 Free PMC article. Review.
-
Microneedle Array-Based Dermal Interstitial Fluid Biopsy for Cancer Diagnosis: Advances and Challenges.Adv Healthc Mater. 2025 Mar;14(7):e2404420. doi: 10.1002/adhm.202404420. Epub 2025 Jan 29. Adv Healthc Mater. 2025. PMID: 39887596 Review.
Cited by
-
Electrostatic Force-Enabled Microneedle Patches that Exploit Photoredox Catalysis for Transdermal Phototherapy.ACS Appl Mater Interfaces. 2025 Jan 15;17(2):3038-3051. doi: 10.1021/acsami.4c18211. Epub 2024 Dec 31. ACS Appl Mater Interfaces. 2025. PMID: 39739671 Free PMC article.
-
Microneedle-aided nanotherapeutics delivery and nanosensor intervention in advanced tissue regeneration.J Nanobiotechnology. 2025 May 3;23(1):330. doi: 10.1186/s12951-025-03383-1. J Nanobiotechnology. 2025. PMID: 40319333 Free PMC article. Review.
-
Enhancing melanoma therapy with hydrogel microneedles.Front Oncol. 2025 Apr 17;15:1590534. doi: 10.3389/fonc.2025.1590534. eCollection 2025. Front Oncol. 2025. PMID: 40313257 Free PMC article. Review.
-
From mechanism to applications: Advanced microneedles for clinical medicine.Bioact Mater. 2025 May 5;51:1-45. doi: 10.1016/j.bioactmat.2025.04.025. eCollection 2025 Sep. Bioact Mater. 2025. PMID: 40463395 Free PMC article. Review.
-
A Machine Vision Perspective on Droplet-Based Microfluidics.Adv Sci (Weinh). 2025 Feb;12(8):e2413146. doi: 10.1002/advs.202413146. Epub 2025 Jan 1. Adv Sci (Weinh). 2025. PMID: 39742464 Free PMC article.
References
-
- Young A. T., Vora N. B., Cortez J., Tam A., Yeniay Y., Afifi L., Yan D., Nosrati A., Wong A., Johal A., Wei M. L., Pigm. Cell Melanoma Res. 2021, 34, 288. - PubMed
Publication types
MeSH terms
Substances
Grants and funding
LinkOut - more resources
Full Text Sources
Medical
Miscellaneous