Meta-Analysis
. 2024 Mar 15;13(2):e230242.
doi: 10.1530/ETJ-23-0242. Print 2024 Apr 1.

Head-to-head comparison of American, European, and Asian TIRADSs in thyroid nodule assessment: systematic review and meta-analysis

Affiliations
Meta-Analysis

Head-to-head comparison of American, European, and Asian TIRADSs in thyroid nodule assessment: systematic review and meta-analysis

Tommaso Piticchio et al. Eur Thyroid J. .

Abstract

Context: Ultrasound-based risk stratification systems (Thyroid Imaging Reporting and Data Systems (TIRADSs)) of thyroid nodules (TNs) have been implemented in clinical practice worldwide based on their high performance. However, it remains unexplored whether different TIRADSs perform uniformly across a range of TNs in routine practice. This issue is highly relevant today, given the ongoing international effort to establish a unified TIRADS (i.e. I-TIRADS), supported by the leading societies specializing in TNs. The study aimed to conduct a direct comparison among ACR-, EU-, and K-TIRADS in the distribution of TNs: (1) across the TIRADS categories, and (2) based on their estimated cancer risk.

Methods: A search was conducted on PubMed and Embase until June 2023. Original studies that sequentially assessed TNs using TIRADSs, regardless of FNAC indication, were selected. General study characteristics and data on the distribution of TNs across TIRADSs were extracted.

Results: Seven studies, reporting a total of 41,332 TNs, were included in the analysis. The prevalence of ACR-TIRADS 1-2 was significantly higher than that of EU-TIRADS 2 and K-TIRADS 2, with no significant difference observed among intermediate- and high-risk categories of TIRADSs. According to malignancy risk estimation, K-TIRADS often classified TNs as having more severe risk, ACR-TIRADS as having moderate risk, and EU-TIRADS classified TNs as having lower risk.

Conclusion: ACR-, EU-, and K-TIRADS assess TNs similarly across their categories, with slight differences in low-risk classifications. Despite this, focusing on cancer risk estimation, the three TIRADSs assess TNs differently. These findings should be considered as a prerequisite for developing the I-TIRADS.

Keywords: TIRADS; malignancy; nodule; risk; thyroid.


Conflict of interest statement

The authors declare that there is no conflict of interest that could be perceived as prejudicing the impartiality of the study reported.

Figures
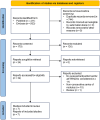
Figure 1
Figure 1
Flow of article search.
Figure 2
Figure 2
(A) Assessment of TNs according to ACR-TIRADS original category. (B) Assessment of TNs according to EU-TIRADS original category. (C) Assessment of TNs according to K-TIRADS original category. Any square represents a study and its size varies with study effect, while the line represents the 95% CI. Diamond indicates the pooled call rate and its width represents the 95% CI.
Figure 2
Figure 2
(A) Assessment of TNs according to ACR-TIRADS original category. (B) Assessment of TNs according to EU-TIRADS original category. (C) Assessment of TNs according to K-TIRADS original category. Any square represents a study and its size varies with study effect, while the line represents the 95% CI. Diamond indicates the pooled call rate and its width represents the 95% CI.
Figure 3
Figure 3
Graphical illustration of the risk assigned to categories of ACR-, EU-, and K-TIRADS leading to aggregate categories and building a three-scale system of mild, moderate, and severe risk of malignancy. The numerical heading of original categories is indicated by triangle flag. The colored bands indicate the malignancy risk range originally assigned to each category of TIRADS. X-axis represents the estimated risk of malignancy from 0 to 100%. The background schematically illustrates the increasing risk from green (mild) to moderate (yellow) and severe (red).
Figure 4
Figure 4
(A) Assessment of TNs according to the risk of malignancy estimated in ACR-TIRADS. (B) Assessment of TNs according to the risk of malignancy estimated in EU-TIRADS. (C) Assessment of TNs according to the risk of malignancy estimated in K-TIRADS. Any square represents a study and its size varies with study effect, while the line represents a 95% CI. Diamond indicates the pooled call rate and its wideness represents the 95% CI.
Figure 4
Figure 4
(A) Assessment of TNs according to the risk of malignancy estimated in ACR-TIRADS. (B) Assessment of TNs according to the risk of malignancy estimated in EU-TIRADS. (C) Assessment of TNs according to the risk of malignancy estimated in K-TIRADS. Any square represents a study and its size varies with study effect, while the line represents a 95% CI. Diamond indicates the pooled call rate and its wideness represents the 95% CI.
Figure 5
Figure 5
(A) Head-to-head comparison of TIRADSs according to TNs assessment in mild risk class. (B) Head-to-head comparison of TIRADSs according to TNs assessment in moderate risk class. (C) Head-to-head comparison of TIRADSs according to TNs assessment in severe-risk class. Any square represents a study and its size varies with study effect, while the line represents a 95% CI. Diamond indicates the pooled call rate and its wideness represents the 95% CI.
Figure 5
Figure 5
(A) Head-to-head comparison of TIRADSs according to TNs assessment in mild risk class. (B) Head-to-head comparison of TIRADSs according to TNs assessment in moderate risk class. (C) Head-to-head comparison of TIRADSs according to TNs assessment in severe-risk class. Any square represents a study and its size varies with study effect, while the line represents a 95% CI. Diamond indicates the pooled call rate and its wideness represents the 95% CI.
Figure 6
Figure 6
Graphical schematic representation of the meta-analysis of TIRADSs assessment according to risk-aggregated categories. This figure represents a sort of graphical abstract of the entire article. It illustrates schematically the different behavior exhibited by ACR-, EU-, and K-TIRADS when considering the risk of malignancy that they assign to each their category. According to malignancy risk estimation, K-TIRADS often assesses thyroid nodules as severe risk, ACR-TIRADS as moderate risk, and EU-TIRADS as mild risk) The details of these results are reported in Table 3 and Fig. 5.

References

    1. Russ G Leboulleux S Leenhardt L & Hegedüs L. Thyroid incidentalomas: epidemiology, risk stratification with ultrasound and workup. European Thyroid Journal 20143154–163. (10.1159/000365289) - DOI - PMC - PubMed
    1. Haugen BR, Alexander EK, Bible KC, Doherty GM, Mandel SJ, Nikiforov YE, Pacini F, Randolph GW, Sawka AM, Schlumberger M, et al.2015 American Thyroid Association management guidelines for adult patients with thyroid nodules and differentiated thyroid cancer: the American Thyroid Association guidelines task force on thyroid nodules and differentiated thyroid cancer. Thyroid 2016261–133. (10.1089/thy.2015.0020) - DOI - PMC - PubMed
    1. Gharib H, Papini E, Paschke R, Duick DS, Valcavi R, Hegedüs L, Vitti P, AACE/AME/ETA Task Force on Thyroid Nodules & American Association of Clinical Endocrinologists. American Association of Clinical Endocrinologists, Associazione Medici Endocrinologi, and European Thyroid Association Medical guidelines for clinical practice for the diagnosis and management of thyroid nodules: executive summary of recommendations. Endocrine Practice 201016468–475. (10.4158/EP.16.3.468) - DOI - PubMed
    1. Durante C Hegedüs L Czarniecka A Paschke R Russ G Schmitt F Soares P Solymosi T & Papini E. 2023 European Thyroid Association Clinical Practice Guidelines for thyroid nodule management. European Thyroid Journal 202312e230067. (10.1530/ETJ-23-0067) - DOI - PMC - PubMed
    1. Rago T & Vitti P. Risk stratification of thyroid nodules: from ultrasound features to TIRADS. Cancers 202214717. (10.3390/cancers14030717) - DOI - PMC - PubMed