. 2024 Jun 5;112(11):1778-1794.e7.
doi: 10.1016/j.neuron.2024.02.009. Epub 2024 Feb 27.

Single-nucleus RNA sequencing demonstrates an autosomal dominant Alzheimer's disease profile and possible mechanisms of disease protection

Affiliations

Single-nucleus RNA sequencing demonstrates an autosomal dominant Alzheimer's disease profile and possible mechanisms of disease protection

Maria Camila Almeida et al. Neuron. .

Abstract

Highly penetrant autosomal dominant Alzheimer's disease (ADAD) comprises a distinct disease entity as compared to the far more prevalent form of AD in which common variants collectively contribute to risk. The downstream pathways that distinguish these AD forms in specific cell types have not been deeply explored. We compared single-nucleus transcriptomes among a set of 27 cases divided among PSEN1-E280A ADAD carriers, sporadic AD, and controls. Autophagy genes and chaperones clearly defined the PSEN1-E280A cases compared to sporadic AD. Spatial transcriptomics validated the activation of chaperone-mediated autophagy genes in PSEN1-E280A. The PSEN1-E280A case in which much of the brain was spared neurofibrillary pathology and harbored a homozygous APOE3-Christchurch variant revealed possible explanations for protection from AD pathology including overexpression of LRP1 in astrocytes, increased expression of FKBP1B, and decreased PSEN1 expression in neurons. The unique cellular responses in ADAD and sporadic AD require consideration when designing clinical trials.

Keywords: APOE3 Christchurch; PSEN1-E280A; autophagy; chaperones; single-nucleus sequencing; spatial transcriptomics; sporadic Alzheimer's disease; transcriptomics.


Conflict of interest statement

Declaration of interests K.S.K. consults for ADRx and Expansion Therapeutics and is a member of the Tau Consortium board of directors. F.L. consults for Biogen and Viewmind and has grants from the NIH, Red-Lat, Alzheimer’s Association, Biogen, DIAN-TU, DIAN-Obs, Large PD, and Enroll-HD. J.A.-U .is a consultant for the pharmaceutical company Tecnoquimicas (Colombia).

Figures

Figure 1.
Figure 1.. Neuropathological evaluation for the individuals used in the study and expression profiling of human nuclei populations from frozen, post-mortem frontal cortex.
(A-B) Frequency of occurrence of age at onset (AAO) of cognitive decline, age at death (AAD) among individuals from 3 different diagnosis: control, PSEN1-E280A and sporadic AD. (C) Representative images of histological characterization of frontal cortex tissue from control, PSEN1-E280A and sporadic AD individuals. Hematoxylin-eosin staining (column 1); Immunohistochemistry for amyloid β peptides (column 2), phosphorylated TAU [AT8] (column 3). Each row represents one set representative image for each diagnosis. Scale bars: 50μm. (D) Neuropathological status (Thal phase, BRAAK stage and CERAD score) for each diagnosis. (E) UMAP projection of cells from control, PSEN1-E280A and sporadic AD individuals colored by cell type annotation. Neur: neuronal, Inh: inhibitory neurons OPCs: oligodendrocyte precursor cells, Oli: oligodendrocytes, Mic: microglia, Ast: astrocytes, Peri: pericytes, Endot: endothelial. (F) Violin plots showing the gene set score for the cell types identified in the dataset. (G-H) Abundance of cell type per diagnosis (D) or individuals (E) from different diagnosis. *indicates significant difference (p_adjusted < 0.05). See also Figures S1–S3
Figure 2:
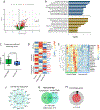
Figure 2:. Astrocytes from PSEN1-280A exhibit mitochondrial and autophagy-associated gene over-expression in comparison to Sporadic AD.
(A) Volcano plots showing up and downregulated genes in PSEN1-E280A astrocytes compared to sporadic AD. (B) Gene set enrichment annotation of differentially overexpressed genes in Astrocytes. Bar graph representing annotation into two categories, Reactome (top), and GO Biological Processes (bottom). (C) Scores for the chaperone-mediated autophagy (CMA) according to diagnosis. CMA score for both PSEN1-E280A and sporadic AD is normalized by CMA score for non-diseased individuals. (D) Heatmap and hierarchical clustering of the genes (rows) associated with autophagy overexpressed in PSEN1-E280A. Collum’s show individual cases. (E) Network plot showing the top 25 hub genes associated with module Ast-M2 identified by hd-WGCNA. (F) Overlap of genes differentially expressed revealed by Pseudobulk analysis and genes in Ast-M2 module revealed by hd-WGCNA (G) Enrichment of genes matching membership term: autophagy. The outer pie shows the number and the percentage of genes in the background that are associated with the membership (in black); the inner pie shows the number and the percentage of genes in the individual input gene list that are associated with the membership. The p-value indicates whether the membership is statistically significantly enriched in the list. See also Figure S2 and S4
Figure 3.
Figure 3.. Excitatory neuronal loss is detected in both PSEN1-E280A and sporadic AD.
(A) UMAP plot of neuronal nuclei colored by neuronal subpopulation and split by diagnosis. (B) UMAP plot colored by the levels of expression of the pan-excitatory and inhibitory markers SLC17A7 and GAD1. (C) Subpopulations proportion of excitatory and inhibitory neurons across controls, PSEN1-E280A and sporadic AD (D) Volcano plots showing up and downregulated genes in PSEN1-E280A excitatory and inhibitory neurons compared to sporadic AD. (E) Scores for the chaperone-mediated autophagy (CMA) according to diagnosis in excitatory and inhibitory neurons. CMA score for both PSEN1-E280A and sporadic AD is normalized by CMA score for non-diseased individuals. (F) Gene set enrichment annotation of differentially overexpressed genes in Excitatory and Inhibitory neurons. Bar graph representing annotation into two categories, Reactome (top), and GO Biological Processes (bottom). (G) Network plot showing the top 25 hub genes associated with module Ast-M2 identified by hd-WGCNA. (H) Overlap of genes differentially expressed revealed by Pseudobulk analysis and genes in Exc-M2 module revealed by hd-WGCNA. (I) Gene set enrichment annotation of genes within hd-WGCNA module Exc-M2. Bar graph represents annotation into Reactome, Kegg pathway and GO-biological processes ranked by p-value. See also Figure S2 and S4–5.
Figure 4.
Figure 4.. Spatial transcriptomics in post-mortem brain tissue reveals differentially expressed genes in PSEN1-E280A patients that are specific to white and gray matter regions.
(A) Spatial transcriptomics overview. (B-C) Expression of (B) neuron (SNAP25) and (C) oligodendrocyte (MBP) markers delineates gray and white matter in frontal cortex. (D-F) UMAP of spots from PSEN1-E280A and control individuals colored by (D) cluster identity (E) brain region, and (F) white/gray matter. (G) Spots colored by white/gray matter on frontal cortex sample. (H-I) Volcano plots for genes differentially expressed in E280A patients as compared to controls (H) in gray matter and (I) white matter. See also Figure S6
Figure 5.
Figure 5.. Mechanistic insight into sets of differentially expressed genes in PSEN1-E280A compared to sporadic AD.
(A) Schematics showing the results of the hypergeometric distribution test showing top Reactome pathways over-represented in the overexpressed DGEs in PSEN1-E280A versus sporadic AD astrocytes, excitatory neurons and inhibitory neurons. (B) Table displaying results from gene set enrichment analysis, rows represent gene sets, and columns provide information about enrichment results. Gene sets represents amyloid beta production and secretion genes (Abetaset) and NFT-associated genes (NFTset). The statistics represents the results from the DGEs in PSEN1-E280A compared to sporadic AD by their z-value. ES: Enrichment Score, NES: Normalized Enrichment Score
Figure 6.
Figure 6.. Protein expression profile validates the transcriptional alterations detected by Single-nuc RNA Sequencing.
(A) Representative immunofluorescence micrographs of frontal cortex GFAP and HSP90 labeling from PSEN1-E280A and sporadic AD cases, as well as quantification of HSP90 expression in astrocytes. (B) Representative immunofluorescence micrographs of frontal cortex MAP2 and HSP90 labeling from PSEN1-E280A and sporadic AD cases, as well as quantification of HSP90 expression in neurons. (C) Representative immunofluorescence micrographs of frontal cortex GFAP and PPIA labeling from PSEN1-E280A and sporadic AD cases, as well as quantification of PPIA expression in astrocytes. (D) Representative immunofluorescence micrographs of frontal cortex MAP2 and PPIA labeling from PSEN1-E280A and sporadic AD cases, as well as quantification of PPIA expression in astrocytes. Scale bar = 20 μm. n represents the number of cells analyzed in each group.
Figure 7.
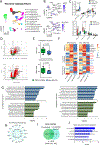
Figure 7.. A protective profile in NFT-free frontal cortex of a PSEN1-E280A APOE3 Christchurch homozygous carrier.
(A) UMAP projection of dataset integrated with data obtained from sn-RNA seq of frontal cortex and occipital cortex of a patient carrier of PSEN1-E280A, who was also homozygous for the APOE3 Christchurch (PSEN1-E280A_APOE3-CC-hom). Left UMAP shows cells from all patients, and right plots show the projection of nuclei split by PSEN1-E280A carriers negative for the APOE3-Christchurch variant (PSEN1-E280A_APOE3-CC-hom), and by PSEN1-E280A carriers heterozygotes for the APOE3-Christchurch variant (PSEN1-E280A_APOE3-CC-het). (B) Heatmap showing the z-score for the levels of expression of selected genes upregulated in astrocytes from PSEN1-E280A_APOE3-CC-hom compared to PSEN1-E280A_APOE-CC-negative. (C) Representative immunofluorescence micrographs of frontal cortex GFAP and LRP1 labeling from PSEN1-E280A_APOE-CC-hom and PSEN1-E280A_APOE-CC-negative cases, as well as quantification of LRP1 expression in astrocytes. Scale bar = 20 μm. n represents the number of cells analyzed in each group. (D) Heatmap showing the z-score for the levels of expression of selected genes upregulated in excitatory neurons from PSEN1-E280A_APOE3-CC-hom compared to PSEN1-E280A_APOE-CC-negative (E) Representative immunofluorescence micrographs of frontal cortex MAP2 and FKBP1 labeling from PSEN1-E280A_APOE-CC-hom and PSEN1-E280A_APOE-CC-negative cases, as well as quantification of FKBP1 expression in astrocytes. Scale bar = 20 μm. n represents the number of cells analyzed in each group. (F) ViolinPlots showing levels of expression of LRP1 in astrocytes from APOE3ch_HOM frontal cortex and occipital cortex samples. (G) Representative immunofluorescence micrographs of frontal and occipital cortex of PSEN1-E280A_APOE3-CC-hom, and quantification represented by box plots showing levels of colocalization of Tau-5 (top) or pathological TAU (AT8, bottom) with GFAP. Volume of GFAP colocalizing with thresholded Tau-5 positive signal is higher in occipital than in frontal cortex, while GFAP colocalizing with thresholded AT8 positive signal is significantly smaller in occipital than in frontal cortex of PSEN1-E280A_APOE3-CC-hom. Data from the analysis of three slices/brain regions from the patient PSEN1-E280A_APOE3-CC-hom. The box plots represents minimum and maximum values, while line in the center represents the median. (H) Venn diagrams showing overlap of significant genes differentially expressed when comparing either PSEN1-E280A_APOE3-CC-hom, or PSEN1-E280A_APOE3-CC-het with PSEN1-E280A carries negative for the APOE3-Christchurch variant.

References

    1. Cruchaga C, Del-Aguila JL, Saef B, Black K, Fernandez MV, Budde J, Ibanez L, Deming Y, Kapoor M, Tosto G, et al. (2018). Polygenic risk score of sporadic late-onset Alzheimer’s disease reveals a shared architecture with the familial and early-onset forms. Alzheimer’s & Dementia 14, 205–214. 10.1016/j.jalz.2017.08.013. - DOI - PMC - PubMed
    1. Zetterberg H, and Mattsson N (2014). Understanding the cause of sporadic Alzheimer’s disease. Expert Review of Neurotherapeutics 14, 621–630. 10.1586/14737175.2014.915740. - DOI - PubMed
    1. Ryman DC, Acosta-Baena N, Aisen PS, Bird T, Danek A, Fox NC, Goate A, Frommelt P, Ghetti B, Langbaum JBS, et al. (2014). Symptom onset in autosomal dominant Alzheimer disease: A systematic review and meta-analysis. Neurology 83, 253–260. 10.1212/WNL.0000000000000596. - DOI - PMC - PubMed
    1. Acosta-Baena N, Sepulveda-Falla D, Lopera-Gómez CM, Jaramillo-Elorza MC, Moreno S, Aguirre-Acevedo DC, Saldarriaga A, and Lopera F (2011). Pre-dementia clinical stages in presenilin 1 E280A familial early-onset Alzheimer’s disease: a retrospective cohort study. The Lancet Neurology 10, 213–220. 10.1016/S1474-4422(10)70323-9. - DOI - PubMed
    1. Lopera F, Ardilla A, Martínez A, Madrigal L, Arango-Viana JC, Lemere CA, Arango-Lasprilla JC, Hincapié L, Arcos-Burgos M, Ossa JE, et al. (1997). Clinical Features of Early-Onset Alzheimer Disease in a Large Kindred With an E280A Presenilin-1 Mutation. JAMA 277, 793–799. 10.1001/jama.1997.03540340027028. - DOI - PubMed

MeSH terms

Substances