. 2024 Mar 20;15(3):227-245.e7.
doi: 10.1016/j.cels.2024.02.002. Epub 2024 Feb 27.

Cross-evaluation of E. coli's operon structures via a whole-cell model suggests alternative cellular benefits for low- versus high-expressing operons

Affiliations

Cross-evaluation of E. coli's operon structures via a whole-cell model suggests alternative cellular benefits for low- versus high-expressing operons

Gwanggyu Sun et al. Cell Syst. .

Abstract

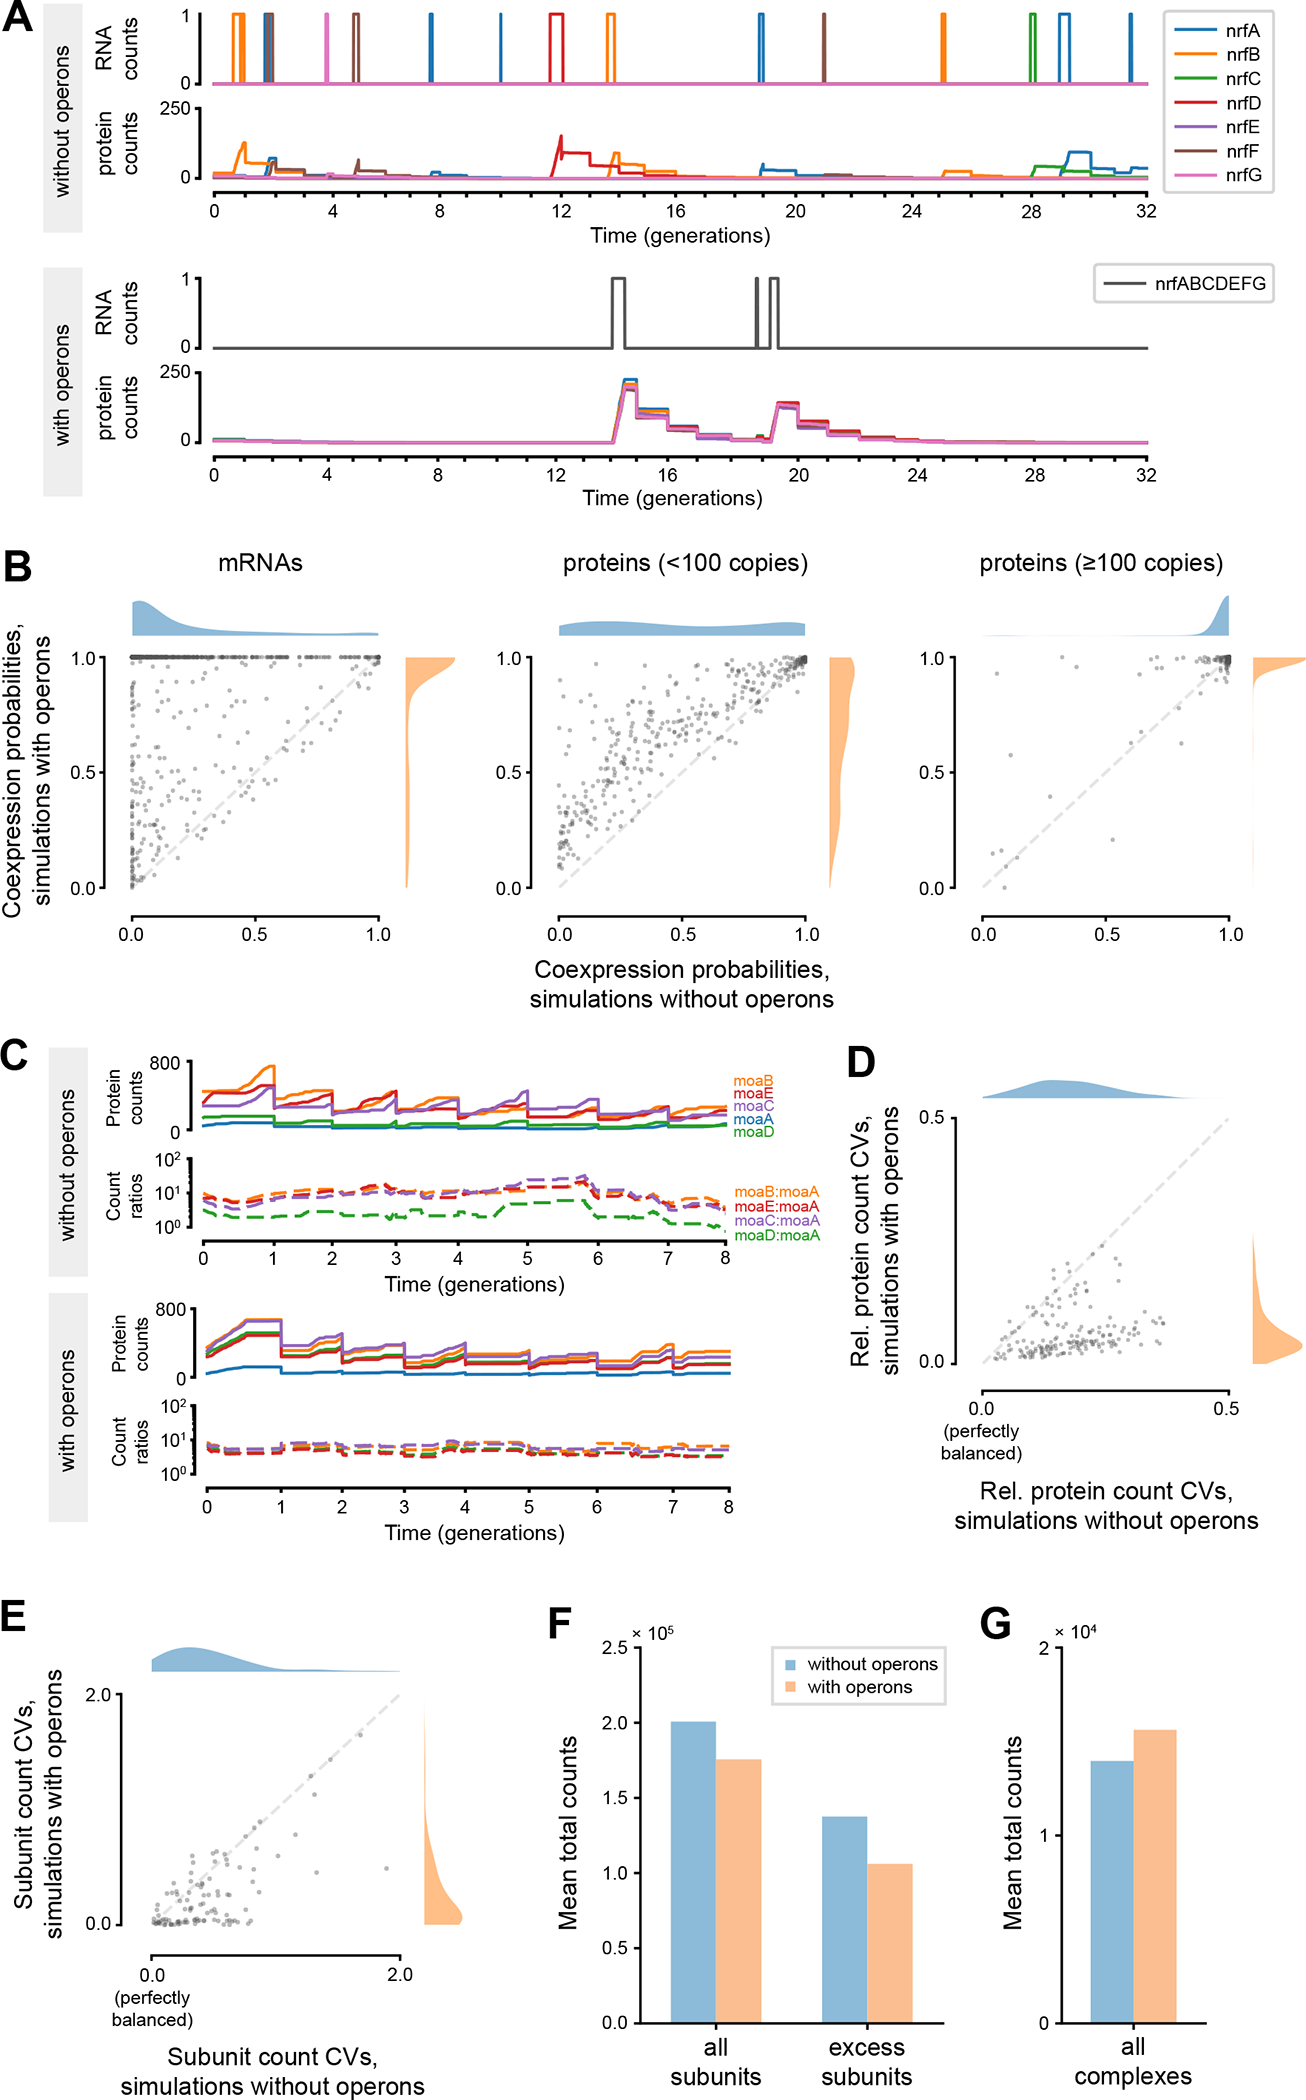
Many bacteria use operons to coregulate genes, but it remains unclear how operons benefit bacteria. We integrated E. coli's 788 polycistronic operons and 1,231 transcription units into an existing whole-cell model and found inconsistencies between the proposed operon structures and the RNA-seq read counts that the model was parameterized from. We resolved these inconsistencies through iterative, model-guided corrections to both datasets, including the correction of RNA-seq counts of short genes that were misreported as zero by existing alignment algorithms. The resulting model suggested two main modes by which operons benefit bacteria. For 86% of low-expression operons, adding operons increased the co-expression probabilities of their constituent proteins, whereas for 92% of high-expression operons, adding operons resulted in more stable expression ratios between the proteins. These simulations underscored the need for further experimental work on how operons reduce noise and synchronize both the expression timing and the quantity of constituent genes. A record of this paper's transparent peer review process is included in the supplemental information.

Keywords: RNA sequencing; cellular heterogeneity; deep curation; mechanistic modeling; microbiology; model-driven discovery; operon; transcription unit structure; transcriptional regulation; whole-cell modeling.


Conflict of interest statement

Declaration of interests The authors declare no competing interests.

Figures

Figure 1.
Figure 1.
Additional experimental data gathered from multiple, heterogeneous sources were incorporated into the E. coli whole-cell model to simulate cells that transcribe polycistronic mRNAs. (A) Schematic representation of the data curation process that was used to update the whole-cell model. We incorporated additional data on E. coli’s transcription units into the existing whole-cell model, iteratively identified inconsistencies between the input data using the simulation outputs, and made guided corrections to the input data, which were verified through comparisons with independent data, to finalize an updated version of the E. coli whole-cell model that transcribes polycistronic mRNAs. (B) Comparison of the simulated expression dynamics of the frdABCD operon before and after the update.
Figure 2.
Figure 2.
Longer doubling times of simulated cells with operons suggested an alternative transcription unit structure for the rplKAJL-rpoBC operon. See also Figure S1. (A) An example of how gene-level RNA-Seq read counts were translated into transcript-level RNA-Seq read counts using transcription unit (TU) structures and nonnegative least squares (NNLS). (B) Comparison of simulated doubling times in rich media conditions between simulations with and without operons after the initial integration of transcription unit structures from RegulonDB/EcoCyc. Simulations with operons had longer doubling times on average (38.3 ± 4.9 mins, n=964, where n is the number of simulated cells with fully completed cell cycles) compared to simulations without operons (27.2 ± 11.1 mins, n=999). (C) Comparison of mean mRNA copy numbers for genes encoding for subunits of RNAPs and ribosomes in rich media conditions between the two simulations. Copy numbers were calculated by averaging the copy numbers from the first timesteps of simulated cells with fully completed cell cycles, excluding cells from the first two generations (n=743 for simulations without operons, n=715 for simulations with operons). (D) The transcription unit structure for the rplKAJL-rpoBC operon suggested by RegulonDB/EcoCyc. This transcription unit structure was not cross-consistent with the RNA-Seq read counts of the genes in the operon. (E) Rend-seq data for the rplKAJL-rpoBC operon. A 3’-end peak is clearly visible downstream of gene rplL (arrow), suggesting the existence of a transcriptional terminator that is missing from RegulonDB/EcoCyc. Other 5’-end and 3’-end peaks in the Rend-seq data align well with existing promoters/terminators in RegulonDB/EcoCyc. (F) Additional transcription units (red) proposed for the rplKAJL-rpoBC operon based on Rend-seq data. The addition of these transcription units allows the NNLS algorithm to find a solution that aligns better with the gene-level RNA-Seq read counts. (G) Comparison of mean mRNA copy numbers for genes encoding for subunits of RNAPs and ribosomes in rich media conditions after adding the two transcription units suggested by Rend-seq data. Copy numbers were calculated by averaging the copy numbers from the first timesteps of simulated cells with fully completed cell cycles, excluding cells from the first two generations (n=743 for simulations without operons, n=731 for simulations with operons). (H) Comparison of simulated doubling times in rich media conditions after adding the two transcription units. Simulations with operons had doubling times (28.2 ± 8.1 mins, n=981, where n is the number of simulated cells with fully completed cell cycles) that are similar to simulations without operons (27.2 ± 11.1 mins, n=999).
Figure 3.
Figure 3.
Expanded investigations into the simulated outputs suggested more corrections to the input datasets. See also Figure S2. (A) Comparison of mean RNA copy numbers for mRNA genes that are part of polycistronic operons between simulations with and without operons in rich media conditions. Copy numbers were calculated by averaging the copy numbers from the first timesteps of simulated cells with fully completed cell cycles, excluding cells from the first two generations (n=743 for simulations without operons, n=731 for simulations with operons). Genes that have the top 5% largest values of |t| (|t|31.9), where t is the t-statistic between the two distributions of RNA copy numbers, are highlighted in red. The shaded oval highlights genes whose RNA copy numbers were zero in simulations without operons, but nonzero in simulations with operons. (B) Schematic representation of how read counts are calculated in standard RNA-Seq protocols. (C) The transcription unit structure and the RNA-Seq read counts of the appCBXA operon, where the RNA-Seq read count of gene appX is reported as zero because of its short length. (D) Schematic representation of how the read counts of the appX mRNA were estimated from the transcription unit structure of the operon, and the RNA-Seq read counts of other genes in the operon. (E) Schematic representation of the manual alignment algorithm used to more correctly estimate the read counts of short genes. (F) Comparison of mean RNA-Seq read counts of 14 short genes in simulated cells, both simulated with (n=762) and without (n=768) operons, versus their read counts estimated from the manual alignment algorithm, averaged across multiple RNA samples (n=3). (G) Schematic representation of how adding a transcription unit spanning the stable genes of an operon could lead to a more accurate representation of the operon’s mRNA stoichiometries. (H) The distribution of the maximum values of |t| among constituent genes for operons that had a transcription unit covering the stable genes in RegulonDB/EcoCyc (left), operons that did not have such a transcription unit (middle), and the same operons after adding the transcription unit covering the stable genes (right). (I) The transcription unit structures and the gene-level RNA-Seq read counts reported for the oppABCDF operon (top) and the Rend-seq data for the same operon (middle). Based on the existence of the 3’-end (arrow) downstream of gene oppA in the Rend-seq data, we added an additional transcription unit (oppA, red) to the operon (bottom). (J) The transcription unit structures and the gene-level RNA-Seq read counts reported for the cmk-rpsA-ihfB operon (top) and the Rend-seq data for the same operon (middle). Based on the existence of the 5’-ends and 3’-end (arrows) surrounding the gene rpsA in the Rend-seq data, we added an additional transcription unit (rpsA, red) to the operon (bottom).
Figure 4.
Figure 4.
The updated model transcribes longer, but fewer, mRNA molecules to maintain a slightly lower total mRNA mass. See also Figure S3. (A) Comparison of the distributions of mRNA lengths between simulations with and without operons. (B) Comparison of the distributions of the total number of mRNA molecules between simulations with and without operons. (C) Comparison of the distributions of the total mRNA mass between simulations with and without operons. In all panes, the reported values were taken from each simulated cell with a fully completed cell cycle (n=768 for simulations without operons, n=758 for simulations with operons). Dashed lines represent the mean values across each simulation set.
Figure 5.
Figure 5.
Comparisons between simulations with and without operons suggested possible benefits operons can bring to bacteria. (A) Simulated dynamics of mRNA and protein counts for genes in the nrfABCDEFG operon, in simulations without and with operons. (B) Comparisons of coexpression probabilities of each operon, between simulations with and without operons. Operons increase these probabilities at the mRNA level (left) and, for low-expression genes, at the protein level (middle), but not for high-expression genes at the protein level (right). See Table S3 for full data. (C) Simulated dynamics of absolute and relative protein counts for genes in the moaABDEC operon, in simulations without and with operons. (D) Comparison of coefficients of variation (CV) calculated from relative protein counts for each operon, between simulations with and without operons. See Table S4 for full data. (E) Comparison of coefficients of variation calculated from subunit counts normalized with complexation stoichiometries for each protein complex, between simulations with and without operons. See Table S5 for full data. (F) Comparison of total counts of all protein subunits and excess subunits between simulations with and without operons. (G) Comparison of total counts of all protein complexes between simulations with and without operons. In all panes, the reported values are averages of the respective values taken from each simulated cell with a fully completed cell cycle (n=768 for simulations without operons, n=758 for simulations with operons).

Similar articles

Cited by

References

    1. Jacob F, and Monod J (1961). Genetic regulatory mechanisms in the synthesis of proteins. Journal of Molecular Biology 3, 318–356. 10.1016/s0022-2836(61)80072-7. - DOI - PubMed
    1. Lawrence JG, and Roth JR (1996). Selfish Operons: Horizontal Transfer May Drive the Evolution of Gene Clusters. Genetics 143, 1843–1860. 10.1093/genetics/143.4.1843. - DOI - PMC - PubMed
    1. Lawrence JG (2003). GENE ORGANIZATION: Selection, Selfishness, and Serendipity. Annual Review of Microbiology 57, 419–440. 10.1146/annurev.micro.57.030502.090816. - DOI - PubMed
    1. Price MN, Huang KH, Arkin AP, and Alm EJ (2005). Operon formation is driven by co-regulation and not by horizontal gene transfer. Genome Research 15, 809–819. 10.1101/gr.3368805 - DOI - PMC - PubMed
    1. Shieh Y-W, Minguez P, Bork P, Auburger JJ, Guilbride DL, Kramer G, and Bukau B (2015). Operon structure and cotranslational subunit association direct protein assembly in bacteria. Science 350, 678–680. 10.1126/science.aac8171 - DOI - PubMed

LinkOut - more resources