

SpaceANOVA: Spatial Co-occurrence Analysis of Cell Types in Multiplex Imaging Data Using Point Process and Functional ANOVA
- PMID: 38417823
- PMCID: PMC11002919
- DOI: 10.1021/acs.jproteome.3c00462
SpaceANOVA: Spatial Co-occurrence Analysis of Cell Types in Multiplex Imaging Data Using Point Process and Functional ANOVA
Abstract
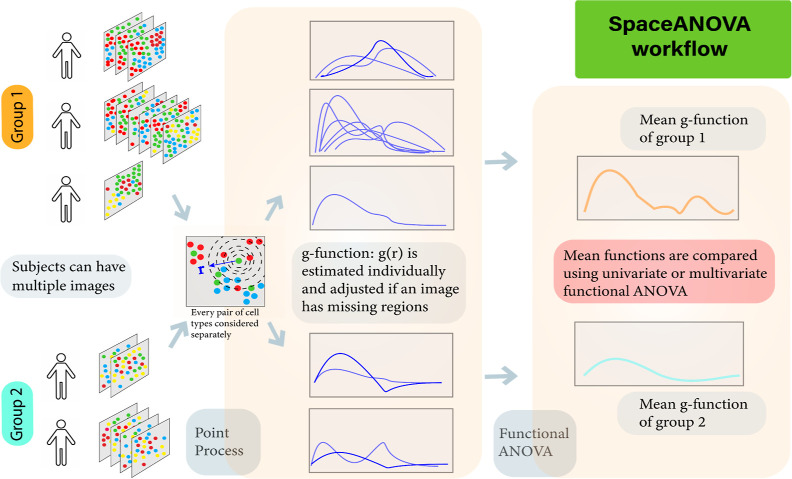
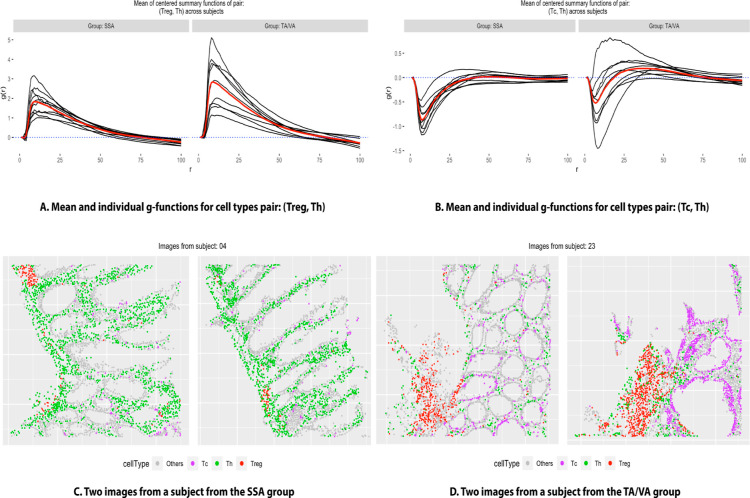
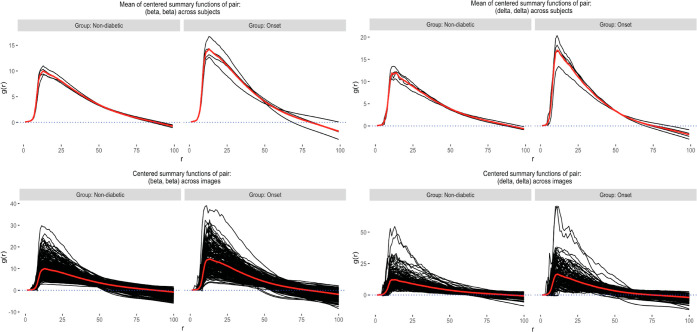
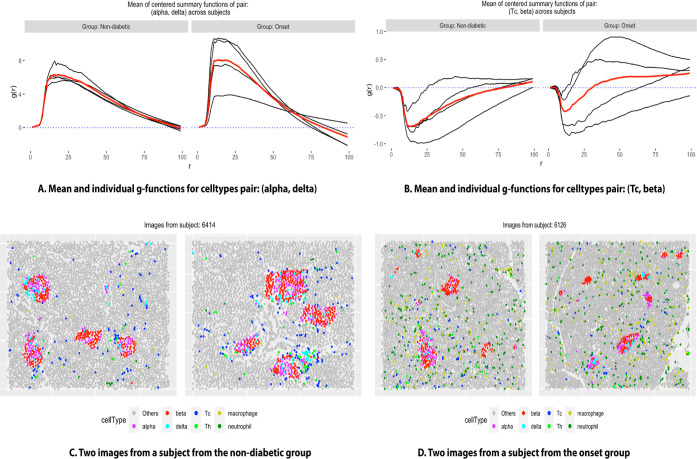
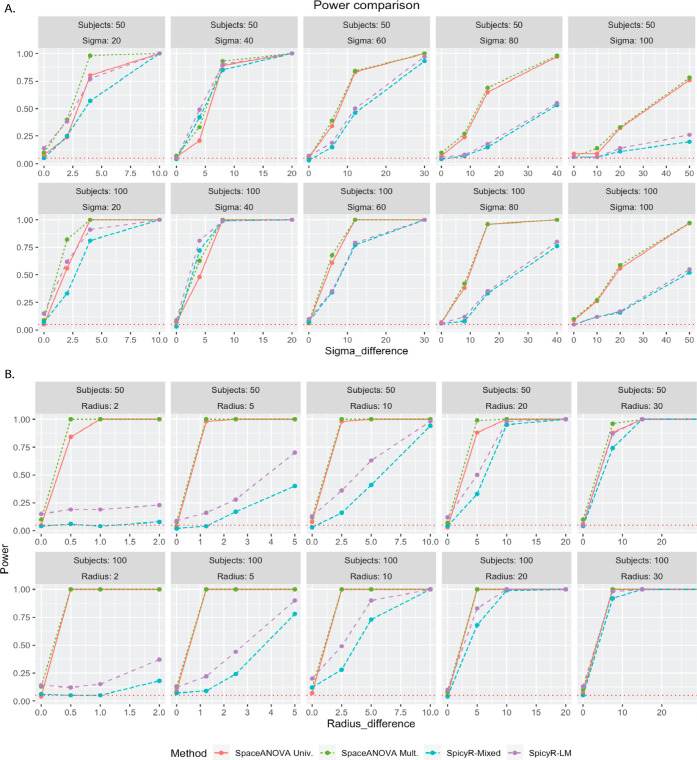
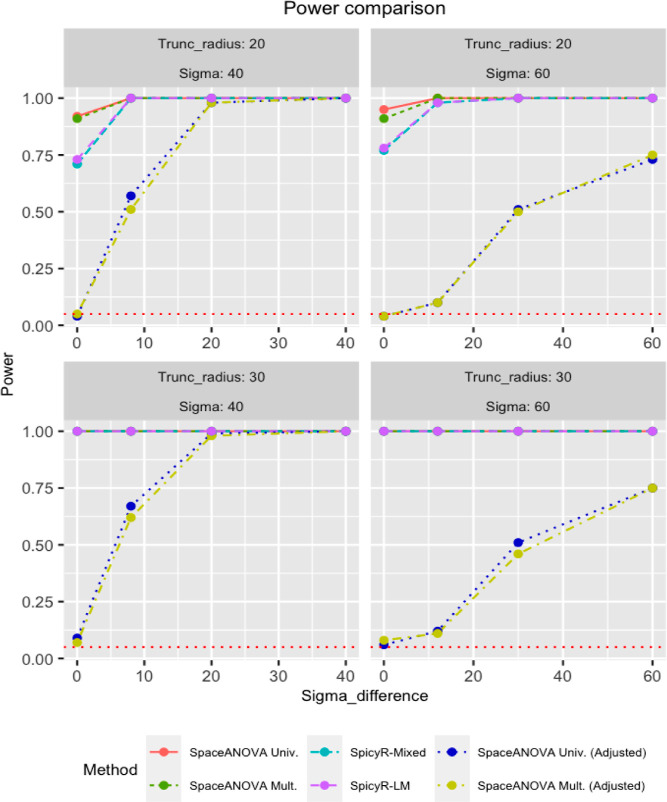
Multiplex imaging platforms have enabled the identification of the spatial organization of different types of cells in complex tissue or the tumor microenvironment. Exploring the potential variations in the spatial co-occurrence or colocalization of different cell types across distinct tissue or disease classes can provide significant pathological insights, paving the way for intervention strategies. However, the existing methods in this context either rely on stringent statistical assumptions or suffer from a lack of generalizability. We present a highly powerful method to study differential spatial co-occurrence of cell types across multiple tissue or disease groups, based on the theories of the Poisson point process and functional analysis of variance. Notably, the method accommodates multiple images per subject and addresses the problem of missing tissue regions, commonly encountered due to data-collection complexities. We demonstrate the superior statistical power and robustness of the method in comparison with existing approaches through realistic simulation studies. Furthermore, we apply the method to three real data sets on different diseases collected using different imaging platforms. In particular, one of these data sets reveals novel insights into the spatial characteristics of various types of colorectal adenoma.
Keywords: IMC; MIBI; R package; co-localization; colorectal adenoma; differential study; multiplex immunofluorescence.
Conflict of interest statement
The authors declare no competing financial interest.
Figures
Update of
-
SpaceANOVA: Spatial co-occurrence analysis of cell types in multiplex imaging data using point process and functional ANOVA.bioRxiv [Preprint]. 2023 Jul 9:2023.07.06.548034. doi: 10.1101/2023.07.06.548034. bioRxiv. 2023. Update in: J Proteome Res. 2024 Apr 5;23(4):1131-1143. doi: 10.1021/acs.jproteome.3c00462. PMID: 37461579 Free PMC article. Updated. Preprint.
Similar articles
-
SpaceANOVA: Spatial co-occurrence analysis of cell types in multiplex imaging data using point process and functional ANOVA.bioRxiv [Preprint]. 2023 Jul 9:2023.07.06.548034. doi: 10.1101/2023.07.06.548034. bioRxiv. 2023. Update in: J Proteome Res. 2024 Apr 5;23(4):1131-1143. doi: 10.1021/acs.jproteome.3c00462. PMID: 37461579 Free PMC article. Updated. Preprint.
-
Multiplex Tissue Imaging: Spatial Revelations in the Tumor Microenvironment.Cancers (Basel). 2022 Jun 28;14(13):3170. doi: 10.3390/cancers14133170. Cancers (Basel). 2022. PMID: 35804939 Free PMC article. Review.
-
SMASH: Scalable Method for Analyzing Spatial Heterogeneity of genes in spatial transcriptomics data.PLoS Genet. 2023 Oct 20;19(10):e1010983. doi: 10.1371/journal.pgen.1010983. eCollection 2023 Oct. PLoS Genet. 2023. PMID: 37862362 Free PMC article.
-
Navigating the cellular landscape in tissue: Recent advances in defining the pathogenesis of human disease.Comput Struct Biotechnol J. 2022 Sep 15;20:5256-5263. doi: 10.1016/j.csbj.2022.09.005. eCollection 2022. Comput Struct Biotechnol J. 2022. PMID: 36212528 Free PMC article. Review.
-
The Effectiveness of Integrated Care Pathways for Adults and Children in Health Care Settings: A Systematic Review.JBI Libr Syst Rev. 2009;7(3):80-129. doi: 10.11124/01938924-200907030-00001. JBI Libr Syst Rev. 2009. PMID: 27820426
Cited by
-
Detecting Clinically Relevant Topological Structures in Multiplexed Spatial Proteomics Imaging Using TopKAT.bioRxiv [Preprint]. 2024 Dec 21:2024.12.18.628976. doi: 10.1101/2024.12.18.628976. bioRxiv. 2024. PMID: 39764056 Free PMC article. Preprint.
-
mxfda: a comprehensive toolkit for functional data analysis of single-cell spatial data.Bioinform Adv. 2024 Nov 13;4(1):vbae155. doi: 10.1093/bioadv/vbae155. eCollection 2024. Bioinform Adv. 2024. PMID: 39552929 Free PMC article.
-
Diagnostic features of Acanthamoeba keratitis via in vivo confocal microscopy.Sci Rep. 2025 Mar 29;15(1):10940. doi: 10.1038/s41598-025-94567-0. Sci Rep. 2025. PMID: 40157973 Free PMC article.
-
A Spatial Omnibus Test (SPOT) for Spatial Proteomic Data.bioRxiv [Preprint]. 2024 Mar 13:2024.03.08.584117. doi: 10.1101/2024.03.08.584117. bioRxiv. 2024. Update in: Bioinformatics. 2024 Jul 1;40(7):btae425. doi: 10.1093/bioinformatics/btae425. PMID: 38559053 Free PMC article. Updated. Preprint.
-
A Spatial Omnibus Test (SPOT) for Spatial Proteomic Data.Bioinformatics. 2024 Jul 1;40(7):btae425. doi: 10.1093/bioinformatics/btae425. Bioinformatics. 2024. PMID: 38950184 Free PMC article.
References
-
- Liu C. C.; McCaffrey E. F.; Greenwald N. F.; Soon E.; Risom T.; Vijayaragavan K.; Oliveria J. P.; Mrdjen D.; Bosse M.; Tebaykin D.; et al. Multiplexed ion beam imaging: insights into pathobiology. Annu. Rev. Pathol.: Mech. Dis. 2022, 17, 403–423. 10.1146/annurev-pathmechdis-030321-091459. - DOI - PubMed
Publication types
MeSH terms
Grants and funding
LinkOut - more resources
Full Text Sources
