. 2024 Feb 28;12(2):e008318.
doi: 10.1136/jitc-2023-008318.

Paired single-B-cell transcriptomics and receptor sequencing reveal activation states and clonal signatures that characterize B cells in acute myeloid leukemia

Affiliations

Paired single-B-cell transcriptomics and receptor sequencing reveal activation states and clonal signatures that characterize B cells in acute myeloid leukemia

Shengnan Guo et al. J Immunother Cancer. .

Abstract

Background: Acute myeloid leukemia (AML) is associated with a dismal prognosis. Immune checkpoint blockade (ICB) to induce antitumor activity in AML patients has yielded mixed results. Despite the pivotal role of B cells in antitumor immunity, a comprehensive assessment of B lymphocytes within AML's immunological microenvironment along with their interaction with ICB remains rather constrained.

Methods: We performed an extensive analysis that involved paired single-cell RNA and B-cell receptor (BCR) sequencing on 52 bone marrow aspirate samples. These samples included 6 from healthy bone marrow donors (normal), 24 from newly diagnosed AML patients (NewlyDx), and 22 from 8 relapsed or refractory AML patients (RelRef), who underwent assessment both before and after azacitidine/nivolumab treatment.

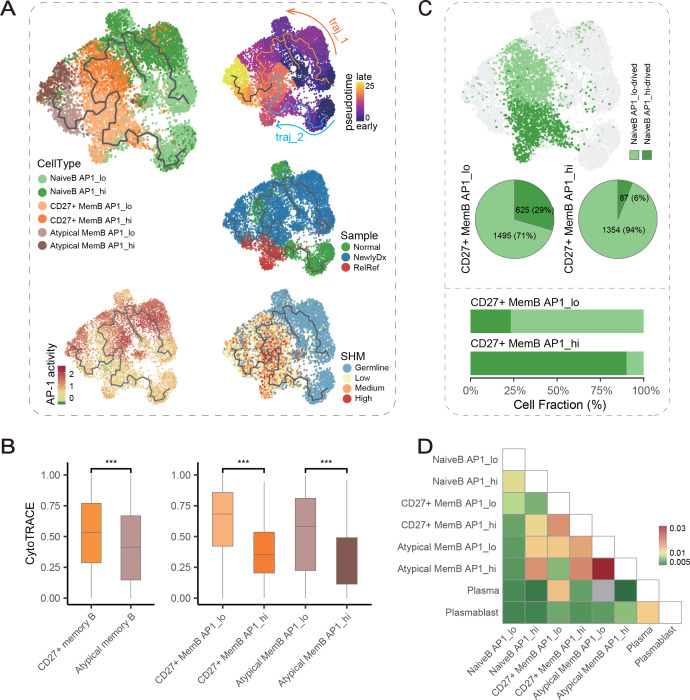
Results: We delineated nine distinct subtypes of B cell lineage in the bone marrow. AML patients exhibited reduced nascent B cell subgroups but increased differentiated B cells compared with healthy controls. The limited diversity of BCR profiles and extensive somatic hypermutation indicated antigen-driven affinity maturation within the tumor microenvironment of RelRef patients. We established a strong connection between the activation or stress status of naïve and memory B cells, as indicated by AP-1 activity, and their differentiation state. Remarkably, atypical memory B cells functioned as specialized antigen-presenting cells closely interacting with AML malignant cells, correlating with AML stemness and worse clinical outcomes. In the AML microenvironment, plasma cells demonstrated advanced differentiation and heightened activity. Notably, the clinical response to ICB was associated with B cell clonal expansion and plasma cell function.

Conclusions: Our findings establish a comprehensive framework for profiling the phenotypic diversity of the B cell lineage in AML patients, while also assessing the implications of immunotherapy. This will serve as a valuable guide for future inquiries into AML treatment strategies.

Keywords: Computational Biology; Gene Expression Profiling; Immune Checkpoint Inhibitors; Tumor Microenvironment.


Figures

Figure 1
Figure 1
Schematic design of the research and single-cell BCR repertoire features in the bone marrow of AML patients. (A) Schematic diagram of the research design, visualized by BioRender (https://biorender.com/). Bone marrow aspirates were obtained from 6 healthy donors, 24 NewlyDx, and 22 RelRef AML samples. Single-cell RNA sequencing (scRNA) and single-cell BCR sequencing (scBCR) data were generated for each sample. B cells and plasma cells were isolated for further analysis. (B) The relative clonal space occupied by the clonotypes divided by the bins of top 1:3, 4:50, 51:100, and 101:200 in each sample, was generated by the scRepertoire R package (V.1.7.0). (C) Clonotype diversity distribution of different sample types calculated as 1/Simpson’s clonal diversity index (mean±SD). (D) Boxplot depicted the somatic hypermutation frequency across three groups of samples (left). Per cent bar graph showing the somatic hypermutation categories composition among three sample types. Germline: mutation frequency=0; low: 0<mutation frequency≤3%; medium: 3%<mutation frequency≤6%; high: mutation frequency>6% (right). (E) Fraction of IGHG and IGHA isotypes in B cell lineage among three groups of samples. The significance test between RelRef versus normal and NewlyDx samples was performed by the Wilcoxon rank-sum test (left). Per cent bar graph showing the isotype categories composition among three sample types (right). RelRef samples in (B–E) figures referred to Relapsed/Refractory patients prior to azacytidine+nivolumab treatment (20, 560 cells).
Figure 2
Figure 2
B cell lineage definition and association with clinical manifestations. (A) Uniform Manifold Approximation and Projection (UMAP) embeddings of B cell lineage, colored by B cell and plasma cell subtypes (top) and highlighted by isotype categories (bottom). (B) Bubble plot depicted the canonical marker gene expression level in B-lineage subgroups. (C) UMAP embeddings and per cent bar graph showing the somatic hypermutation categories distribution among B cell and plasma subgroups. (D) UMAP embeddings exhibiting the distribution bias of B lineage cells from different sample types. (E) Violin plot displaying the B-lineage subtypes enrichment preference in NewlyDx compared with normal samples. The red and green colors represented the current cell type enriched in NewlyDx and normal samples, respectively. The enrichment value logFC was calculated by miloR. (F) Per cent bar graph showing the B cell and plasma cell categories composition among three sample types. RelRef in figure (F) referred to the samples prior to azacytidine+nivolumab treatment.
Figure 3
Figure 3
AP-1 activity defines subclusters of naïve and memory B cells in acute myeloid leukemia (AML) patients. (A) Violin plots exhibited AP-1 activity score between NewlyDx AML and normal samples in our data and Lasry cohort (top left). Uniform Manifold Approximation and Projection (UMAP) embeddings exhibiting the AP-1 activity score in naïve and memory B cells (10, 053 cells, top right) and the distribution of naïve and memory B cells across different sample types (bottom). (B) Scatter plot showing the consistency of altered gene expression in three comparable groups, in which X-axis and Y-axis denoted the log2-transformed fold change values of CD27+MemB AP1_hi versus CD27+MemB AP1_lo and NaiveB AP1_hi versus NaïveB AP1_lo groups, respectively. Dots were colored based on log2-transformed fold change values in NewlyDx versus normal samples, with red indicating upregulated and blue indicating downregulated genes (top). Heatmap depicting by the log2-transformed fold change values in differential expressed genes (|log2FC|>0.3) of naïve and memory B cell in NewlyDx versus normal (middle) and atypical MemB AP1_hi versus atypical MemB AP1_lo (bottom). (C) Scatter plot exhibiting ranked hallmarks and KEGG pathways correlated with AP-1 in where red dots representing significant positive terms (Spearman correlation coefficient>0 and p<0.05) in our dataset. (D) Violin plots illustrating the differences in activity scores of functional terms between NewlyDx and normal in our data and the Lasry cohort. Significant p values between the two groups were calculated using the Wilcoxon rank-sum test. (E) Boxplot depicted the difference of AP-1 activity score between unique and expanded memory B cells. (F) B-cell receptor (BCR) clonotype diversity distribution between MemB AP1_lo and MemB AP1_hi cells, calculated as 1/Simpson’s clonal diversity index (mean±SD). *p<0.05, **p<0.01, ***p<0.001, and ****p<0.0001, ns, non-significant.
Figure 4
Figure 4
Pseudotime analysis reveals potential transitional dynamics among B-cell lineage subgroups. (A) Naïve and memory B cells developmental trajectories were inferred using Monocle3, and colored by cell type subsets, inferred pseudotime, sample types, somatic hypermutation (SHM) categories and AP-1 activity score, separately. AP1_lo and AP1_hi represent B cells characterized by low AP-1 activity and high AP-1 activity, respectively. (B) Boxplot depicted the difference of CytoTRACE score in memory B cell subgroups. (C) The transcriptome similarity between CD27+ memory B cells and naïve B cells was measured by SingleR and presented as Uniform Manifold Approximation and Projection (UMAP) plot and pie charts (top), as well as per cent bar graph calculated by the TransferData function in Seurat package (bottom). (D) Heatmap depicting the transition index between major B cell subclusters, was generated using STARTRAC. The color red indicated a high probability of transition, with 0.03 being the maximum truncation value. *p<0.05, **p<0.01, ***p<0.001, and ****p<0.0001, ns, non-significant.
Figure 5
Figure 5
Atypical memory B cells were specialized for antigen presentation and interacted tightly with acute myeloid leukemia (AML) malignant cells. Violin plot showing the difference of B-cell receptor (BCR) signaling pathway (A) and antigen processing and presentation pathway scores (B) across B cell subclusters. (C) Ligand-receptor interaction between naïve/memory B cell subgroups and myeloid cells in NewlyDx samples. Heatmaps were used to display the normalized expression levels of the ligand-receptor genes, with highly expressed genes shown in red. (D) The lollipop chart visualized the enriched biological process term of receptor genes in AML cells. The circles on the chart were colored based on their Benjamini-Hochberg (BH)-adjusted p values. (E) Cox proportional hazard analysis smoothed by ligand-receptor gene expression level, illustrating their relationship with overall survival (OS) in the TCGA LAML cohort. Samples were divided into low (L), medium (M), and high (H) groups based on their gene expression levels. The red curve represents the results obtained using the Cox proportional hazards model, while the dotted curves indicate the 95% CI of the log HR. (F) Kaplan-Meier curves displaying differences in OS probability among TCGA LAML patients whose tumors had high, medium, or low levels of the ligand-receptor gene signature. The log-rank p value was calculated between the high and low patient groups. (G) Boxplot showing the difference in LSC17 signature scores between patients whose tumors had low and high levels of the ligand-receptor gene signature in the TCGA LAML cohort. Significant p values between the two groups were calculated using the Wilcoxon rank-sum test. (H) Cox proportional hazard analysis smoothed by ligand-receptor gene expression level, illustrating their relationship with OS in the Abbas et al cohort. Samples were divided into low (L), medium (M), and high (H) groups based on their gene expression levels. The red curve represents the results obtained using the Cox proportional hazards model, while the dotted curves indicate the 95% CI of the log HR. (I) Kaplan-Meier curves displaying differences in OS probability among patients in Abbas et al cohort whose tumors had high, medium, or low levels of the ligand-receptor gene signature. The log-rank p value was calculated between the high and low patient groups. (J) Boxplot showing the difference in LSC17 signature scores between patients whose tumors had low and high levels of the ligand-receptor gene signature in Abbas et al cohort. Significant p values between the two groups were calculated using the Wilcoxon rank-sum test.
Figure 6
Figure 6
Further differentiation and stimulated status of plasma cells in acute myeloid leukemia (AML) microenvironment. (A) Plasma cell developmental trajectory was inferred using Monocle2 and colored by plasma subtypes (left). Number of expressed genes (middle) and CytoTRACE score (right) in each cell distribution along with differentiate trajectory (top) and pseudotime (bottom) were exhibited by Loess smooth curves. (B) Boxplot depicted the difference of CytoTRACE scores in IGHA and IGHG isotypes. (C) Four Isotype categories (top) and kernel density enrichment of IGHG versus IGHA isotypes distribution (bottom) along with differentiate trajectory, in which green color denoted enriched in IGHA and red color denoted enriched in IGHG isotype. The IGHG versus IGHA kernel density enrichment values were calculated by estimating the probability density distribution of IGHG and IGHA isotypes along pseudotime using Gaussian kernel functions, and the ratio of each pseudotime point was then calculated. (D) Violin plot showing the expression levels of IGHG genes across four types of samples. (E) Kernel density enrichment of AML versus normal samples distribution with differentiate trajectory (top) in which green color denoted enriched in normal samples and red color denoted enriched in AML samples. And The density distribution of normal and AML samples along pseudotime was shown using a ridgeline plot (bottom). (F) Boxplot depicting the difference in CytoTRACE scores of plasma cells between normal and NewlyDx samples. (G) Heatmap of ordered top 3000 highly variable gene expression along the pseudotime. Antibody genes are indicated as a green segment on the left, and the enriched biological process terms are labeled on the right. (H) Expression level of long-lived plasma cell marker genes in differentiate trajectory. (I) The transcriptome similarity between plasma cells and memory B cells was measured by SingleR. *p<0.05, **p<0.01, ***p<0.001, and ****p<0.0001, ns, non-significant.
Figure 7
Figure 7
Characterization of B cells and plasma cells undergoing azacytidine+nivolumab treatment in relapsed/refractory patients. (A) The relative clonal space occupied by the clonotypes was divided by the bins of top 1:5, 6:100, 101:200, and 201:500 in RelRef samples before and after azacytidine+nivolumab treatment. (B) Clonotype diversity distribution of RelRef samples before and after azacytidine+nivolumab treatment, calculated as 1/Simpson’s clonal diversity index (mean±SD). (C) The bar graph displays the proportion of immunotherapy response among the novel emerging, expanded, and contracted clonotypes in the post-treatment group, compared with the samples collected before treatment. (D) Boxplot depicted the difference of CytoTRACE score of plasma cells between RelRef samples collected before and after azacytidine+nivolumab treatment. Boxplot showing the difference of AP-1 (E) and tumor necrosis factor alpha signaling via NFKB pathway scores (F) among RelRef patients with different immunotherapy response. (G) Plasma cell fraction in relation to immunotherapy response among RelRef patients. Significant p values between the two groups were calculated using the Wilcoxon rank-sum test. *p<0.05, **p<0.01, ***p<0.001, and ****p<0.0001, ns, non-significant. CR, complete response; NR, no response; PR, partial response; SD, stable disease.

References

    1. Siegel RL, Miller KD, Fuchs HE, et al. . Cancer statistics, 2022. CA Cancer J Clin 2022;72:7–33. 10.3322/caac.21708 - DOI - PubMed
    1. Horowitz MM, Gale RP, Sondel PM, et al. . Graft-versus-leukemia reactions after bone marrow transplantation. Blood 1990;75:555–62. 10.1182/blood.V75.3.555.555 - DOI - PubMed
    1. Kolb HJ, Schattenberg A, Goldman JM, et al. . Graft-versus-leukemia effect of donor lymphocyte transfusions in marrow grafted patients. Blood 1995;86:2041–50. - PubMed
    1. Vadakekolathu J, Minden MD, Hood T, et al. . Immune landscapes predict chemotherapy resistance and immunotherapy response in acute myeloid leukemia. Sci Transl Med 2020;12:eaaz0463. 10.1126/scitranslmed.aaz0463 - DOI - PMC - PubMed
    1. Davids MS, Kim HT, Bachireddy P, et al. . Ipilimumab for patients with relapse after allogeneic transplantation. N Engl J Med 2016;375:143–53. 10.1056/NEJMoa1601202 - DOI - PMC - PubMed

Publication types