. 2024 Feb 28;15(1):1840.
doi: 10.1038/s41467-024-46111-3.

Toxoplasma gondii actin filaments are tuned for rapid disassembly and turnover

Affiliations

Toxoplasma gondii actin filaments are tuned for rapid disassembly and turnover

Kelli L Hvorecny et al. Nat Commun. .

Abstract

The cytoskeletal protein actin plays a critical role in the pathogenicity of the intracellular parasite, Toxoplasma gondii, mediating invasion and egress, cargo transport, and organelle inheritance. Advances in live cell imaging have revealed extensive filamentous actin networks in the Apicomplexan parasite, but there are conflicting data regarding the biochemical and biophysical properties of Toxoplasma actin. Here, we imaged the in vitro assembly of individual Toxoplasma actin filaments in real time, showing that native, unstabilized filaments grow tens of microns in length. Unlike skeletal muscle actin, Toxoplasma filaments intrinsically undergo rapid treadmilling due to a high critical concentration, fast monomer dissociation, and rapid nucleotide exchange. Cryo-EM structures of jasplakinolide-stabilized and native (i.e. unstabilized) filaments show an architecture like skeletal actin, with differences in assembly contacts in the D-loop that explain the dynamic nature of the filament, likely a conserved feature of Apicomplexan actin. This work demonstrates that evolutionary changes at assembly interfaces can tune the dynamic properties of actin filaments without disrupting their conserved structure.


Conflict of interest statement

The authors declare no competing interests.

Figures

Fig. 1
Fig. 1. Imaging and analysis of TgAct1 polymerization in vitro.
a Domain organization of TgAct1 fused to a β-thymosin–HIS tag and purification strategy of untagged TgAct1 from Sf9 cells. b Coomassie-stained SDS-PAGE gel of (lane 1) protein molecular weight marker; (lane 2) TgAct1–β-thymosin–HIS following HIS purification; (lane 3) TgAct1 after chymotryptic digest; (lane 4) purified TgAct1 after ion-exchange and size exclusion chromatography (N = 3). c Schematic of the in vitro polymerization assay. TgAct1 monomers (blue) were induced for polymerization and added to a blocked flow chamber absorbed with NEM-myosin II. Epifluorescence microscopy was used to image the TgAct1 filament dynamics by inclusion of 25–50 nM actin chromobody fused to EmeraldFP (EmFP) (green). d Epifluorescence microscopy image of TgAct1 filaments in the in vitro polymerization assay showing filament lengths >60 µm (N = 3). e Montage of a single TgAct1 filament shrinking from the pointed (−) end and growing from the barbed (+) end in the presence of 16 µM TgAct1 monomers. The Blue dashed line indicates the position of the (−) end at time zero (N = 3). f Measuring the filament length of five representative filaments over time shows a constant growth rate over 1200 s. g Kymographs for three individual filaments in the presence of 16 µM TgAct1 monomers showing disassembly from the pointed (−) end and assembly from the barbed (+) end. Rates for individual filaments are shown in subunits per second (N = 3). h Plot of the rate of barbed (+) end growth in subunits/sec, per actin concentration for TgAct1 (blue) compared to skeletal actin (orange). The data shown is an aggregate of three independent preps presented as mean values ± SD. The average critical concentration (Cc), determined by the x-intercept of the fitted line, is higher for TgAct1 (6.5 µM) compared to skeletal actin (0.09 µM). i Plot of barbed (−) end disassembly rate per TgAct1 concentration. The average Cc for the barbed-end, determined by the x-intercept of the fitted line, is 73.5 µM. Error for critical concentrations is the standard deviation of the mean for three independent TgAct1 preparations. Source data are provided as a Source Data file.
Fig. 2
Fig. 2. Cellular concentration and kinetic analysis of TgAct1.
a Anti-actin western blot of T. gondii parasite lysate and known amounts of purified TgAct1. The average cellular concentration of TgAct1 (148 ± 7.6 µM) was determined by comparing the relative band intensity of a known number of parasites to those of known amounts of purified TgAct1. Error ± SEM, n = 4 independent experiments from two independent lysates. b Comparison of TgAct1 cellular concentrations to other known model systems. Cartoons created with BioRender.com. c Time course of phosphate release from 12 µM TgAct1 (blue) and skeletal actin (orange) after inducing polymerization. Error bars represent the standard deviation of the mean for three independent experiments. d Plot of Pi-release rates over a range of TgAct1 concentrations. Conditions: 25 mM Imidazole, pH 7.4, 50 mM KCl, 1 mM EGTA, 2 mM MgCl2, 0.2 mM MgATP,1 mM DTT, 37 °C. Data were presented as mean values ± SD, n = 3 independent experiments. e Time courses of fluorescence change after mixing a large molar excess of MgATP with an equilibrated mixture of actin monomers with bound MgɛATP. The solid black lines through the data represent the best fits single exponentials, yielding the rate constant for ɛATP dissociation (k-ɛATP) from TgAct1 (blue) and skeletal actin (orange). Conditions: 20 µM actin, 25 mM Imidazole, pH 7.4, 50 mM KCl, 1 mM EGTA, 2 mM MgCl2,1 mM DTT, 0.5 mM MgATP, 37 °C. f Bar graph of average k-ATP for TgAct1 (blue, 0.16 ± 0.03) and skeletal actin (orange, 0.003 ± 0.0002). Error ± SD, n = 3. Source data are provided as a Source Data file.
Fig. 3
Fig. 3. Negative stain electron microscopy of TgAct1 filaments.
a TgAct1 filaments were observed in conditions where the concentration of MgATP was increased from 0.1 to 1 mM and shorter incubation time points were checked (10–30 min). b Increased numbers and lengths of filaments were identified on grids assembled at the 20-min time point where the water washes in between protein application and addition of uranyl formate were skipped. For each condition, one grid was prepared and a minimum of two separate locations on each grid were imaged.
Fig. 4
Fig. 4. Comparison of unstabilized TgAct1 filament to skeletal actin filaments.
a Micrograph of TgAct1 filaments in the presence of 1 mM MgATP; see Table 2 for dataset statistics. b Reconstruction of TgAct1 filaments in the presence of 1 mM MgATP; protomers in shades of blue. The circle indicates the location of the d-loop in one protomer. c Overlay of d-loops from unstabilized TgAct1 filament model (Toxo Act1, blue) and the skeletal actin filament 8d13 (orange). d, e View of the d-loop (ribbon and sticks) and binding pocket (surface) from TgAct1 (d, blue) and skeletal actin (e, orange). d-loop residues within 5 Å of the pocket are shown as sticks. f, g View of the d-loop (surface) and binding pocket (ribbon and sticks) from TgAct1 (f, blue) and skeletal actin (g, orange). Residues within 5 Å of the d-loop are shown as sticks, except for TgAct1 F376, which is shown for illustrative purposes only. Dotted lines indicate the locations of d-loop residues 41–44 (TgAct1) and 40–43 (skeletal actin). h, i Surface representation of a protomer of TgAct1 (h, blue) and skeletal actin (i, orange), with the shaded regions showing the buried surface area for each protomer.
Fig. 5
Fig. 5. Comparison of stabilized and unstabilized TgAct1 filaments to actin filaments from other species.
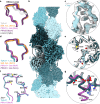
a The d-loops from unstabilized TgAct1 (gray), chicken skeletal actin (Sktl Act., orange, PDB ID 8d13), P. falciparum Act1 + jasplakinolide (PfAct1 + Jas, magenta, PDB ID 6tu4), P. falciparum Act2 (PfAct2, purple, PDB ID 8ccn), and L. major Act (LmAct, dark gray, PDB ID 7q8c). b Reconstruction of TgAct1 filaments in the presence of 33 µM jasplakinolide and 0.1 mM MgATP; protomers in shades of blue. The circle indicates the location of the d-loop in panel c and the approximate locations of the ribbon diagrams in e and g. c Overlay of volume from the D-loops of TgAct1 + jasplakinolide (blue) and unstabilized TgAct1 (gray). d The d-loops from TgAct1 + jasplakinolide (blue), chicken skeletal actin (orange, PDB ID 8d13), P. falciparum Act1 + jasplakinolide (magenta, PDB ID 6tu4), and P. falciparum Act2 + jasplakinolide (purple, PDB ID 8cco). e Overlay of the d-loop and binding pocket from unstabilized TgAct1 filaments (gray) and TgAct1 + jasplakinolide filaments (blue). The backbone is shown as a ribbon with select residues shown as sticks. f Overlay of ribbon diagrams showing d-loop residues 39–48 from TgAct1 + jasplakinolide and P. falciparum Act1 + jasplakinolide (magenta, PDB ID 6tu4). g Overlay of ribbon diagram comparing the C-termini from TgAct1 + jasplakinolide (dark teal) and P. falciparum Act1 + jasplakinolide (magenta, PDB ID 6tu4).
Fig. 6
Fig. 6. The filament properties of Toxoplasma actin versus skeletal actin.
A low barbed-end assembly rate and a high pointed-end disassembly rate leads to a high critical concentration for TgAct1 relative to skeletal actin—an effect mediated in part by changes within the d-loop of TgAct1. Paired with the ability to rapidly exchange nucleotide, actin filaments in T. gondii rapidly treadmill at concentrations where skeletal actin filaments elongate. Change in rates of TgAct1 assembly, disassembly, and nucleotide exchange compared to skeletal muscle actin are indicated in gray text. k-, disassembly: subunits·sec−1; k+, assembly: subunits·µM−1·s−1.

Update of

References

    1. Rorman E, Zamir CS, Rilkis I, Ben-David H. Congenital toxoplasmosis-prenatal aspects of Toxoplasma gondii infection. Reprod. Toxicol. 2006;21:458–472. doi: 10.1016/j.reprotox.2005.10.006. - DOI - PubMed
    1. Wang ZD, et al. Prevalence and burden of Toxoplasma gondii infection in HIV-infected people: a systematic review and meta-analysis. Lancet Hiv. 2017;4:e177–e188. doi: 10.1016/S2352-3018(17)30005-X. - DOI - PubMed
    1. Torgerson PR, Mastroiacovo P. The global burden of congenital toxoplasmosis: a systematic review. Bull. World Health Organ. 2013;91:501–508. doi: 10.2471/BLT.12.111732. - DOI - PMC - PubMed
    1. Dobrowolski JM, Niesman IR, Sibley LD. Actin in the parasite Toxoplasma gondii is encoded by a single copy gene, ACT1 and exists primarily in a globular form. Cell Motil. Cytoskeleton. 1997;37:253–262. doi: 10.1002/(SICI)1097-0169(1997)37:3<253::AID-CM7>3.0.CO;2-7. - DOI - PubMed
    1. Dobrowolski JM, Sibley LD. Toxoplasma invasion of mammalian cells is powered by the actin cytoskeleton of the parasite. Cell. 1996;84:933–939. doi: 10.1016/S0092-8674(00)81071-5. - DOI - PubMed