. 2024 Feb 28;15(1):1832.
doi: 10.1038/s41467-024-46134-w.

Molecular and clinical analyses of PHF6 mutant myeloid neoplasia provide their pathogenesis and therapeutic targeting

Affiliations

Molecular and clinical analyses of PHF6 mutant myeloid neoplasia provide their pathogenesis and therapeutic targeting

Yasuo Kubota et al. Nat Commun. .

Abstract

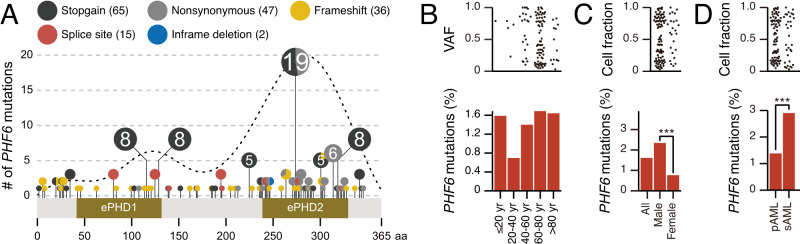
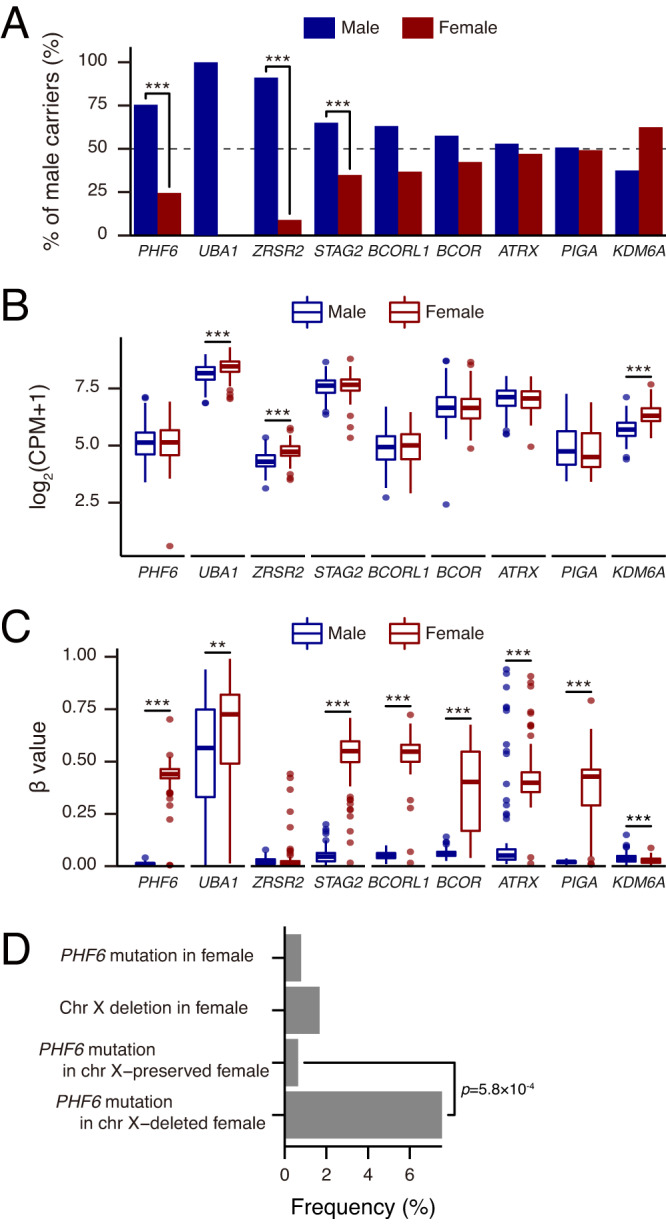
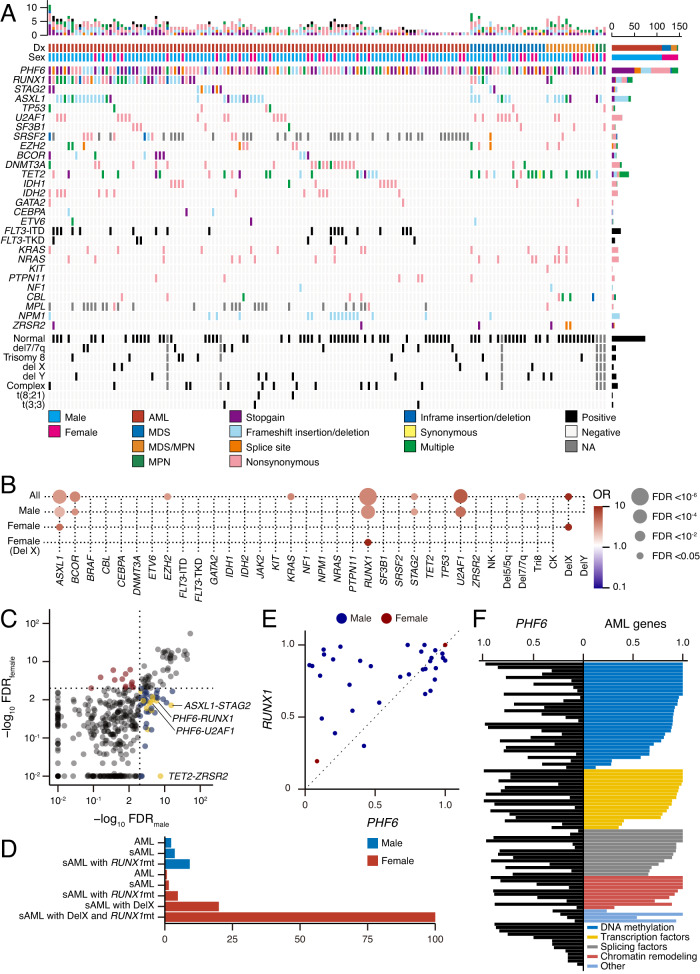
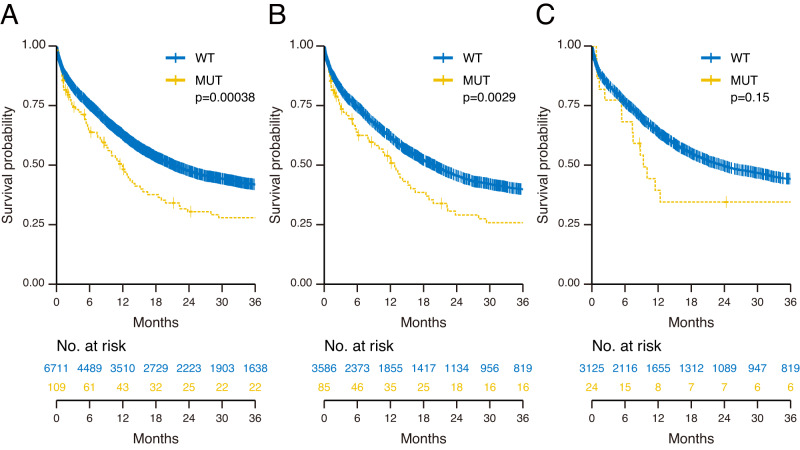
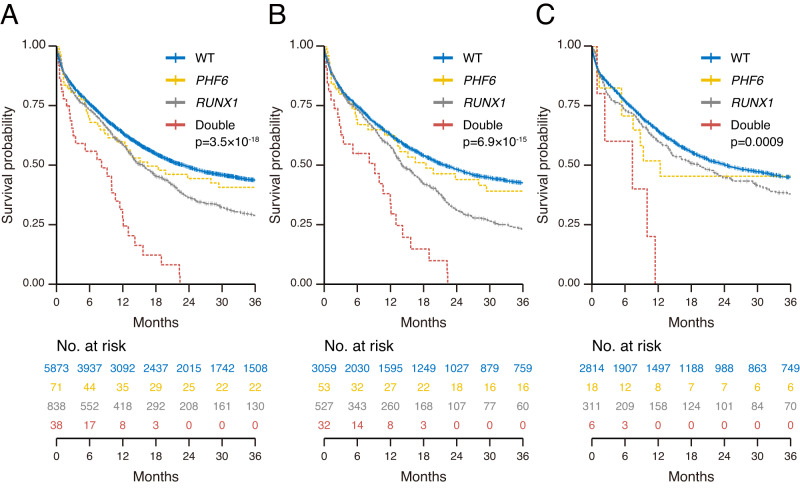
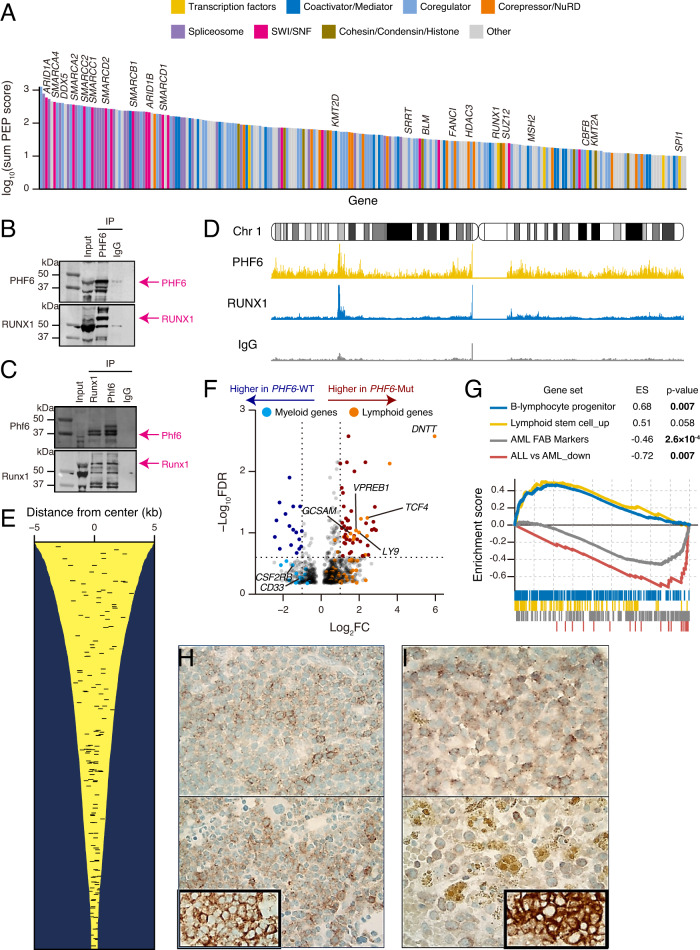
PHF6 mutations (PHF6MT) are identified in various myeloid neoplasms (MN). However, little is known about the precise function and consequences of PHF6 in MN. Here we show three main findings in our comprehensive genomic and proteomic study. Firstly, we show a different pattern of genes correlating with PHF6MT in male and female cases. When analyzing male and female cases separately, in only male cases, RUNX1 and U2AF1 are co-mutated with PHF6. In contrast, female cases reveal co-occurrence of ASXL1 mutations and X-chromosome deletions with PHF6MT. Next, proteomics analysis reveals a direct interaction between PHF6 and RUNX1. Both proteins co-localize in active enhancer regions that define the context of lineage differentiation. Finally, we demonstrate a negative prognostic role of PHF6MT, especially in association with RUNX1. The negative effects on survival are additive as PHF6MT cases with RUNX1 mutations have worse outcomes when compared to cases carrying single mutation or wild-type.


Conflict of interest statement

This work was supported by an R35HL135795 (to J.P.M.), The Leukemia & Lymphoma Society TRP Award 6645-22 (to J.P.M.), and by a grant from the Edward P. Evans Foundation (to C.G.). The remaining authors declare no competing interests.

Figures

Fig. 1
Fig. 1. The frequencies and positions of PHF6 mutations.
A Lollipop plot illustrating PHF6 mutational spectrum in this study group. Mutational subtypes are shown by colors as indicated. The numbers in circles indicate the number of cases. B Comparisons of frequencies of PHF6 mutations based on patients’ age groups (≤20 years, n = 63; 20–40 years, n = 577; 40–60 years, n = 1716; 60–80 years, n = 4090, >80 years, n = 671). Each dot in the upper panel represents the variant allelic frequencies with PHF6 mutations. C Comparisons of frequencies of PHF6 mutations in each sex of AML cases (n = 3715 and 3172, respectively). Each dot in the upper panel represents the cell fractions with PHF6 mutations. D Comparisons of frequencies of PHF6 mutations in primary and secondary AML cases (n = 5785 and 1102, respectively). Each dot in the upper panel represents the cell fractions with PHF6 mutations. C, D p values were calculated by two-sided Fisher’s exact test. *p < 0.05, **p < 0.01, ***p < 0.001. Raw p values are as follows: p = 1.6×10⁻⁹ (male vs. female AML) and 6.4 × 10−4 (primary vs. secondary AML).
Fig. 2
Fig. 2. The frequencies of mutations of genes on X chromosome and association with DNA methylation, expression, and X chromosome.
A Comparisons of frequencies of mutations in genes on X chromosome in AML cases (n = 6887). The genes are ordered by mutation rate in male cases. The frequencies of UBA1 and PIGA mutations were based on other our cohorts. Raw p values are as follows: p = 2.2 × 10−6 (PHF6), 1.2 × 10−5 (ZRSR2), and 4.7 × 10−4 (STAG2). B Comparisons of mRNA expression levels in genes on X chromosome between male (n = 139) and female (n = 113) cases in the Beat AML cohort. The p value was calculated using the two-tailed Student’s t test. The mean, 25th, and 75th percentiles are represented in the box plots by the midline and box edges, respectively. The whiskers extend to 1.5 times the interquartile range. Dots represent each outlier of expression. Raw FDR are as follows: FDR = 9.3 × 10−7 (UBA1), 3.2 × 10−16 (ZRSR2), and 8.5 × 10−25 (KDM6A). C Comparisons of DNA methylation levels in the promoter regions of genes mapping on X chromosome between male (n = 103) and female (n = 99) cases in the Beat AML cohort. The mean, 25th, and 75th percentiles are represented in the box plots by the midline and box edges, respectively. The whiskers extend to 1.5 times the interquartile range. Dots represent each outlier of DNA methylation. Raw FDR are as follows: p = 2.9 × 10−72 (PHF6), 1.0 × 10−3 (UBA1), 7.2 × 10−63 (STAG2), 2.0 × 10−73 (BCORL1), 1.3 × 10−27 (BCOR), 2.9 × 10−25 (ATRX), 3.4 × 10−44 (PIGA), and 2.1 × 10−5 (KDM6A). D Comparisons of frequencies of PHF6 mutations and X chromosome deletions in female AML cases (PHF6 mutation and X chromosome deletion, n = 4; PHF6 wild-type and X chromosome deletion, n = 49; PHF6 mutation and normal X chromosome, n = 20; PHF6 wild-type and normal X chromosome, n = 3091). A, D p values were calculated by two-sided Fisher’s exact test and not adjusted for multiple comparison. *p < 0.05, **p < 0.01, ***p < 0.001. B, C, p values were calculated by using two-tailed Student’s t test and adjusted by Benjamini–Hochberg correction. *FDR < 0.05, **FDR < 0.01, ***FDR < 0.001.
Fig. 3
Fig. 3. The correlation of PHF6 mutations with other genetic mutations.
A Genetic landscape of PHF6-mutated MN. Mutational subtypes are shown by colors as indicated. B Bubble plot showcasing statistically significant (FDR < 0.05) positive (red) and negative (blue) correlations across gene group in all (n = 6887), male (n = 3715), female (n = 3172), and female with X chromosome deletion (n = 53). C The significance in combinations of mutated genes between male and female AML (n = 3715 and 3172, respectively). D The frequencies of PHF6 mutations based on each AML subtype. E The cell fraction with PHF6 versus RUNX1 mutations in AML. F Each horizontal bar represents the cell fractions with mutations of PHF6 and other AML-associated genes in each case. B p values were calculated by two-sided Fisher’s exact test and adjusted for multiple comparisons with Benjamini–Hochberg adjustment.
Fig. 4
Fig. 4. Clinical impact of PHF6 mutations in AML.
A Kaplan–Meier survival curves of overall survival for all AML cases with and without PHF6 mutations (n = 109 and 6711, respectively). B Kaplan–Meier survival curves of overall survival for male AML cases with and without PHF6 mutations (n = 85 and 3586, respectively). C Kaplan–Meier survival curves of overall survival for female AML cases with and without PHF6 mutations (n = 24 and 3125, respectively). For survival analysis, survival was estimated using the Kaplan–Meier method, and the log-rank test was used to assess differences between groups.
Fig. 5
Fig. 5. Clinical impact of PHF6 and RUNX1 mutations in AML.
A Kaplan–Meier survival curves of overall survival for all AML cases with double mutations (PHF6 and RUNX1; n = 38), single mutations (PHF6, n = 71; RUNX1, n = 838), and negative cases (n = 5873). B Kaplan–Meier survival curves of overall survival for male AML cases with double mutations (PHF6 and RUNX1; n = 32), single mutations (PHF6, n = 53; RUNX1, n = 527), and negative cases (n = 3059). C Kaplan–Meier survival curves of overall survival for female AML cases with double mutations (PHF6 and RUNX1; n = 6), single mutations (PHF6, n = 18; RUNX1, n = 311), and negative cases (n = 2814). For survival analysis, survival was estimated using the Kaplan–Meier method, and the log-rank test was used to assess differences between groups.
Fig. 6
Fig. 6. Co-immunoprecipitated proteins with PHF6 and expression profiling in PHF6-mutated AML.
A Waterfall plot represents the significance of each protein in co-immunoprecipitated proteins with PHF6. Transcription factors, coactivator/mediator, coregulator, corepressor/NuRD, Spliceosome, SWI/SNF, cohesion/condensing/histone, and other proteins are shown by colors as indicated. B Western blots of endogenous PHF6 IP of THP-1 nuclear protein extracts. 5% input, PHF6 IP, and IgG control IP product were run side by side. The same membrane was probed with an anti-rabbit monoclonal antibody to PHF6 and an anti-mouse monoclonal antibody to RUNX1. PHF6 and RUNX1 bands are indicated by arrows in pink color. C Reciprocal IPs of endogenous Phf6 and Runx1 with mouse spleen and bone marrow protein extracts. 5% input, Runx1 IP, Phf6 IP, and IgG control IP product were run side by side. The same membrane was probed with rabbit monoclonal antibody to Phf6 and mouse monoclonal antibody to Runx1. Phf6 and Runx1 bands are indicated by pink arrows. D Normalized distribution of PHF6, RUNX1 ChIPseq, and IgG control intensities in chromosome 1 in THP-1. E PHF6 and RUNX1 co-localization in active enhancer regions. Each yellow line showed H3K27ac enrichment around the peak. Each black bar shows co-localized regions of PHF6 and RUNX1. F Volcano plot comparing significant expression difference between PHF6-mutated (n = 7) and wild-type (n = 132) male AML. Lymphoid and myeloid genes with differentially expression are colored orange and blue, respectively. The Bayesian method by the linear models for microarray expression data (limma) package version 3.50.0 in R software. G GSEA plot showing changes in lymphoid and myeloid signature genes between PHF6-mutated (n = 7) and wild-type (n = 132) AML. To perform the enrichment of the difference between PHF6MT and WT AML, we used the GSEA software (v.4.3.2). H Positive cytoplasmic immunohistochemistry staining of LY9 in blasts in 2 PHF6-mutated AML cases. Inlet shows positive control of LY9 (×500). I Positive cytoplasmic immunohistochemistry staining of GCSAM in blasts in 2 PHF6-mutated AML cases. Inlet shows positive control of GCSAM (×500).

Similar articles

Cited by

References

    1. Lower KM, et al. Mutations in PHF6 are associated with Börjeson-Forssman-Lehmann syndrome. Nat. Genet. 2002;32:661–665. doi: 10.1038/ng1040. - DOI - PubMed
    1. Van Vlierberghe P, et al. PHF6 mutations in T-cell acute lymphoblastic leukemia. Nat. Genet. 2010;42:338–342. doi: 10.1038/ng.542. - DOI - PMC - PubMed
    1. Mori T, et al. Somatic PHF6 mutations in 1760 cases with various myeloid neoplasms. Leukemia. 2016;30:2270–2273. doi: 10.1038/leu.2016.212. - DOI - PubMed
    1. Voss AK, et al. Protein and gene expression analysis of Phf6, the gene mutated in the Börjeson-Forssman-Lehmann Syndrome of intellectual disability and obesity. Gene Expr. Patterns. 2007;7:858–871. doi: 10.1016/j.modgep.2007.06.007. - DOI - PubMed
    1. Loontiens S, et al. PHF6 expression levels impact human hematopoietic stem cell differentiation. Front. Cell Dev. Biol. 2020;8:599472. doi: 10.3389/fcell.2020.599472. - DOI - PMC - PubMed

Substances