. 2024 Feb 28;15(1):1848.
doi: 10.1038/s41467-024-46027-y.

Functional regulation of aquaporin dynamics by lipid bilayer composition

Affiliations

Functional regulation of aquaporin dynamics by lipid bilayer composition

Anh T P Nguyen et al. Nat Commun. .

Abstract

With the diversity of lipid-protein interactions, any observed membrane protein dynamics or functions directly depend on the lipid bilayer selection. However, the implications of lipid bilayer choice are seldom considered unless characteristic lipid-protein interactions have been previously reported. Using molecular dynamics simulation, we characterize the effects of membrane embedding on plant aquaporin SoPIP2;1, which has no reported high-affinity lipid interactions. The regulatory impacts of a realistic lipid bilayer, and nine different homogeneous bilayers, on varying SoPIP2;1 dynamics are examined. We demonstrate that SoPIP2;1's structure, thermodynamics, kinetics, and water transport are altered as a function of each membrane construct's ensemble properties. Notably, the realistic bilayer provides stabilization of non-functional SoPIP2;1 metastable states. Hydrophobic mismatch and lipid order parameter calculations further explain how lipid ensemble properties manipulate SoPIP2;1 behavior. Our results illustrate the importance of careful bilayer selection when studying membrane proteins. To this end, we advise cautionary measures when performing membrane protein molecular dynamics simulations.


Conflict of interest statement

The authors declare no competing interests.

Figures

Fig. 1
Fig. 1. System compositions of SoPIP2;1 molecular dynamics simulations.
a Crystal structures of the open (PDB ID: 2B5F, red) and closed (PDB ID: 1Z98, blue) states of spinach aquaporin in the ribbon representation. Key differences between the structures are indicated, including the “plug residue” Leu197 (shown in the stick representation) and loop D. b Chemical structures of the lipids used and their composition in the complex lipid bilayer (if present). Enclosed in the box are the lipids used in the homogeneous bilayer systems, covering all three headgroups and varying levels of acyl chain unsaturation. POPC (1-palmitoyl-2-oleoyl-sn-glycero-3-phosphocholine; 16:0/18:1), POPE (1-palmitoyl-2-oleoyl-sn-glycero-3-phosphoethanolamine; 16:0/18:1), POPG (-palmitoyl-2-oleoyl-sn-glycero-3-phosphatidylglycerol; 16:0/18:1), PLPC (1-palmitoyl-2-linoleoyl-sn-glycero-3-phosphocholine; 16:0/18:2), PLPE (1-palmitoyl-2-linoleoyl-sn-glycero-3-phosphoethanolamine; 16:0/18:2), PLPG (1-palmitoyl-2-linoleoyl-sn-glycero-3-phosphatidylglycerol; 16:0/18:2), LLPC (1-linoleoyl-2-linolenoyl-sn-glycero-3-phosphocholine; 18:2/18:3), LLPE (1-linoleoyl-2-linolenoyl-sn-glycero-3-phosphoethanolamine; 18:2/18:3), LLPG (1-linoleoyl-2-linolenoyl-sn-glycero-3-phosphatidylglycerol; 18:2/18:3), DLiPC (1,2-dilinoleoyl-sn-glycero-3-phosphocholine; 18:2/18:2), DLiPE (1,2-dilinoleoyl-sn-glycero-3-phosphoethanolamine; 18:2/18:2), STIG (stigmasterol), and SITO (ß-sitosterol). For more information on lipid bilayer assembly and lipid names, please refer to our “Methods—System assembly” section.
Fig. 2
Fig. 2. Free energy of the SoPIP2;1 opening/closing transition from simulations.
MSM-weighted (stationary distribution applied) energy landscapes of SoPIP2;1 conformational changes in lipid bilayer systems (nine homogeneous and one complex membrane) projected onto the first two components of the time-lagged independent component analysis (tICA). The clusters most similar to the open and closed crystal structures are located on the landscapes as a red and blue dot, respectively. The distance feature most correlated to each component is indicated on the axes labels and located on the crystal structure to the right of each landscape. The residues involved in the first and second time-lagged independent components (tIC1 and tIC2) are shown in the blue and pink stick representations, respectively. Loop D is highlighted in orange as a reference. The colorbars represent free energy expressed as kcal mol−1.
Fig. 3
Fig. 3. Mean first passage time (MFPT) of SoPIP2;1 opening/closing transitions.
MFPT of the transition between the crystal structure clusters in the landscapes of Fig. 2. Data are presented as mean values ± SEM of 200 bootstrapped samples. Individual data distributions for each MFPT calculation are provided in Supplementary Fig. 16.
Fig. 4
Fig. 4. Characterization of pore plug Leu197 in each of the respective SoPIP2:bilayer macrostates.
a Atoms used in the dihedral angle calculation shown on the crystal structures of the open (PDB ID: 2B5F, pink) and closed (PDB ID: 1Z98, blue) states. Residues are shown in the stick representation, and atoms involved in the calculations are shown in the ball representation. b Simplified schematics of the dihedral angle between the Cγ of Leu197 and Cß of Ala182. c Violin plots of the dihedral angle in each macrostate of each lipid bilayer system. Distributions in (c) are calculated using 1000 randomly selected samples (frames) from each respective metastable state energy minima. Data in (c) are presented as mean values ± SEM.
Fig. 5
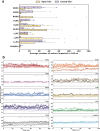
Fig. 5. Water transport activity of SoPIP2;1.
a Average number of waters transported per 100-ns trajectory for the open-like (yellow) and closed-like (purple) SoPIP2;1 macrostates. Errors are calculated as standard deviations among the closed-like or open-like trajectories. b Time evolution of the average number of waters occupying the protein pore of each macrostate in each bilayer system. Water transport data shown here was calculated using n = 3, where three independent continuous 100-ns trajectories (10,000 frames) were selected from each metastable free energy state per SoPIP2:lipid system. For reported water transport values in (a), data were grouped based off the relative open-like or closed-like character of the metastable state trajectories. Data in (a) are presented as mean values ± SEM.
Fig. 6
Fig. 6. Structural comparison of two extreme transport cases for the SoPIP2;1 open state embedded in two different lipid bilayers system (LLPE and complex).
a Pore HOLE radius along the z-position of the SoPIP2;1 protein pore aligned with the distribution of the Cß z-positions in key residues inside the protein pore (the ar/R selectivity filter, NPA motif, and coil occluding the pore). The error bar for the radius at each z position is calculated as the standard deviation of the 10,000 frames of the trajectory. b Hydrogen bonding and hydrophobic interaction of key residues most different between the non-transport (top) and transport (bottom) cases. Highlighted residues are shown in stick representations. Leu197 and loop D are also shown as a reference point. c Cross section of the SoPIP2;1 pore surface indicating water blockage of the non-transporting open SoPIP2;1 (top, blue) and transporting open SoPIP2;1 (bottom, orange). Data in (a) are presented as mean values across the trajectory for each given point in the pore ± SD.
Fig. 7
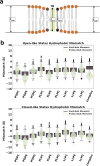
Fig. 7. Mismatch in thickness of SoPIP2;1 and the bilayer.
a Schematics of protein thickness, annular shell thickness, and bulk membrane thickness. Mismatch is calculated as the difference between the protein thickness and the bulk membrane thickness, along with the difference between the annular shell thickness and the bulk membrane thickness. b Violin plots of the protein-bulk mismatch (light green) and box plots of the shell-bulk mismatch (dark brown) for the open- and closed-like macrostates of each bilayer system. Distributions in (b) are calculated using 1000 randomly selected samples (frames) from each respective metastable state energy minima. Data in (b) are presented as mean values ± SEM.
Fig. 8
Fig. 8. Water transport activity and lipid order parameter in the open states of the homogeneous bilayer systems.
Each square shows the projection on the xy plane of the lipids (scatter dots colored by average lipid order parameter, Scc, bottom legend) and protein (heatmap colored by transmembrane helices, right legend) for one 100-ns representative trajectory of a given water conductivity and average annular shell order parameter. Empty squares indicate no trajectory found for high water transport activity and high lipid order parameters. The red-to-blue colorbar represents the Scc order parameter.

Update of

Similar articles

Cited by

References

    1. Krogh A, Larsson B, von Heijne G, Sonnhammer EL. Predicting transmembrane protein topology with a hidden Markov model: application to complete genomes. J. Mol. Biol. 2001;305:567–580. doi: 10.1006/jmbi.2000.4315. - DOI - PubMed
    1. Santos R, et al. A comprehensive map of molecular drug targets. Nat. Rev. Drug Discov. 2017;16:19–34. doi: 10.1038/nrd.2016.230. - DOI - PMC - PubMed
    1. Gulezian E, et al. Membrane protein production and formulation for drug discovery. Trends Pharmacol. Sci. 2021;42:657–674. doi: 10.1016/j.tips.2021.05.006. - DOI - PubMed
    1. Banik S, Dutta D. Membrane proteins in plant salinity stress perception, sensing, and response. J. Membr. Biol. 2023;256:109–124. doi: 10.1007/s00232-023-00279-9. - DOI - PubMed
    1. wwPDB consortium. Protein Data Bank: the single global archive for 3D macromolecular structure data. Nucleic Acids Res. 2019;47:D520–D528. doi: 10.1093/nar/gky949. - DOI - PMC - PubMed

MeSH terms