

Development and validation of a simplified risk prediction model for preterm birth: a prospective cohort study in rural Ethiopia
- PMID: 38418507
- PMCID: PMC10901814
- DOI: 10.1038/s41598-024-55627-z
Development and validation of a simplified risk prediction model for preterm birth: a prospective cohort study in rural Ethiopia
Abstract
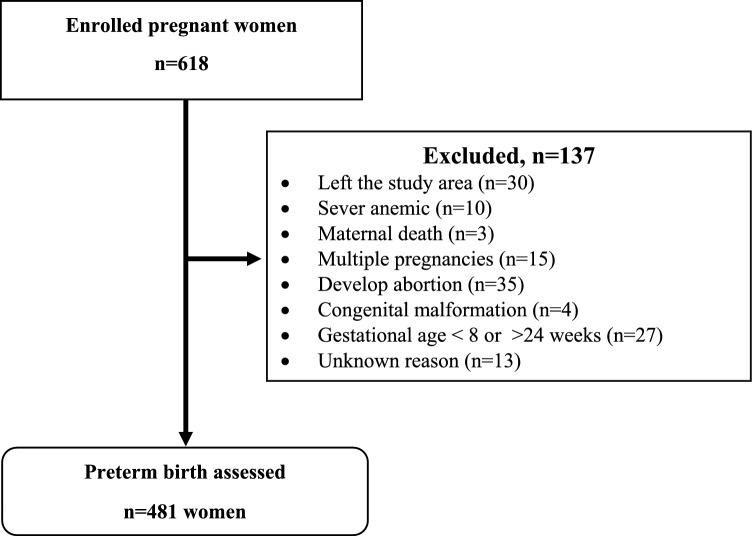
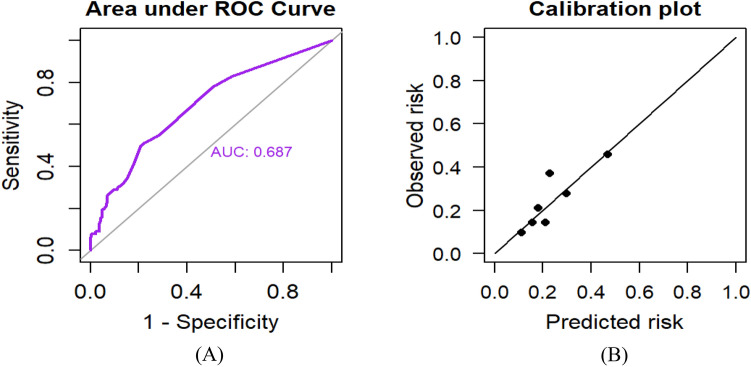
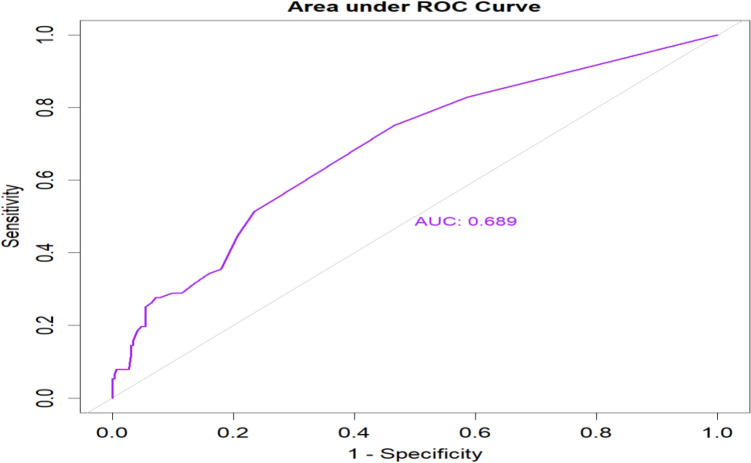
Preterm birth is one of the most common obstetric complications in low- and middle-income countries, where access to advanced diagnostic tests and imaging is limited. Therefore, we developed and validated a simplified risk prediction tool to predict preterm birth based on easily applicable and routinely collected characteristics of pregnant women in the primary care setting. We used a logistic regression model to develop a model based on the data collected from 481 pregnant women. Model accuracy was evaluated through discrimination (measured by the area under the Receiver Operating Characteristic curve; AUC) and calibration (via calibration graphs and the Hosmer-Lemeshow goodness of fit test). Internal validation was performed using a bootstrapping technique. A simplified risk score was developed, and the cut-off point was determined using the "Youden index" to classify pregnant women into high or low risk for preterm birth. The incidence of preterm birth was 19.5% (95% CI:16.2, 23.3) of pregnancies. The final prediction model incorporated mid-upper arm circumference, gravidity, history of abortion, antenatal care, comorbidity, intimate partner violence, and anemia as predictors of preeclampsia. The AUC of the model was 0.687 (95% CI: 0.62, 0.75). The calibration plot demonstrated a good calibration with a p-value of 0.713 for the Hosmer-Lemeshow goodness of fit test. The model can identify pregnant women at high risk of preterm birth. It is applicable in daily clinical practice and could contribute to the improvement of the health of women and newborns in primary care settings with limited resources. Healthcare providers in rural areas could use this prediction model to improve clinical decision-making and reduce obstetrics complications.
Keywords: Ethiopia; Prediction model; Pregnant women; Preterm birth; Risk score.
© 2024. The Author(s).
Conflict of interest statement
The authors declare no competing interests.
Figures

Similar articles
-
Development and validation of a prognosis risk score model for preterm birth among pregnant women who had antenatal care visit, Northwest, Ethiopia, retrospective follow-up study.BMC Pregnancy Childbirth. 2023 Oct 17;23(1):732. doi: 10.1186/s12884-023-06018-1. BMC Pregnancy Childbirth. 2023. PMID: 37848836 Free PMC article.
-
Development of a prognostic model for predicting spontaneous singleton preterm birth.Eur J Obstet Gynecol Reprod Biol. 2012 Oct;164(2):150-5. doi: 10.1016/j.ejogrb.2012.07.007. Epub 2012 Jul 21. Eur J Obstet Gynecol Reprod Biol. 2012. PMID: 22824569
-
Is intimate partner violence and obstetrics characteristics of pregnant women associated with preterm birth in Ethiopia? Umbrella review on preterm birth.Reprod Health. 2023 Nov 17;20(1):168. doi: 10.1186/s12978-023-01716-7. Reprod Health. 2023. PMID: 37978546 Free PMC article.
-
Prognostic risk score development to predict birth asphyxia using maternal and fetal characteristics in South Gondar zone hospitals, north West Ethiopia.BMC Pediatr. 2022 Sep 10;22(1):537. doi: 10.1186/s12887-022-03582-x. BMC Pediatr. 2022. PMID: 36088319 Free PMC article.
-
Preterm birth and its associated factors in Ethiopia: a systematic review and meta-analysis.Afr Health Sci. 2021 Sep;21(3):1321-1333. doi: 10.4314/ahs.v21i3.43. Afr Health Sci. 2021. PMID: 35222597 Free PMC article.
References
-
- World Health Organization (WHO) Recommended definitions, terminology, and format for statistical tables related to the perinatal period and use of a new certificate for the cause of perinatal deaths. Modifications recommended by FIGO as amended October 14, 1976. Acta Obstetr. Gynecol. Scand. 1977;56(3):247–253. - PubMed
-
- Howson, C., Kinney, M. & Lawn. J. March of dimes, PMNCH, save the children, WHO. Born Too Soon: The Global Action Report on Preterm Birth (World Health Organization, 2012).
-
- World Health Organization(WHO). Born Too Soon: The Global Action Report on Preterm Birth (Springer, 2012).
-
- World Health Organization (WHO). Preterm birth (2018, accessed 19 Feb 2018). https://www.who.int/news-room/fact-sheets/detail/preterm-birth.
MeSH terms
LinkOut - more resources
Full Text Sources
