. 2024 Feb 28;14(1):4842.
doi: 10.1038/s41598-024-54429-7.

Validation of body surface colonic mapping (BSCM) against high resolution colonic manometry for evaluation of colonic motility

Affiliations

Validation of body surface colonic mapping (BSCM) against high resolution colonic manometry for evaluation of colonic motility

Sean H B Seo et al. Sci Rep. .

Abstract

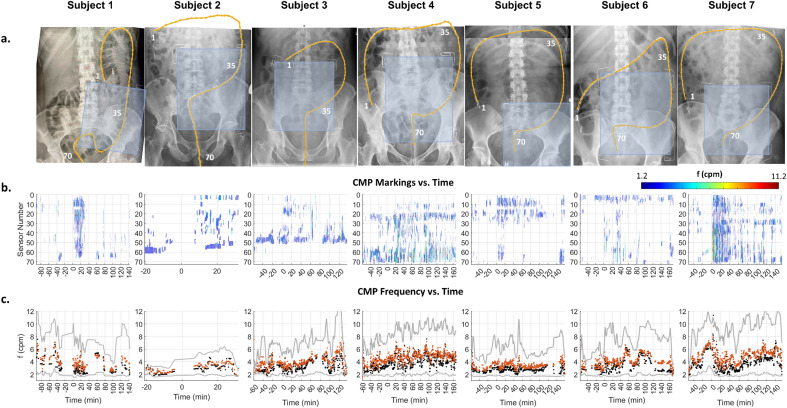
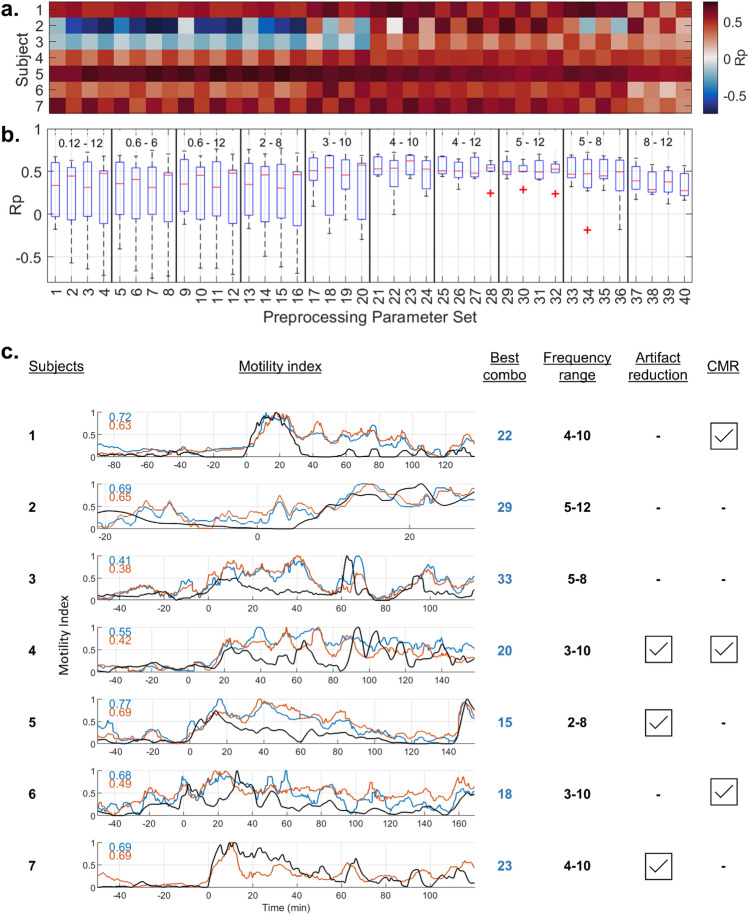
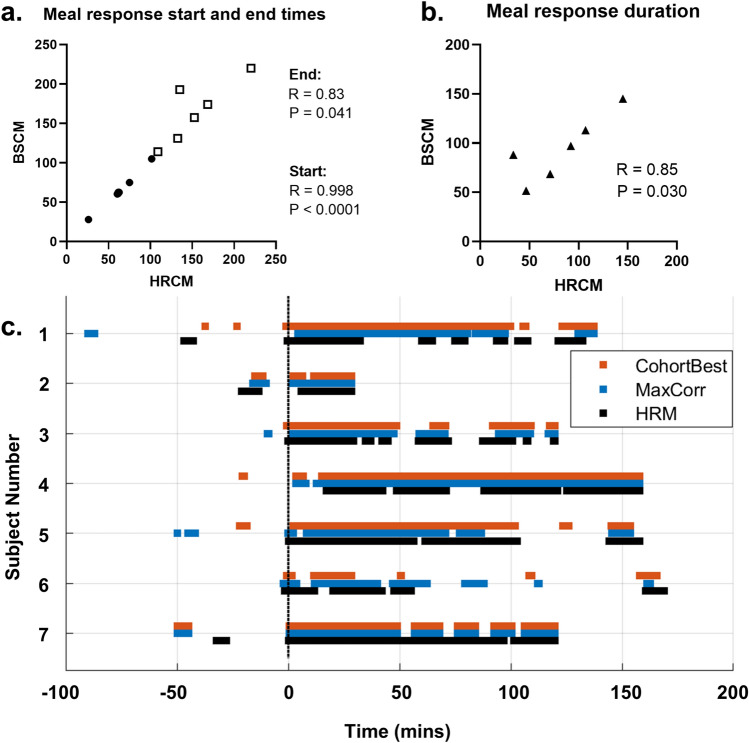
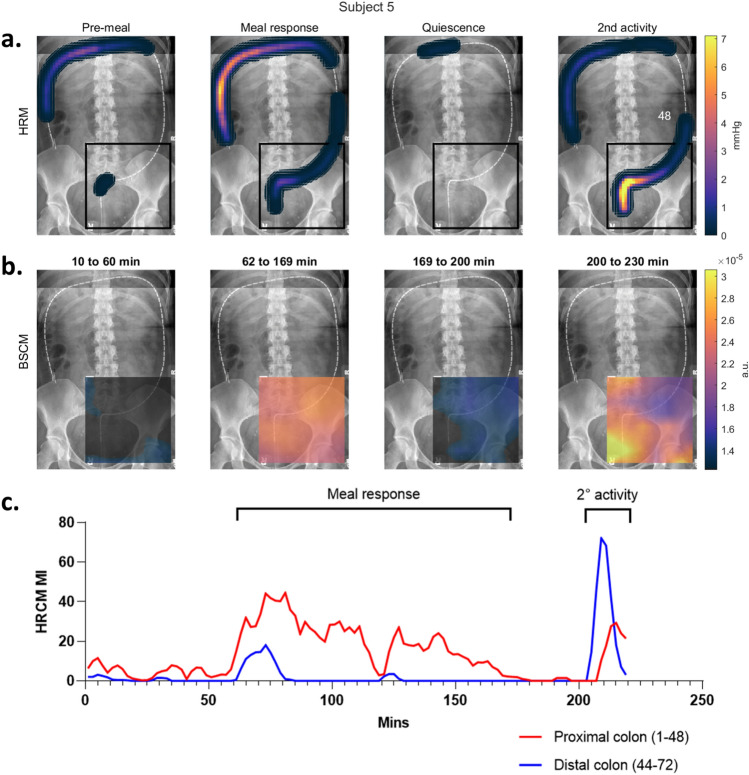
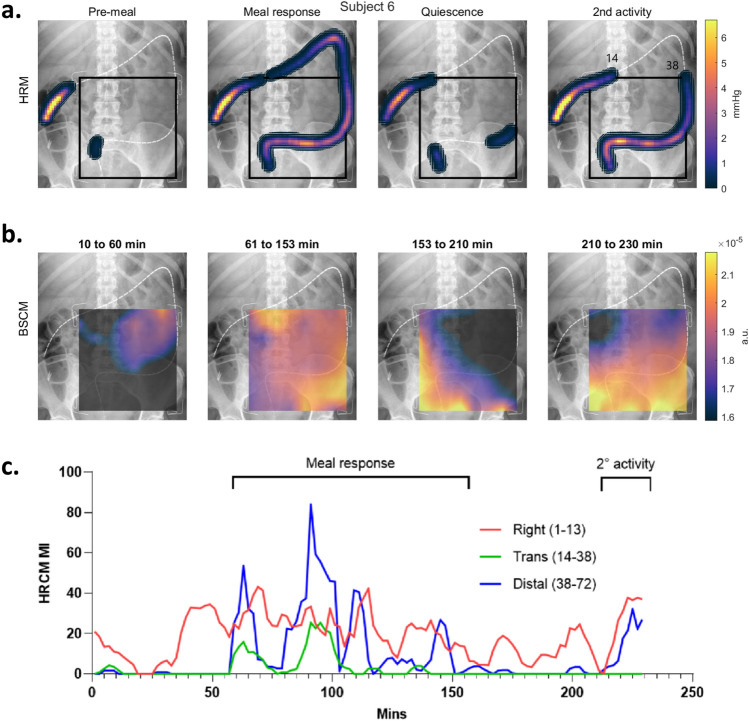
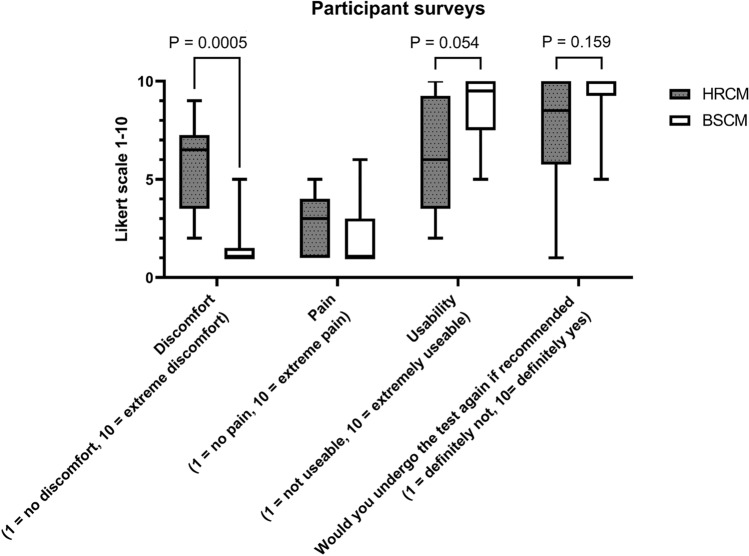
Abnormal cyclic motor pattern (CMP) activity is implicated in colonic dysfunction, but the only tool to evaluate CMP activity, high-resolution colonic manometry (HRCM), remains expensive and not widely accessible. This study aimed to validate body surface colonic mapping (BSCM) through direct correlation with HRCM. Synchronous meal-test recordings were performed in asymptomatic participants with intact colons. A signal processing method for BSCM was developed to detect CMPs. Quantitative temporal analysis was performed comparing the meal responses and motility indices (MI). Spatial heat maps were also compared. Post-study questionnaires evaluated participants' preference and comfort/distress experienced from either test. 11 participants were recruited and 7 had successful synchronous recordings (5 females/2 males; median age: 50 years [range 38-63]). The best-correlating MI temporal analyses achieved a high degree of agreement (median Pearson correlation coefficient (Rp) value: 0.69; range 0.47-0.77). HRCM and BSCM meal response start and end times (Rp = 0.998 and 0.83; both p < 0.05) and durations (Rp = 0.85; p = 0.03) were similar. Heat maps demonstrated good spatial agreement. BSCM is the first non-invasive method to be validated by demonstrating a direct spatio-temporal correlation to manometry in evaluating colonic motility.


Conflict of interest statement

This project was financially supported by CSSANZ with a Foundation Grant and HRC. Sean Ho Beom Seo is a recipient of the New Zealand Research Scholarship from RACS. Jonathan Erickson was supported by a Washington and Lee University Lenfest Sabbatical Fellowship. Greg O’Grady, Stefan Calder, Armen Gharibans and Jonathan Erickson are shareholders of Alimetry Ltd and hold intellectual property in the field of noninvasive gastric mapping. No commercial financial support was received for this study. The other authors have no conflict of interest to declare.

Figures

Figure 1
Figure 1
High resolution fiber-optic colonic manometer and body surface mapping (BSM) array placement. LEFT: 72 sensor manometer with 1 cm sensor spacing was clipped with multiple endoclips to the mucosa of the colon. The paperclips demarcate the area covered by the 8 × 8 electrode grid of the array. RIGHT: BSCM array is affixed to abdominal skin. Ground and reference electrodes are located on the small extension flap of the array on the right (anatomical) side of the participant.
Figure 2
Figure 2
HRCM placement, manual markings, and dynamic frequency of CMPs: (a) X-ray images of each participant showing the extent the manometer (orange line) reached. Sensor numbers 1, 35, and 70 are annotated. (b) Manually marked CMP events graphically stacked with the most proximal sensor located at the top of the vertical axis (sensor number 1). The time axis is displayed with the meal start aligned at t = 0. CMP events are color coded according to intrinsic frequency (linear scale of 1.2 cpm [deep blue] to 11.2 cpm [red]) to highlight the dynamic frequency changes. Densely marked (pacemaker) regions of CMP activity can also be appreciated and anatomically localized which can then be used to develop a spatial ‘heatmap’ along the length of the manometer. Multi-focal activity can be observed as clusters of CMP marks that are vertically discrete with minimal activity occurring in the sensors separating them. (c) Using the data from panel b, frequency time course maps were developed. Orange dots indicate the mean frequency, black indicates the median frequency, and the gray lines indicate the 10–90 percentile range.
Figure 3
Figure 3
Motility index temporal correlation grid and time course of the best matching signal processing pipelines: (a) BSCM-HRCM MI correlation values across 40 different combinations (4 columns per frequency bandwidth tested) of signal processing performed for each of 7 subjects. The sets of 4 preprocessing filter combinations within a specified frequency band are specified as (artifact reduction, CMR) = {(off, off); (off, on); (on, off); (on, on)}. Pseudocolor indicates value of Pearson correlation coefficient (Rp). (b) Box plot statistical summary computed across all subjects for each of 40 individual preprocessing parameter sets. Combination 23 (frequency 4–10 cpm, artifact reduction on, CMR off) yielded the cohort-wide best overall performance. (c) Motility index vs. time: black trace = HRCM MI, blue trace = maximum correlating BSCM MI; and red–orange trace = cohort-wide best overall preprocessing parameter set (number 23). Meal times are aligned at t = 0 min. Every subject had a different preprocessing parameter set achieving maximal correlation, but there was a strong trend toward higher frequency range filtering achieving better overall performance.
Figure 4
Figure 4
Summary of CMP meal response match between HRCM and BSCM. (a) High level of correlation observed for both start and end times of the meal responses; (b) Meal response duration (meal response end time − start time) was also well correlated. Values are in units of minutes. (c) Suprathreshold Activity Lines show a high level of agreement in active vs quiescent periods for all subjects. Black trace = HRCM; Blue = highest correlation BSCM; Red = cohort-wide optimum parameter combination BSCM trace. Meal times are aligned at t = 0 min.
Figure 5
Figure 5
Spatial analysis of subject 5 with regional analysis of HRCM MI. Two key observations from HRCM spatial analysis (a) are the dominant right and transverse colon activity in the primary meal response (62–169 min) followed by an RSJ dominant secondary period of CMP activity (200–230 min). The shift in regional dominance is mirrored by BSCM (b). Distant dominant source (right/transverse colon) in the meal response period projects onto the array as a diffuse activation with weak hotspots over the RSJ and sigmoid colon. The RSJ activity in the last 20 min is strongly represented by a corresponding hotspot on the lower (anatomical) right corner of the array. The corresponding HRCM MI graph (c) shows the clear shift in regional dominance of CMP activity. The sensor numbers 44–48 overlap for proximal and distal colon, but this was to allow for a few CMPs crossing over into the adjacent regions; no CMPs were double counted.
Figure 6
Figure 6
Spatial analysis of subject 6 with regional breakdown of HRCM MI. Subject 6 had a multifocal meal response involving most of the colon (a). The transverse colon is closer to the BSCM array, so its activity projects a more focal impression on the top (anatomical) right side of the array during the meal response period (as seen on row b). During the second active period (i.e. the last 20 min), the distal transverse colon (sensors 14–38) exhibit no CMP activity (as seen on rows a and c) and the intensity at the top of the BSCM array is concordantly minimal.
Figure 7
Figure 7
Box plot summary of the participants’ numerically reported outcomes: Non-invasive BSCM was found to be significantly more comfortable than HRCM. BSCM was also favorable in terms of usability and acquiescence to repeated testing. Neither investigation inflicted significant levels of pain on the participants.

Similar articles

Cited by

References

    1. Meyer I, Richter HE. Impact of fecal incontinence and its treatment on quality of life in women. Womens. Health. 2015;11:225–238. - PMC - PubMed
    1. Oka P, et al. Global prevalence of irritable bowel syndrome according to Rome III or IV criteria: A systematic review and meta-analysis. Lancet Gastroenterol. Hepatol. 2020;5:908–917. doi: 10.1016/S2468-1253(20)30217-X. - DOI - PubMed
    1. Palsson OS, Whitehead W, Törnblom H, Sperber AD, Simren M. Prevalence of Rome IV functional bowel disorders among adults in the United States, Canada, and the United Kingdom. Gastroenterology. 2020;158:1262–1273.e3. doi: 10.1053/j.gastro.2019.12.021. - DOI - PubMed
    1. Sperber AD, et al. Worldwide prevalence and burden of functional gastrointestinal disorders, results of Rome Foundation Global Study. Gastroenterology. 2021;160:99–114.e3. doi: 10.1053/j.gastro.2020.04.014. - DOI - PubMed
    1. Nellesen D, Yee K, Chawla A, Lewis BE, Carson RT. A systematic review of the economic and humanistic burden of illness in irritable bowel syndrome and chronic constipation. J. Manag. Care Pharm. 2013;19:755–764. - PMC - PubMed