

Linking structural and functional changes during aging using multilayer brain network analysis
- PMID: 38418523
- PMCID: PMC10902297
- DOI: 10.1038/s42003-024-05927-x
Linking structural and functional changes during aging using multilayer brain network analysis
Abstract
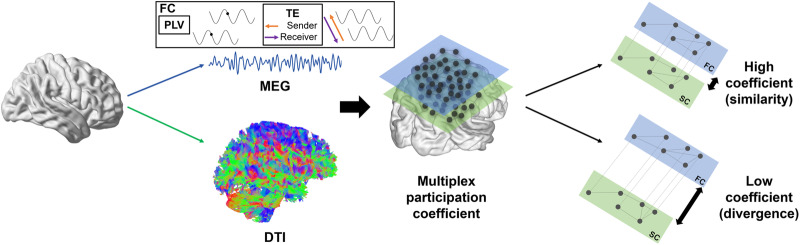
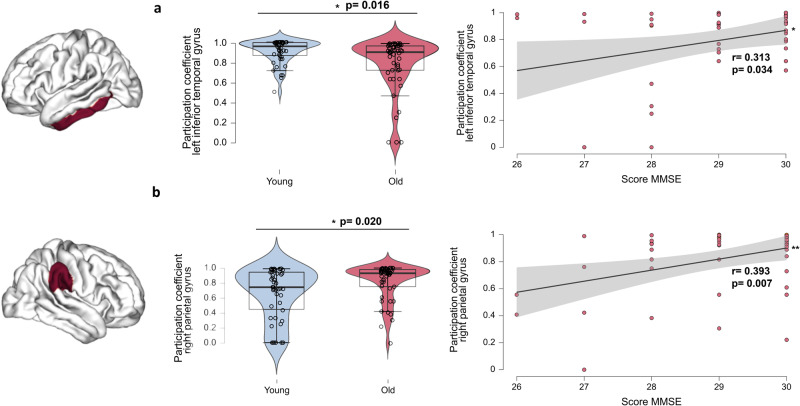
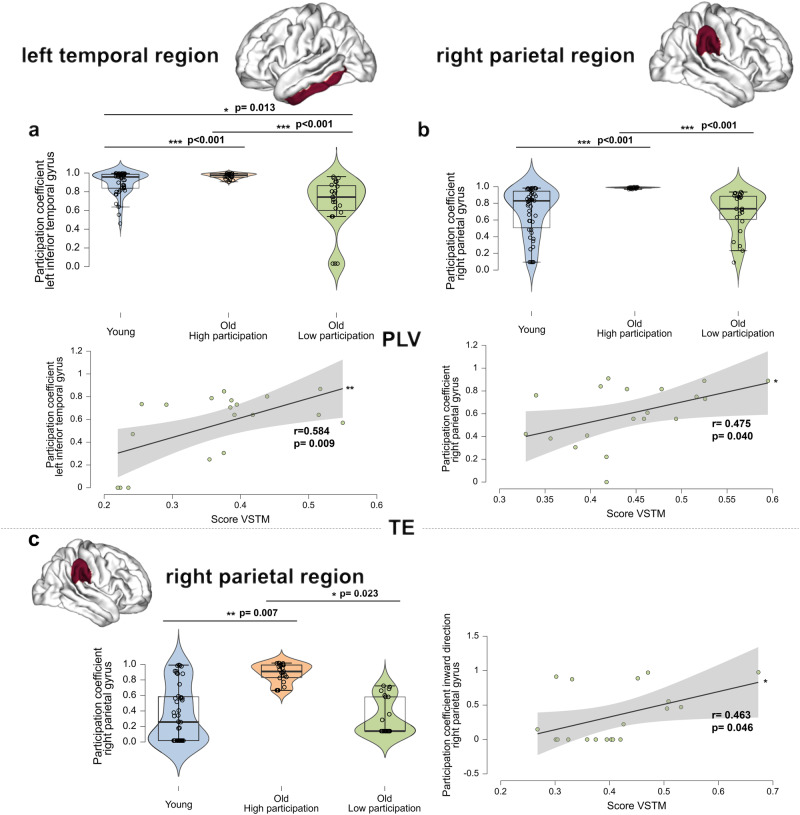
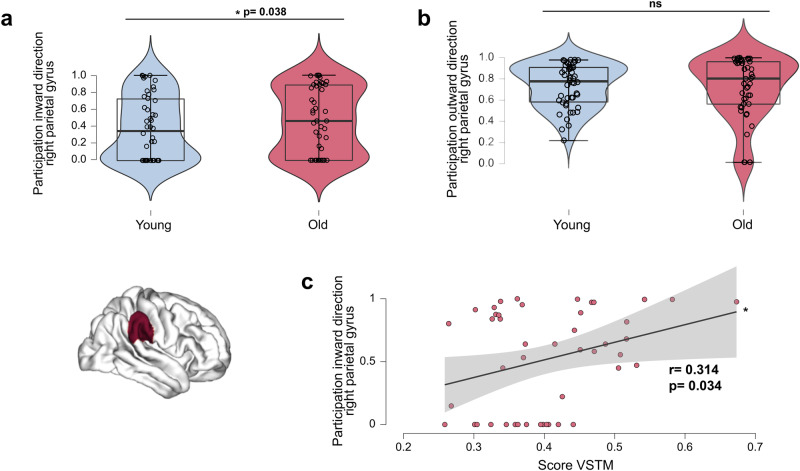
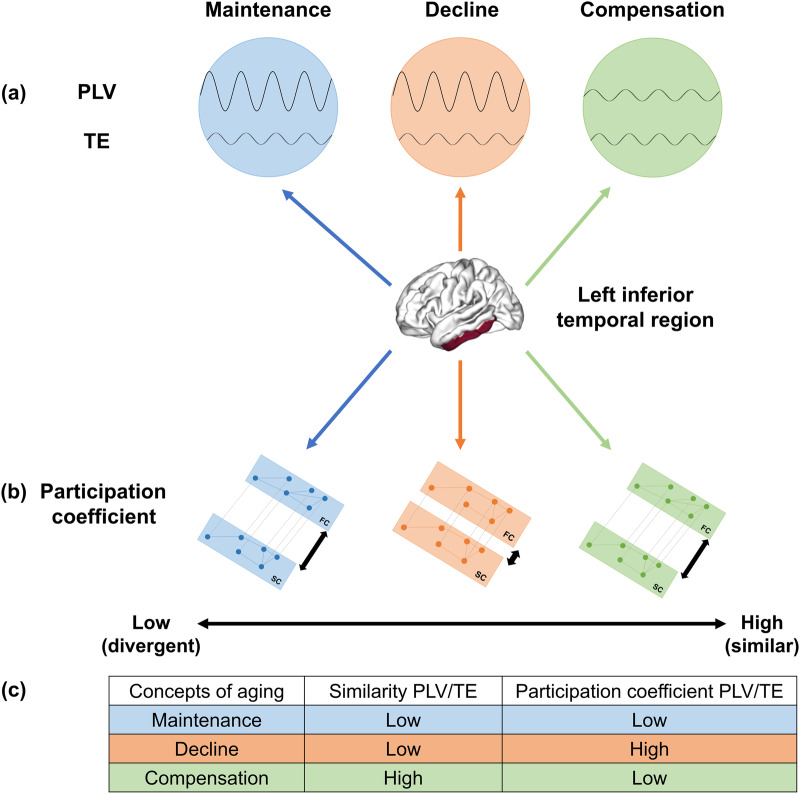
Brain structure and function are intimately linked, however this association remains poorly understood and the complexity of this relationship has remained understudied. Healthy aging is characterised by heterogenous levels of structural integrity changes that influence functional network dynamics. Here, we use the multilayer brain network analysis on structural (diffusion weighted imaging) and functional (magnetoencephalography) data from the Cam-CAN database. We found that the level of similarity of connectivity patterns between brain structure and function in the parietal and temporal regions (alpha frequency band) is associated with cognitive performance in healthy older individuals. These results highlight the impact of structural connectivity changes on the reorganisation of functional connectivity associated with the preservation of cognitive function, and provide a mechanistic understanding of the concepts of brain maintenance and compensation with aging. Investigation of the link between structure and function could thus represent a new marker of individual variability, and of pathological changes.
© 2024. The Author(s).
Conflict of interest statement
The authors declare no competing interests.
Figures
Similar articles
-
Linking structural and functional changes during healthy aging and semantic dementia using multilayer brain network analysis.Cortex. 2025 Feb;183:405-419. doi: 10.1016/j.cortex.2024.11.013. Epub 2024 Dec 16. Cortex. 2025. PMID: 39732562
-
Connectivity dynamics and cognitive variability during aging.Neurobiol Aging. 2022 Oct;118:99-105. doi: 10.1016/j.neurobiolaging.2022.07.001. Epub 2022 Jul 8. Neurobiol Aging. 2022. PMID: 35914474
-
M/EEG Dynamics Underlying Reserve, Resilience, and Maintenance in Aging: A Review.Front Psychol. 2022 May 25;13:861973. doi: 10.3389/fpsyg.2022.861973. eCollection 2022. Front Psychol. 2022. PMID: 35693495 Free PMC article. Review.
-
Healthy aging by staying selectively connected: a mini-review.Gerontology. 2014;60(1):3-9. doi: 10.1159/000354376. Epub 2013 Sep 28. Gerontology. 2014. PMID: 24080587 Review.
-
Cognitive and clinical dysfunction, altered MEG resting-state networks and thalamic atrophy in multiple sclerosis.PLoS One. 2013 Jul 31;8(7):e69318. doi: 10.1371/journal.pone.0069318. Print 2013. PLoS One. 2013. PMID: 23935983 Free PMC article.
Cited by
-
Normative characterization of age-related periodic and aperiodic activity in resting-state real-world clinical EEG recordings.Front Aging Neurosci. 2025 Apr 11;17:1540040. doi: 10.3389/fnagi.2025.1540040. eCollection 2025. Front Aging Neurosci. 2025. PMID: 40290869 Free PMC article.
-
The balance between integration and segregation drives network dynamics maximizing multistability and metastability.Sci Rep. 2025 May 29;15(1):18811. doi: 10.1038/s41598-025-01612-z. Sci Rep. 2025. PMID: 40442139 Free PMC article.
-
Reduced parietal to frontal functional connectivity for dynamic balance in late middle-to-older adults.Exp Brain Res. 2025 Apr 10;243(5):111. doi: 10.1007/s00221-025-07070-3. Exp Brain Res. 2025. PMID: 40208322
References
-
- Buzsáki, G. Rhythms of the Brain. (Oxford University Press, 2006). 10.1093/acprof:oso/9780195301069.001.0001.
Publication types
MeSH terms
Grants and funding
LinkOut - more resources
Full Text Sources
Medical
