Urban park qualities driving visitors mental well-being and wildlife conservation in a Neotropical megacity
- PMID: 38418539
- PMCID: PMC10902329
- DOI: 10.1038/s41598-024-55357-2
Urban park qualities driving visitors mental well-being and wildlife conservation in a Neotropical megacity
Abstract
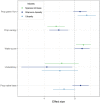
Green infrastructure has been widely recognized for the benefits to human health and biodiversity conservation. However, knowledge of the qualities and requirements of such spaces and structures for the effective delivery of the range of ecosystem services expected is still limited, as well as the identification of trade-offs between services. In this study, we apply the One Health approach in the context of green spaces to investigate how urban park characteristics affect human mental health and wildlife support outcomes and identify synergies and trade-offs between these dimensions. Here we show that perceived restorativeness of park users varies significantly across sites and is mainly affected by safety and naturalness perceptions. In turn, these perceptions are driven by objective indicators of quality, such as maintenance of facilities and vegetation structure, and subjective estimations of biodiversity levels. The presence of water bodies benefited both mental health and wildlife. However, high tree canopy coverage provided greater restoration potential whereas a certain level of habitat heterogeneity was important to support a wider range of bird species requirements. To reconcile human and wildlife needs in green spaces, cities should strategically implement a heterogeneous green infrastructure network that considers trade-offs and maximizes synergies between these dimensions.
© 2024. The Author(s).
Conflict of interest statement
The authors declare no competing interests.
Figures


Similar articles
-
Ecosystem services: Urban parks under a magnifying glass.Environ Res. 2018 Jan;160:469-478. doi: 10.1016/j.envres.2017.10.023. Epub 2017 Nov 5. Environ Res. 2018. PMID: 29078140
-
Perceived biodiversity, sound, naturalness and safety enhance the restorative quality and wellbeing benefits of green and blue space in a neotropical city.Sci Total Environ. 2021 Feb 10;755(Pt 2):143095. doi: 10.1016/j.scitotenv.2020.143095. Epub 2020 Oct 16. Sci Total Environ. 2021. PMID: 33139002
-
Green infrastructure through the lens of "One Health": A systematic review and integrative framework uncovering synergies and trade-offs between mental health and wildlife support in cities.Sci Total Environ. 2020 Dec 15;748:141589. doi: 10.1016/j.scitotenv.2020.141589. Epub 2020 Aug 10. Sci Total Environ. 2020. PMID: 33113695 Review.
-
Residential yard management and landscape cover affect urban bird community diversity across the continental USA.Ecol Appl. 2021 Dec;31(8):e02455. doi: 10.1002/eap.2455. Epub 2021 Oct 14. Ecol Appl. 2021. PMID: 34523195
-
A comprehensive review of the environmental benefits of urban green spaces.Environ Res. 2024 Jul 1;252(Pt 2):118837. doi: 10.1016/j.envres.2024.118837. Epub 2024 Apr 1. Environ Res. 2024. PMID: 38570129 Review.
Cited by
-
Evaluating the impact of evolving green and grey urban infrastructure on local particulate pollution around city square parks.Sci Rep. 2024 Aug 9;14(1):18528. doi: 10.1038/s41598-024-68252-7. Sci Rep. 2024. PMID: 39122758 Free PMC article.
-
Evidence-base for urban green-blue infrastructure to support insect diversity.Urban Ecosyst. 2025;28(1):1-14. doi: 10.1007/s11252-024-01649-4. Epub 2024 Dec 7. Urban Ecosyst. 2025. PMID: 39655238 Free PMC article. Review.
-
Human sounds and associated tonality disrupting perceived soundscapes in protected natural areas.Sci Rep. 2025 Aug 6;15(1):28759. doi: 10.1038/s41598-025-08524-y. Sci Rep. 2025. PMID: 40770002 Free PMC article.
-
Associations of green space visitation patterns with sociodemographics, health, and perceptions: A cluster analysis using smartphone Wi-Fi and GPS data.PLoS One. 2025 Jun 27;20(6):e0325697. doi: 10.1371/journal.pone.0325697. eCollection 2025. PLoS One. 2025. PMID: 40577274 Free PMC article.
References
-
- World Health Organization (WHO). World Mental Health Report: Transforming Mental Health for All. (2022).
-
- McDonald RI, Beatley T, Elmqvist T. The green soul of the concrete jungle: The urban century, the urban psychological penalty, and the role of nature. Sustain. Earth. 2018;1:1–13. doi: 10.1186/s42055-018-0002-5. - DOI
-
- Cox DTC, Shanahan DF, Hudson HL, Fuller RA, Gaston KJ. The impact of urbanisation on nature dose and the implications for human health. Landsc. Urban Plan. 2018;179:72–80. doi: 10.1016/j.landurbplan.2018.07.013. - DOI
-
- Robinson J, Breed M. Green prescriptions and their co-benefits: Integrative strategies for public and environmental health. Challenges. 2019;10:9. doi: 10.3390/challe10010009. - DOI
MeSH terms
LinkOut - more resources
Full Text Sources

