. 2024 Apr;43(7):1135-1163.
doi: 10.1038/s44318-024-00061-0. Epub 2024 Feb 28.

Control of complement-induced inflammatory responses to SARS-CoV-2 infection by anti-SARS-CoV-2 antibodies

Affiliations

Control of complement-induced inflammatory responses to SARS-CoV-2 infection by anti-SARS-CoV-2 antibodies

Marta Bermejo-Jambrina et al. EMBO J. 2024 Apr.

Abstract

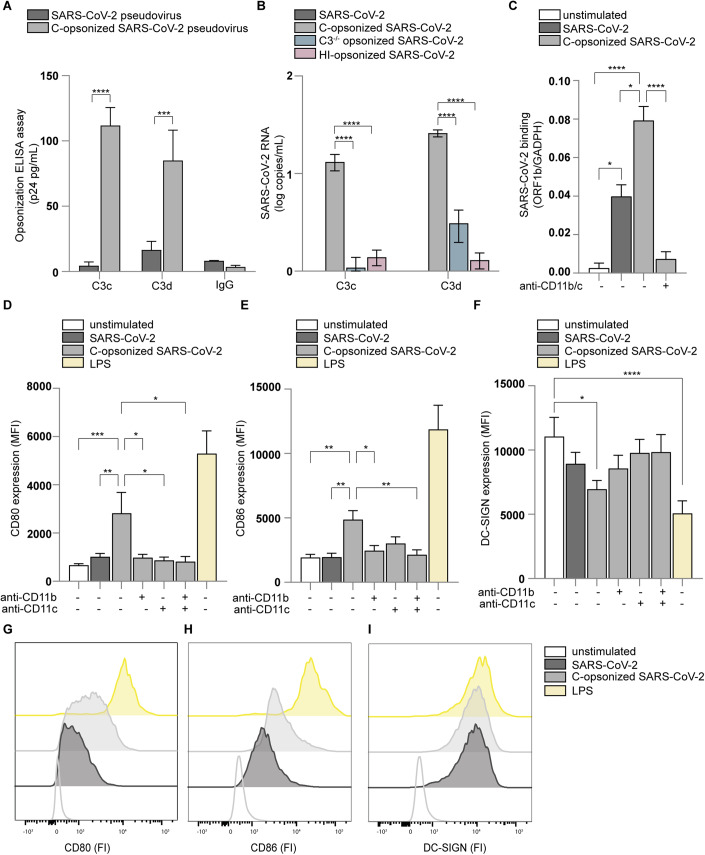
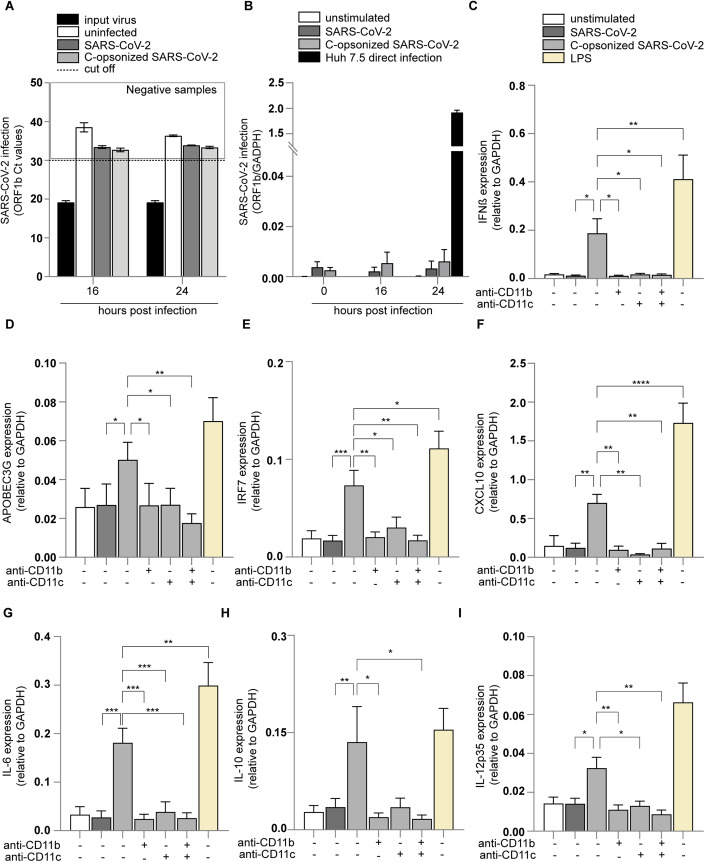
Dysregulated immune responses contribute to the excessive and uncontrolled inflammation observed in severe COVID-19. However, how immunity to SARS-CoV-2 is induced and regulated remains unclear. Here, we uncover the role of the complement system in the induction of innate and adaptive immunity to SARS-CoV-2. Complement rapidly opsonizes SARS-CoV-2 particles via the lectin pathway. Complement-opsonized SARS-CoV-2 efficiently induces type-I interferon and pro-inflammatory cytokine responses via activation of dendritic cells, which are inhibited by antibodies against the complement receptors (CR) 3 and 4. Serum from COVID-19 patients, or monoclonal antibodies against SARS-CoV-2, attenuate innate and adaptive immunity induced by complement-opsonized SARS-CoV-2. Blocking of CD32, the FcγRII antibody receptor of dendritic cells, restores complement-induced immunity. These results suggest that opsonization of SARS-CoV-2 by complement is involved in the induction of innate and adaptive immunity to SARS-CoV-2 in the acute phase of infection. Subsequent antibody responses limit inflammation and restore immune homeostasis. These findings suggest that dysregulation of the complement system and FcγRII signaling may contribute to severe COVID-19.

Keywords: COVID-19; Complement; Dendritic Cells; SARS-CoV-2; Type-I IFN Responses.


Conflict of interest statement

The authors declare no competing interests.

Figures

Figure 1
Figure 1. Complement-opsonized SARS-CoV-2 activates DCs via CD11b and CD11c.
(A, B) SARS-CoV-2 pseudovirus (A) and SARS-CoV-2 isolate (hCoV-19/Italy-WT, 1000 TCID/mL) (B) opsonization by C3c and C3d were determined by (A) ELISA (p24 pg/mL) or (B) qPCR, respectively (n = 3 donors). (C) Human monocyte-derived DCs were exposed to SARS-CoV-2 isolate (hCoV-19/Italy-WT, 1000 TCID/mL) and complement-opsonized SARS-CoV-2 (hCoV-19/Italy-WT, 1000 TCID/mL) for 4 h at 4 °C in presence or absence of antibodies against CD11b and CD11c. Virus binding was determined by quantitative real-time PCR (n = 6 donors). (DF) DCs were exposed to SARS-CoV-2 or complement-opsonized SARS-CoV-2 for 24 h in the presence or absence of antibodies against CD11b and CD11c and expression of CD80, CD86 and DC-SIGN was determined by flow cytometry (n = 12 donors). LPS stimulation was used as a positive control. (GI) Representative histograms of CD80 (G), CD86 (H), and DC-SIGN (I) expression. Data show the mean values and error bars are the SEM. Statistical analysis was performed using (A, B) ordinary one-way ANOVA with Tukey multiple-comparison test. ***P ≤ 0.001, ****P ≤ 0.0001 (n = 3 donors). (C) Ordinary one-way ANOVA with Tukey multiple-comparison test. **P ≤ 0.01, ***P ≤ 0.001, ****P ≤ 0.0001 (n = 6 donors). (DF) Two-way ANOVA with Tukey multiple-comparison test. *P ≤ 0.05, **P ≤ 0.01, ***P ≤ 0.001, ****P ≤ 0.0001 (n = 12 donors). Source data are available online for this figure.
Figure 2
Figure 2. Complement-opsonized SARS-CoV-2 induces type-I IFN and cytokine responses via CRs.
(A, B) ACE2-negative human monocyte-derived DCs were exposed to SARS-CoV-2 isolate (hCoV-19/Italy-WT, 1000 TCID/mL) and complement-opsonized SARS-CoV-2 (hCoV-19/Italy-WT, 1000 TCID/mL) for 16 h and 24 h. Viral production detectable in the supernatant (A) and cell infection (n = 2 donors) (B) were determined by qPCR. (CI) DC were exposed to SARS-CoV-2 isolate (hCoV-19/Italy-WT, 1000 TCID/mL), complement-opsonized SARS-CoV-2 (hCoV-19/Italy-WT, 1000 TCID/mL) and LPS (100 ng/mL) in presence or absence of antibodies against CD11b and CD11c for 2 h and 6 h. mRNA levels of IFN-β (C), APOBEC3G (D), IRF7 (E), CXCL10 (F), IL-6 (G), IL-10 (H), and IL-12p35 (I) were determined with qPCR after 2 h (C) and after 6 h (DI) (n = 12 donors). Data show the mean values and error bars are the SEM. Statistical analysis was performed using (CI) two-way ANOVA with Dunnett’s multiple-comparison test. *P ≤ 0.05, **P ≤ 0.01, ***P ≤ 0.001, ****P ≤ 0.0001 (n = 12 donors). Source data are available online for this figure.
Figure 3
Figure 3. Complement-opsonized SARS-CoV-2 induces caspase-1 meditated IL-1β secretion.
(A) Human monocyte-derived DC were exposed to SARS-CoV-2 isolate (hCoV-19/Italy-WT, 1000 TCID/mL), complement-opsonized SARS-CoV-2 (hCoV-19/Italy-WT, 1000 TCID/mL) and LPS (100 ng/mL) in presence or absence of antibodies against CD11b and CD11c and IL-1β secretion (pg/mL) in the supernatant was measured after 24 h by ELISA (n = 4 donors). (B) DCs were left unstimulated or treated with anti-CD11b/c prior to exposure to non- and complement-opsonized SARS-CoV-2, LPS and ATP. DCs with active caspase-1 were detected after 14 h by flow cytometry using the FAM-FLICA assay (n = 3 donors). (CE) NHS was incubated with mannan, prior SARS-CoV-2 opsonization. DCs were exposed to non-, complement-opsonized SARS-CoV-2 and NHS-mannan opsonized SARS-CoV-2 in the presence or absence of anti-CD11b/c, and mRNA levels of IFNβ (n = 4 donors) (C), IRF7 (n = 7 donors) (D), and IL-6 (n = 7 donors) (E) were determined by qPCR. Data show the mean values and error bars are the SEM. Statistical analysis was performed using (A) two-way ANOVA with Tukey multiple-comparison test. ****P ≤ 0.0001 (n = 4 donors). (B) ordinary one-way with Tukey’s multiple-comparison test. *P ≤ 0.05, **P ≤ 0.01 (n = 3 donors). (CE) Two-way ANOVA with Tukey multiple-comparison test. **P ≤ 0.01, ***P ≤ 0.001, ****P ≤ 0.0001 (n = 4 donors) (C), (n = 7 donors) (D), and (n = 7 donors) (E). Source data are available online for this figure.
Figure 4
Figure 4. Anti-SARS-CoV-2 antibodies present in sera suppress complement activation mediated immune activation via CD32/FcγRII.
(AG) Human monocyte-derived DCs were exposed to SARS-CoV-2 isolate (hCoV-19/Italy-WT, 1000 TCID/mL), complement-opsonized SARS-CoV-2 (hCoV-19/Italy-WT, 1000 TCID/mL) and antibody/complement-opsonized SARS-CoV-2 (hCoV-19/Italy-WT, 1000 TCID/mL), made by a pooled sera from 20 mild COVID-19 patients supplemented with pre-pandemic NHS, as well as LPS (100 ng/mL) in presence or absence of anti-CD32 for 2 h (A) and 6 h (BG). mRNA levels of IFNβ (A), APOBEC3G (B), IRF7 (C), CXCL10 (D), IL-6 (E), IL-10 (F), and IL-12p35 (G) were determined with qPCR after 6 h (n = 12 donors). Data show the mean values and error bars are the SEM. Statistical analysis was performed using (AG) two-way ANOVA with Dunnett’s multiple-comparison test. ns not significant. *P ≤ 0.05, **P ≤ 0.01 (n = 12 donors). Source data are available online for this figure.
Figure 5
Figure 5. Non- and neutralizing anti-SARS-CoV-2 monoclonal antibodies suppress complement activation mediated immune activation via CD32/FcγRII.
(AG) Pre-incubation of complement-opsonized SARS-CoV-2 with patient isolated mAb COVA1-18 (0.05 µg/mL) and COVA1-27 (0.05 µg/mL) for 30 min at 37 °C led to the antibody/complement-opsonized SARS-CoV-2 condition. Human monocyte-derived DCs were exposed to SARS-CoV-2 isolate (hCoV-19/Italy-WT, 1000 TCID/mL), to complement-opsonized SARS-CoV-2 (hCoV-19/Italy-WT, 1000 TCID/mL) and antibody/complement-opsonized SARS-CoV-2 (hCoV-19/Italy-WT, 1000 TCID/mL) in the presence or absence of anti-CD32 for 2 h and 6 h. mRNA levels of IFNβ (A), APOBEC3G (B), IRF7 (C), CXCL10 (D), IL-6 (E), IL-10 (F), and IL-12p35 (G) were determined by qPCR (n = 6 donors) (A) and (n = 4 donors) (BG). Data show the mean values and error bars are the SEM. Statistical analysis was performed using (AG) two-way ANOVA with Tukey’s multiple-comparison test. *P ≤ 0.05, **P ≤ 0.01, ***P ≤ 0.001, ****P ≤ 0.0001, (A) (n = 6 donors), and (BG) (n = 4 donors). Source data are available online for this figure.
Figure 6
Figure 6. Disease severity dictates SARS-CoV-2 complement activation and antibody response.
(A) SARS-CoV-2 pseudovirus opsonization patterns with mild and severe COVID-19 patient sera was determined by ELISA (p24 pg/mL) using anti-human C3c and C3d, for iC3b recognition, and anti-human IgG, for immunoglobulins detection (n = 4 donors). (B) Human monocyte-derived DCs were exposed to SARS-CoV-2 isolate (hCoV-19/Italy-WT, 1000 TCID/mL), to complement-opsonized SARS-CoV-2 (hCoV-19/Italy-WT, 1000 TCID/mL), COVID-19 patient serum (mild or severe) and antibody/complement-opsonized SARS-CoV-2 (hCoV-19/Italy-WT, 1000 TCID/mL) in presence or absence of anti-CD32 for 2 h and 6 h. mRNA levels of IFNβ (B) were determined after 2 h and mRNA levels of IRF7 (C) and IL-6) (D) after 6 h by qPCR (n = 8 donors) (C, D). Data show the mean values and error bars are the SEM. Statistical analysis was performed using (BD) two-way ANOVA with Sidak’s multiple-comparison test. *P ≤ 0.05, **P ≤ 0.01, ***P ≤ 0.001, ****P ≤ 0.0001 (n = 8 donors). Source data are available online for this figure.
Figure EV1
Figure EV1. Spike-dependent opsonization requires C3 deposition for complement opsonization.
(A) Particles lacking SARS-CoV-2 Spike glycoprotein and SARS-CoV-2 pseudovirus opsonisation were determined by ELISA (p24 pg/mL) (n = 3 donors). (B) Deposition of C3b on DC-internalized SARS-CoV-2 after incubation with pre-pandemic NHS, C3-depleted sera and heat-inactivated sera (n = 3 donors). (C, D) Human monocyte-derived DCs were exposed to SARS-CoV-2 isolate (hCoV-19/Italy-WT, 1000 TCID/mL) and complement-opsonized SARS-CoV-2 (hCoV-19/Italy-WT, 1000 TCID/mL) in presence or absence of anti-CD11b and anti-CD11c. LPS stimulation was used as positive control for DC maturation, which was measured after 24 h by flow cytometry. Cumulative flow cytometry data of CD11b and CD11c (n = 12 donors). Data show the mean values and error bars are the SEM. Statistical analysis was performed using (A) two-way ANOVA with Tukey multiple-comparison test. *P ≤ 0.05, **P ≤ 0.01, ***P ≤ 0.001 (n = 3 donors). (B) ordinary one-way ANOVA with Dunnett’s multiple-comparison test **P ≤ 0.01 (n = 3 donors). (C, D) Two-way ANOVA with Tukey multiple-comparison test. *P ≤ 0.05, ***P ≤ 0.001 (n = 12 donors). Source data are available online for this figure.
Figure EV2
Figure EV2. C3 deposition is required for DC maturation.
(AF) Human monocyte-derived DCs were exposed to SARS-CoV-2 isolate (hCoV-19/Italy-WT, 1000 TCID/mL), complement-opsonized SARS-CoV-2 (hCoV-19/Italy-WT, 1000 TCID/mL), C3-depleted-opsonized SARS-CoV-2 (hCoV-19/Italy-WT, 1000 TCID/mL) and heat-inactivated-opsonized SARS-CoV-2 (hCoV-19/Italy-WT, 1000 TCID/mL) in absence (AC) or presence (DF) of an isotype. LPS stimulation was used as positive control for DC maturation, which was measured after 24 h by flow cytometry. Cumulative flow cytometry data of CD80 (AD) and CD86 (BE) (n = 5 donors). (C, D) Representative histograms of CD86 expression. (G) DCs were exposed to SARS-CoV-2 isolate (hCoV-19/Italy-WT, 1000 TCID/mL), pre-pandemic NHS sera and complement-opsonized SARS-CoV-2 (hCoV-19/Italy-WT, 1000 TCID/mL) and the expression of CD80 and CD86 markers were measured (n = 4 donors). Data show the mean values and error bars are the SEM. Statistical analysis was performed using (A) ordinary one-way ANOVA with Dunnett’s multiple-comparison test. *P ≤ 0.05, **P ≤ 0.01 (n = 5 donors). (F) ordinary one-way ANOVA with Tukey multiple-comparison test. *P ≤ 0.05 (n = 5 donors). (G) ordinary one-way ANOVA with Tukey multiple-comparison test. *P ≤ 0.05, **P ≤ 0.01 (n = 4 donors). Source data are available online for this figure.
Figure EV3
Figure EV3. SARS-CoV-2 opsonization is concentration-dependent and requires C3.
(A) Mean fluorescence index (MFI) of serum concentration-dependent C3b deposition on DC-internalized complement-opsonized SARS-CoV-2 and heat-inactivated-opsonized SARS-CoV-2 after 24 h (n = 4 donors). (B, C) Mean fluorescence index (MFI) of serum concentration-dependent co-stimulatory markers, CD80 (B) and CD86 (C) on DC activated cells after exposure to complement-opsonized SARS-CoV-2 and heat-inactivated-opsonized SARS-CoV-2 after 24 h (n = 4 donors). LPS stimulation was used as positive control for DC maturation, which was measured after 24 h by flow cytometry. (D) Percentages of FLICA+ from different stimulated DC (n = 3 donors). (EG) Human monocyte-derived DCs were exposed to SARS-CoV-2 isolate (hCoV-19/Italy-WT, 1000 TCID/mL), complement-opsonized SARS-CoV-2 (hCoV-19/Italy-WT, 1000 TCID/mL), C3-depleted-opsonized SARS-CoV-2 (hCoV-19/Italy-WT, 1000 TCID/mL) and heat-inactivated-opsonized SARS-CoV-2 (hCoV-19/Italy-WT, 1000 TCID/mL), as well as LPS (100 ng/mL) in presence or absence of an isotype for 2 h (E) and 24 h (F, G). mRNA levels of IFNβ after 2 h were measured by qPCR (n = 7 donors) (E). CXCL10 and IL-1β secretion (pg/mL) in the supernatant were measured after 24 h by ELISA (n = 4 donors). Data show the mean values and error bars are the SEM. Statistical analysis was performed using (AC), two-way ANOVA with Tukey multiple-comparison test. *P ≤ 0.05, ****P ≤ 0.0001 (n = 4 donors) (AC). (EG) Two-way ANOVA with Tukey multiple-comparison test. **P ≤ 0.01, ***P ≤ 0.001, ****P ≤ 0.0001 (n = 7 donors) (E) and (n = 4 donors) (F, G). Source data are available online for this figure.
Figure EV4
Figure EV4. Complement-mediated DC activation and antiviral response is dependent on lectin pathway.
(A, B) NHS and HIS were incubated with mannan (100 μg/mL), prior SARS-CoV-2 opsonization. DCs were exposed to non-, complement-opsonized SARS-CoV-2 and heat-inactivated-opsonized SARS-CoV-2 in presence or absence of mannan, and mRNA levels of IFNβ after 2 h (n = 3 donors) (A) and IL-6 after 6 h (n = 3 donors) (B) were determined by qPCR. (C) Human monocyte-derived DCs were exposed to SARS-CoV-2 isolate (hCoV-19/Italy-WT, 1000 TCID/mL), to complement-opsonized SARS-CoV-2 (hCoV-19/Italy-WT, 1000 TCID/mL), to antibody-opsonized SARS-CoV-2 (hCoV-19/Italy-WT, 1000 TCID/mL) and to antibody/complement-opsonized SARS-CoV-2 (hCoV-19/Italy-WT, 1000 TCID/mL) in presence or absence of anti-CD32 for 24 h. LPS stimulation was used as positive control for DC maturation, which was measured after 24 h by flow cytometry. Cumulative flow cytometry data of CD86 (n = 12 donors). (D) Human monocyte-derived DCs were exposed to SARS-CoV-2 isolate (hCoV-19/Italy-WT, 1000 TCID/mL), to complement-opsonized SARS-CoV-2 (hCoV-19/Italy-WT, 1000 TCID/mL) and to antibody/complement- opsonized SARS-CoV-2 (hCoV-19/Italy-WT, 1000 TCID/mL) in presence or absence of anti-CD16 for 2 h, and mRNA levels of IFNβ (n = 6 donors) were determined by qPCR. (E) DCs were stained with antibodies against the surface markers CD16, CD32 and CD64 and analyzed by flow cytometry. Representative histograms for an experiment repeated more than three times with similar results (n = 3 donors). Data show the mean values and error bars are the SEM. Statistical analysis was performed using (A, B) two-way ANOVA with Tukey multiple-comparison test. *P ≤ 0.05, ***P ≤ 0.001 (n = 3 donors). (C) ordinary one-way ANOVA with Tukey multiple-comparison test. *P ≤ 0.05 (n = 6 donors). (D) Two-way ANOVA with Tukey’s multiple-comparison test. *P ≤ 0.05, **P ≤ 0.01, ***P ≤ 0.001 (n = 6 donors). Source data are available online for this figure.
Figure EV5
Figure EV5. Increased complement activation is a distinctive feature of severe COVID-19 patients.
(A) NHS concentration-dependent SARS-CoV-2 pseudovirus opsonization by C3c and C3d were determined by (A) ELISA (p24 pg/mL) (n = 2 donors) (B, C) C3a and C5a level were determined in healthy donors, mild and severe COVID-19 patients (n = 7 donors per group). Plasma samples were harvested and C3a (ng/mL) and C5a (ng/mL) levels were analyzed using a BD Biosciences OptEIA Human C3a and C5a ELISA kit. (DG) Human monocyte-derived DCs were exposed to SARS-CoV-2 isolate (hCoV-19/Italy-WT, 1000 TCID/mL), to complement-opsonized SARS-CoV-2 (hCoV-19/Italy-WT, 1000 TCID/mL), COVID-19 patient serum (mild or severe) and antibody/complement-opsonized SARS-CoV-2 (hCoV-19/Italy-WT, 1000 TCID/mL) in presence or absence of anti-CD32 for 6 h. mRNA levels of APOBEC3G (D) CXCL10 (E), IL-10 (F) and IL-12p35 (G) after 6 h were determined by qPCR (n = 8 donors). Data show the mean values and error bars are the SEM. Statistical analysis was performed using (B, C) ordinary one-way ANOVA with Tukey multiple-comparison test. ****P ≤ 0.0001 (n = 7 donors). (D, E, G) Two-way ANOVA with Tukey’s multiple-comparison test. *P ≤ 0.05 (n = 8 donors). Source data are available online for this figure.

Similar articles

Cited by

References

    1. Afzali B, Noris M, Lambrecht BN, Kemper C. The state of complement in COVID-19. Nat Rev Immunol. 2022;22:77–84. doi: 10.1038/s41577-021-00665-1. - DOI - PMC - PubMed
    1. Ali YM, Ferrari M, Lynch NJ, Yaseen S, Dudler T, Gragerov S, Demopulos G, Heeney JL, Schwaeble WJ. Lectin pathway mediates complement activation by SARS-CoV-2 proteins. Front Immunol. 2021;12:714511. doi: 10.3389/fimmu.2021.714511. - DOI - PMC - PubMed
    1. Anania JC, Chenoweth AM, Wines BD, Hogarth PM. The human FcγRII (CD32) family of leukocyte FcR in health and disease. Front Immunol. 2019;10:464. doi: 10.3389/fimmu.2019.00464. - DOI - PMC - PubMed
    1. Arish M, Qian W, Narasimhan H, Sun J. COVID-19 immunopathology: from acute diseases to chronic sequelae. J Med Virol. 2023;95:e28122. doi: 10.1002/jmv.28122. - DOI - PMC - PubMed
    1. Bermejo-Jambrina M, Blatzer M, Jauregui-Onieva P, Yordanov TE, Hörtnagl P, Valovka T, Huber LA, Wilflingseder D, Posch W. CR4 signaling contributes to a DC-driven enhanced immune response against complement-opsonized HIV-1. Front Immunol. 2020;11:2010. doi: 10.3389/fimmu.2020.02010. - DOI - PMC - PubMed

Substances