. 2024 Apr;31(4):431-446.
doi: 10.1038/s41418-024-01270-0. Epub 2024 Feb 28.

APE1 inhibition enhances ferroptotic cell death and contributes to hepatocellular carcinoma therapy

Affiliations

APE1 inhibition enhances ferroptotic cell death and contributes to hepatocellular carcinoma therapy

Yu Du et al. Cell Death Differ. 2024 Apr.

Abstract

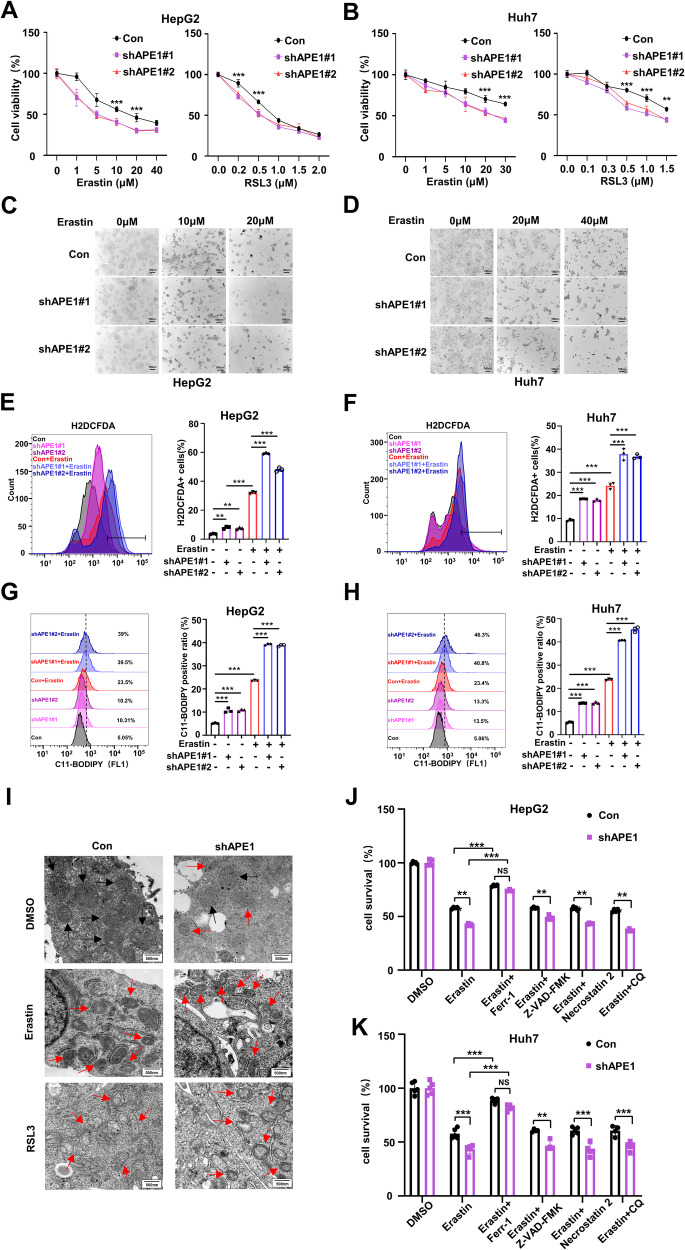
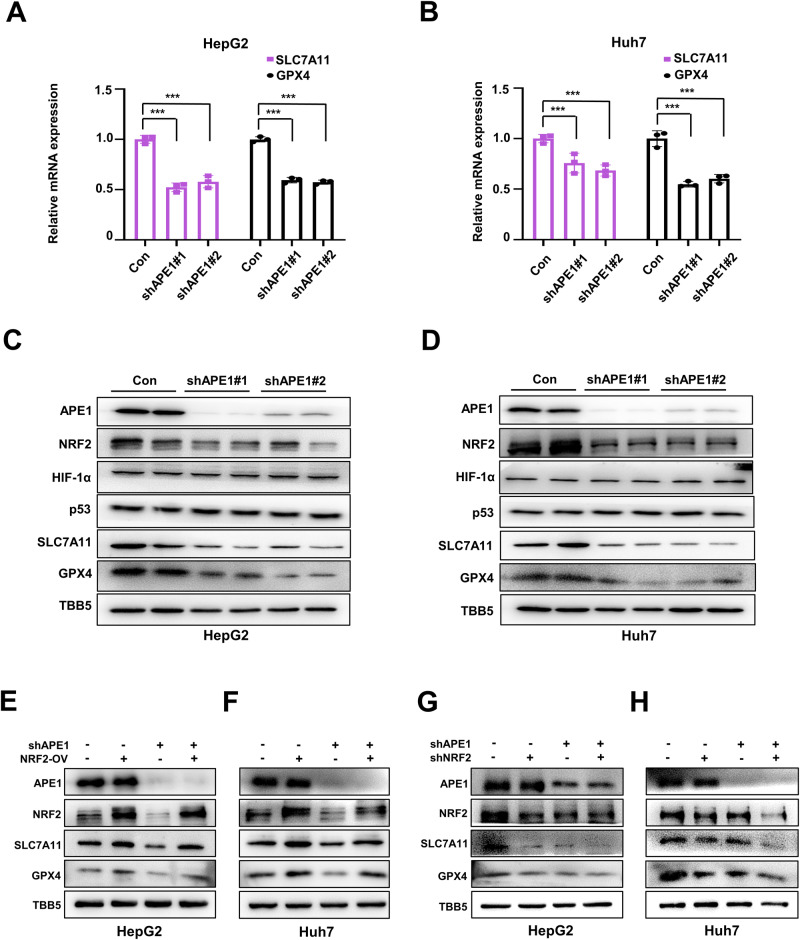
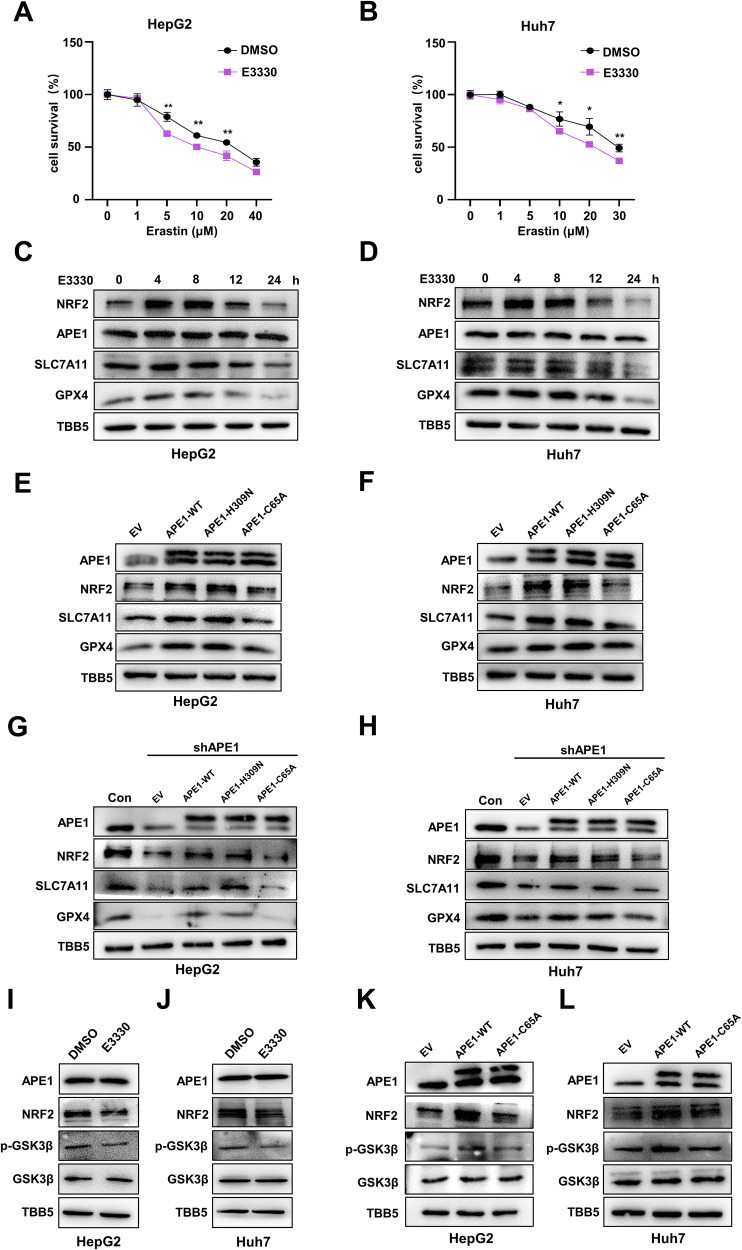
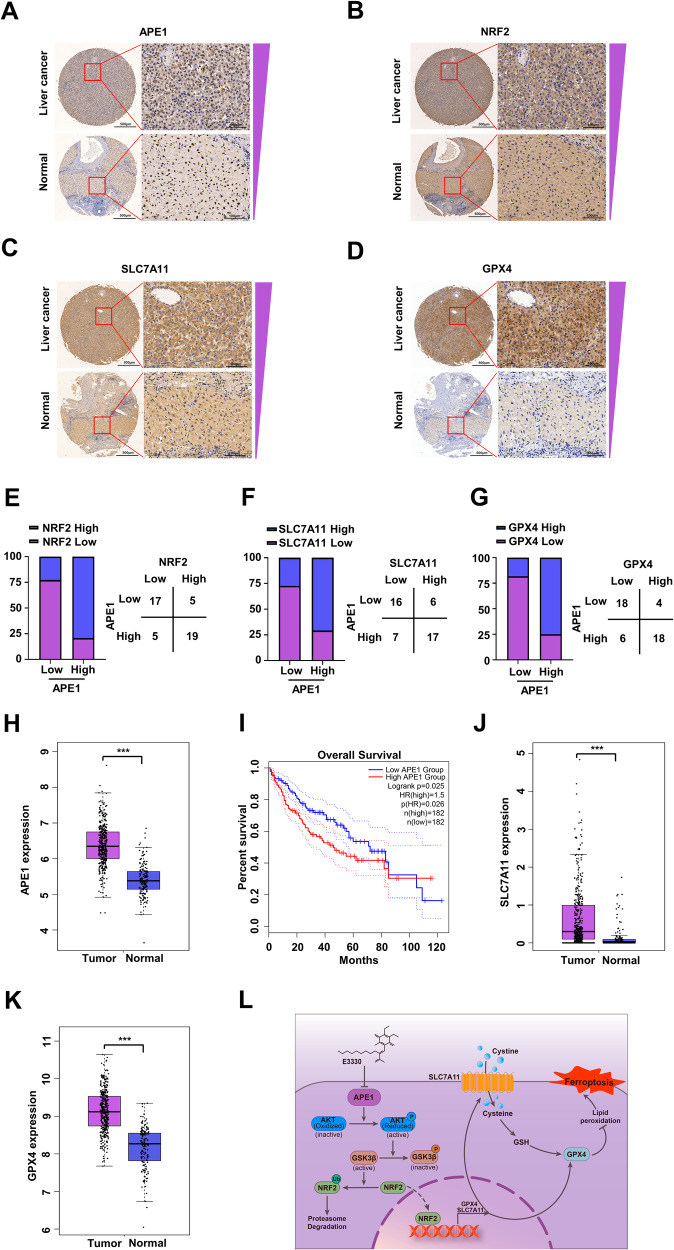
Ferroptosis, a regulated form of cell death triggered by iron-dependent lipid peroxidation, has emerged as a promising therapeutic strategy for cancer treatment, particularly in hepatocellular carcinoma (HCC). However, the mechanisms underlying the regulation of ferroptosis in HCC remain to be unclear. In this study, we have identified a novel regulatory pathway of ferroptosis involving the inhibition of Apurinic/apyrimidinic endonuclease 1 (APE1), a key enzyme with dual functions in DNA repair and redox regulation. Our findings demonstrate that inhibition of APE1 leads to the accumulation of lipid peroxidation and enhances ferroptosis in HCC. At the molecular level, the inhibition of APE1 enhances ferroptosis which relies on the redox activity of APE1 through the regulation of the NRF2/SLC7A11/GPX4 axis. We have identified that both genetic and chemical inhibition of APE1 increases AKT oxidation, resulting in an impairment of AKT phosphorylation and activation, which leads to the dephosphorylation and activation of GSK3β, facilitating the subsequent ubiquitin-proteasome-dependent degradation of NRF2. Consequently, the downregulation of NRF2 suppresses SLC7A11 and GPX4 expression, triggering ferroptosis in HCC cells and providing a potential therapeutic approach for ferroptosis-based therapy in HCC. Overall, our study uncovers a novel role and mechanism of APE1 in the regulation of ferroptosis and highlights the potential of targeting APE1 as a promising therapeutic strategy for HCC and other cancers.


Conflict of interest statement

The authors declare no competing interests.

Figures

Fig. 1
Fig. 1. Inhibition of APE1 promotes ferroptosis in HCC cells.
A, B CCK-8 assay of cell viability in control and APE1-KD HepG2 and Huh7 cells after treatment with different concentrations of erastin and RSL3 for 24 h. C, D Morphological analysis of control and APE1-KD HepG2 and Huh7 cells after treatment with different doses of erastin for 24 h. E, F ROS levels in control and APE1-KD cells were detected using H2DCFDA staining in HCC cells after treatment with or without erastin (10 μM for HepG2 and 20 μM for Huh7) for 24 h. G, H Lipid peroxidation levels in control and APE1-KD cells were detected using C11-BODIPY staining in HCC cells after treatment with or without erastin (10 μM for HepG2 and 20 μM for Huh7) for 24 h. I The morphology of intracellular mitochondria was observed by TEM after treatment of control and APE1-KD HepG2 cells with or without 10 μM erastin or 0.5 μM RSL3 for 24 h. The black arrows indicated the normal mitochondria. The red arrows indicated the abnormal mitochondria. J, K CCK-8 assay of cell viability in control and APE1-KD HCC cells after treatment with erastin (10 μM for HepG2 and 20 μM for Huh7) ± indicated inhibitors (1 μM Ferrostatin-1, 5 μM Z-VAD-FMK, 2 μM Necrostatin-2, or 2 μM CQ) for 24 h. Data are shown as the mean ± SD (n = 3). **P < 0.01, ***P < 0.001.
Fig. 2
Fig. 2. APE1 regulates ferroptosis through NRF2/SLC7A11/GPX4 axis.
A, B The mRNA levels of SLC7A11 and GPX4 in control and APE1-KD HepG2 and Huh7 cells were detected by qRT-PCR. C, D Protein levels of APE1, NRF2, HIF-1α, p53, SLC7A11, and GPX4 were analyzed by western blotting in control and APE1-KD HepG2 and Huh7 cells. E, F Protein levels of SLC7A11 and GPX4 after NRF2-OV in control and APE1-KD HepG2 and Huh7 cells were. G, H Protein levels of SLC7A11 and GPX4 after NRF2 knockdown in control and APE1-KD HepG2 and Huh7 cells. Data are shown as the mean ± SD (n = 3). ***P < 0.001.
Fig. 3
Fig. 3. APE1 regulates the stability of NRF2 through GSK3β-involved ubiquitination/proteasome pathway.
A, B Protein levels of NRF2 were analyzed by western blotting in control and APE1-KD HepG2 and Huh7 cells after treatment with CHX (100 ug/ml) at different times (left). The quantification of NRF2 degradation rate by grayscale analysis (right). C, D Protein levels of NRF2 in control and APE1-KD HepG2 and Huh7 cells were analyzed by western blotting with or without MG132 (10 uM) treatment for 6 h. E, F Protein levels of APE1, NRF2, KEAP1, p-GSK3β, and GSK3β were analyzed by western blotting in control and APE1-KD HepG2 and Huh7 cells. G, H Ubiquitinated NRF2 in control and APE1-KD HepG2 and Huh7 cells after treatment with or without AR-A014418 (20 uM) and with or without MG132 (10 μM) for 6 h were analyzed by immunoprecipitation with anti-NRF2 antibody and immunoblotting with anti-ubiquitin antibody. I, J Protein levels of NRF2 were analyzed by Western blotting after treatment of control and APE1-KD HepG2 and Huh7 cells with AR-A01448 (20 uM) for 6 h, followed by treatment with CHX (100 ug/ml) for different times (left). The quantification of NRF2 degradation rate were calculated by grayscale analysis (right). K, L Protein levels of APE1, p-AKT (Ser473), and AKT were analyzed by western blotting in control and APE1-KD HepG2 and Huh7 cells or in HepG2 and Huh7 cells after treatment with E3330 (50 μM) for 24 h. M, N The redox state of the protein of AKT was analyzed by Western blotting in control and APE1-KD HepG2 and Huh7 cells or in HepG2 and Huh7 cells after treatment with E3330 (50 μM) for 24 hours. The positions of reduced (Red) and oxidized (Ox) proteins are indicated. O, P Protein levels of APE1, NRF2, p-AKT (Ser473), AKT, p-GSK3β, and GSK3β were analyzed by western blotting of protein levels in cells from control and APE1-OV HepG2 and Huh7 cells after treatment with or without Ipatasertib (2 μM) for 24 h. Data are shown as the mean ± SD (n = 3). ***P < 0.001.
Fig. 4
Fig. 4. APE1-modulated ferroptosis is NRF2-depentent.
A, B CCK-8 assay of cell viability after overexpression of NRF2 in control and APE1-KD HCC cells after treatment with erastin (10 μM for HepG2 and 20 μM for Huh7) for 24 h. C, D Morphological analysis of cells after overexpression of NRF2 in control and APE1-KD HCC cells after treatment with erastin (10 μM of HepG2 and 20 μM of Huh7) for 24 h. E, F After overexpression of NRF2 in control and APE1-KD HCC cells, the cells were after treatment with erastin (10 μM of HepG2 and 20 μM of Huh7) for 24 h and stained with H2DCFDA to detect the ROS level of the cells. G, H After overexpression of NRF2 in control and APE1-KD HCC cells, the cells were after treatment with erastin (10 μM of HepG2 and 20 μM of Huh7) for 24 h and stained with C11-BODIPY to detect the Lipid peroxidation level of the cells. I, J Morphological analysis and trypan blue assay of cells after knockdown of NRF2 in control and APE1-KD HCC cells after treatment with erastin (10 μM of HepG2 and 20 μM of Huh7) for 24 h. Data are shown as the mean ± SD (n = 3). *P < 0.05, **P < 0.01, ***P < 0.001.
Fig. 5
Fig. 5. The DNA damage repair function of APE1 is not involved in ferroptosis.
A, B Protein levels of γ-H2AX were analyzed by Western blotting in control and APE1-KD HepG2 and Huh7 cells after treatment with or without 1 μM of Ferrostatin-1 for 24 h. C, D Protein levels of γ-H2AX were analyzed by Western blotting in HepG2 and Huh7 cells after treatment with Ferrostatin-1 (1 μM) or CRT (100 μM) or CRT in combination with Ferrostatin-1 for 24 h. E, F Immunofluorescence analysis of γ-H2AX foci in control and APE1-KD HepG2 and Huh7 cells after treatment with or without 1 μM of Ferrostatin-1 for 24 h. The quantification of average foci numbers per cell are shown in the right panel, 50 cells were calculated in each group. G, H Immunofluorescence analysis of γ-H2AX foci in HepG2 and Huh7 cells after treatment with Ferrostatin-1 (1 μM) or CRT (100 μM) or CRT in combination with Ferrostatin-1 for 24 h. The quantification of average foci numbers per cell are shown in the right panel, 50 cells were calculated in each group. I, J CCK-8 assay of cell viability in HepG2 and Huh7 cells after treatment with different concentrations of erastin ± 100 μM CRT for 24 h. K, L CCK-8 assay of cell viability in HepG2 and Huh7 cells after treatment with different concentrations of RSL3 ± 100 μM CRT for 24 h. Data are shown as the mean ± SD (n = 3). ***P < 0.001.
Fig. 6
Fig. 6. APE1 relies on its redox function to participate in ferroptosis.
A, B CCK-8 assay of cell viability in HepG2 and Huh7 cells after treatment with different concentrations of erastin ± 50 μM E3330 for 24 h. C, D Protein levels of APE1, NRF2, SLC7A11, and GPX4 were analyzed by western blotting in HepG2 and Huh7 cells after treatment with E3330 (50 μM) for 0, 4, 8, 12, and 24 h. E, F Protein levels of APE1, NRF2, SLC7A11, and GPX4 in HepG2 and Huh7 cells after overexpression of APE1-WT, APE1-H309N, and APE1-C65A were analyzed by western blotting. G, H Protein levels of APE1, NRF2, SLC7A11, and GPX4 in APE1-KD HepG2 and Huh7 cells after overexpression of APE1-WT, APE1-H309N, and APE1-C65A were analyzed by western blotting. I, J Protein levels of APE1, NRF2, p-GSK3β, and GSK3β were analyzed by western blotting in HepG2 and Huh7 cells after treatment with E3330 (50 μM) for 24 h. K, L Protein levels of APE1, NRF2, p-GSK3β, and GSK3β in HepG2 and Huh7 cells after overexpression of APE1-WT and APE1-C65A were analyzed by western blotting. Data are shown as the mean ± SD (n = 3). *P < 0.05, **P < 0.01.
Fig. 7
Fig. 7. APE1 inhibition enhances the sensitivity of HCC to ferroptosis in vivo.
A Schematic description of the animal experimental design. B Representative images of dissected xenografts from the indicated groups at the end of the experiments. C The volume of Huh7 xenografts treated with erastin at different time points. Error bars are presented as mean ± SD from 5 independent repeats. P values were calculated using two-tailed unpaired Student’s t test. D The weight of the xenograft tumor at the end of the experiment. Error bars are presented as mean ± SD from 5 independent repeats. P values were calculated using two-tailed unpaired Student’s t test. E Lipid peroxidation levels in the tumor were detected using C11-BODIPY staining. F The expressions of APE1, 4-HNE, NRF2, SLC7A11, and GPX4 were determined by immunohistochemical staining. *P < 0.05, ***P < 0.001.
Fig. 8
Fig. 8. APE1-mediated expression of SLC7A11 and GPX4 via NRF2 is clinically associated with the progression and prognosis of HCC.
AD Tissue microarray of APE1, NRF2, SLC7A11, and GPX4 in liver cancer and normal liver tissues, as measured by IHC. EG The correlation of APE1 with NRF2, SLC7A11, and GPX4 was analyzed on 46 HCC tissue microarrays. H Statistical analysis of APE1 mRNA expression levels in Liver hepatocellular carcinoma (LIHC) from the TCGA database. I Kaplan–Meier survival analysis for clinical LIHC patients with APE1 expression in tumor tissues from the TCGA database. J Statistical analysis of SLC7A11 mRNA expression levels in LIHC from the TCGA database. K Statistical analysis of GPX4 mRNA expression levels in LIHC from the TCGA database. L The schematic representation of APE1 inhibition enhancing ferroptosis in hepatocellular carcinoma cells. ***P < 0.001.

Similar articles

Cited by

References

    1. Faivre S, Rimassa L, Finn RS. Molecular therapies for HCC: Looking outside the box. J Hepatol. 2020;72:342–52. doi: 10.1016/j.jhep.2019.09.010. - DOI - PubMed
    1. Dixon SJ, Lemberg KM, Lamprecht MR, Skouta R, Zaitsev EM, Gleason CE, et al. Ferroptosis: an iron-dependent form of nonapoptotic cell death. Cell. 2012;149:1060–72. doi: 10.1016/j.cell.2012.03.042. - DOI - PMC - PubMed
    1. Jiang L, Kon N, Li T, Wang SJ, Su T, Hibshoosh H, et al. Ferroptosis as a p53-mediated activity during tumour suppression. Nature. 2015;520:57–62. doi: 10.1038/nature14344. - DOI - PMC - PubMed
    1. Wang W, Green M, Choi JE, Gijon M, Kennedy PD, Johnson JK, et al. CD8(+) T cells regulate tumour ferroptosis during cancer immunotherapy. Nature. 2019;569:270–4. doi: 10.1038/s41586-019-1170-y. - DOI - PMC - PubMed
    1. Lang X, Green MD, Wang W, Yu J, Choi JE, Jiang L, et al. Radiotherapy and Immunotherapy Promote Tumoral Lipid Oxidation and Ferroptosis via Synergistic Repression of SLC7A11. Cancer Discov. 2019;9:1673–85. doi: 10.1158/2159-8290.CD-19-0338. - DOI - PMC - PubMed

Publication types

MeSH terms

Substances