. 2024 Feb 28;15(1):1838.
doi: 10.1038/s41467-024-46248-1.

Low pressure reversibly driving colossal barocaloric effect in two-dimensional vdW alkylammonium halides

Affiliations

Low pressure reversibly driving colossal barocaloric effect in two-dimensional vdW alkylammonium halides

Yi-Hong Gao et al. Nat Commun. .

Abstract

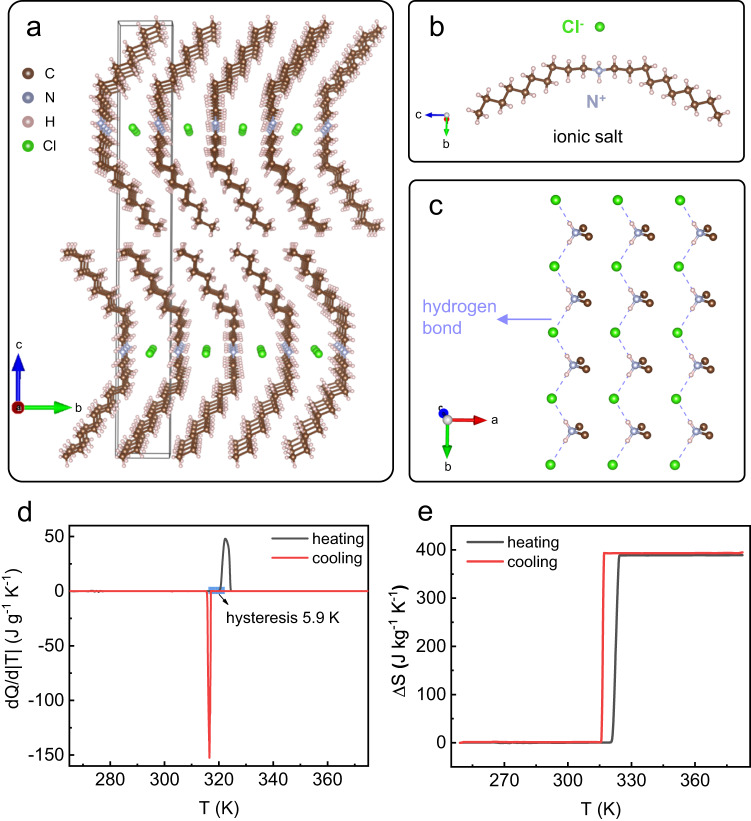
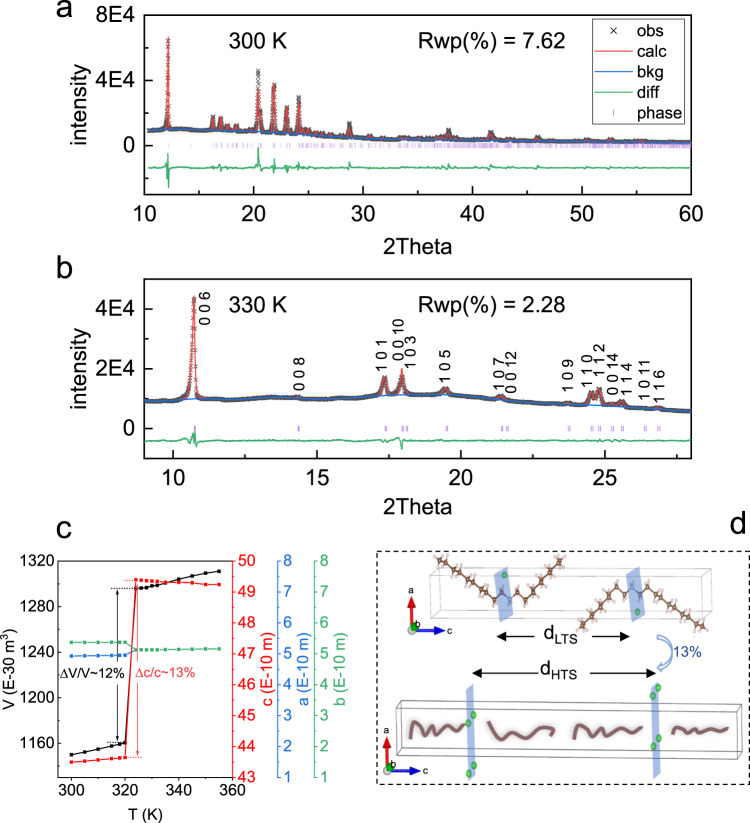
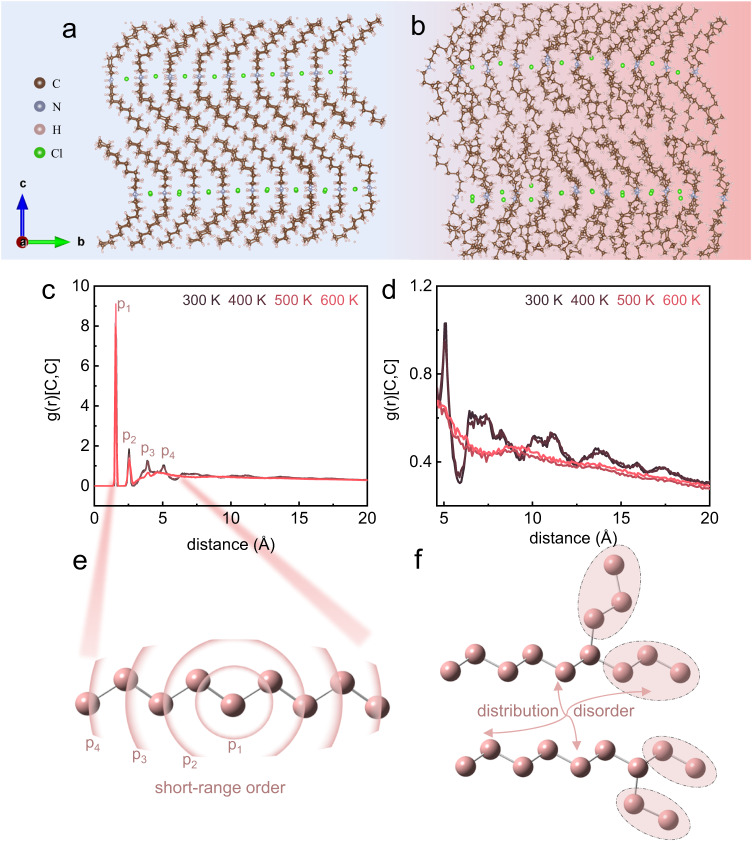
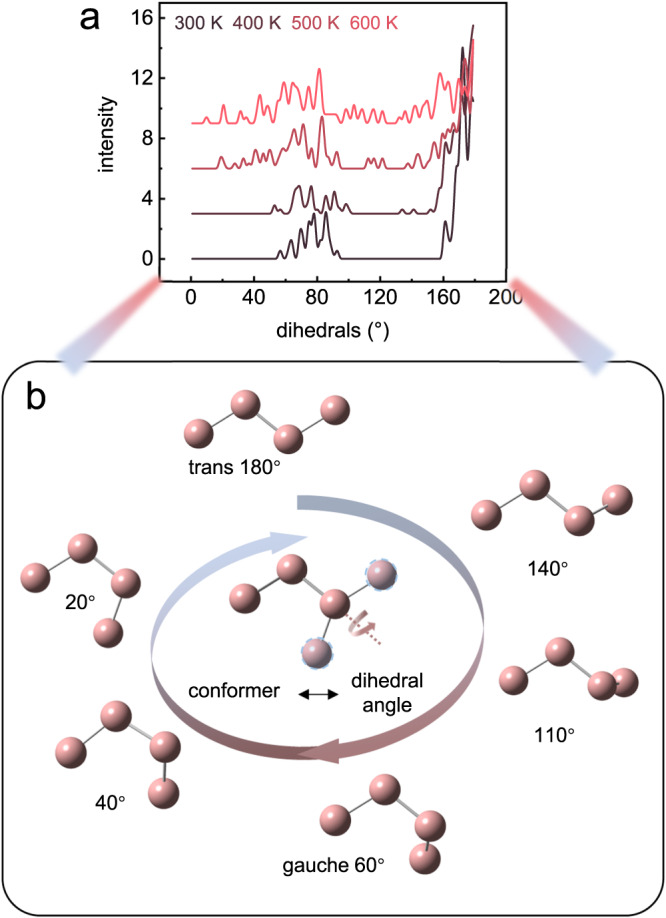
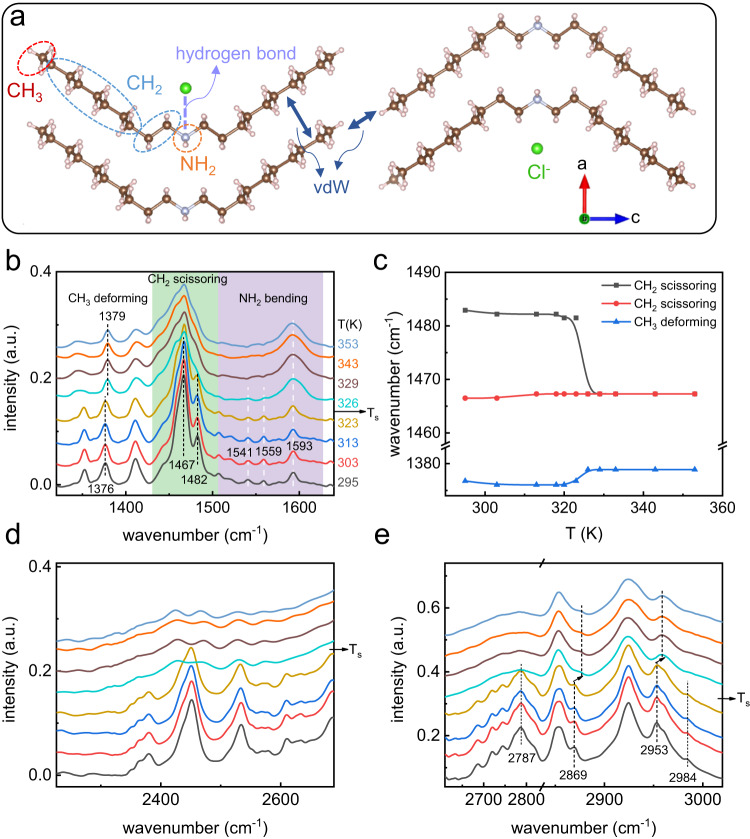
Plastic crystals as barocaloric materials exhibit the large entropy change rivalling freon, however, the limited pressure-sensitivity and large hysteresis of phase transition hinder the colossal barocaloric effect accomplished reversibly at low pressure. Here we report reversible colossal barocaloric effect at low pressure in two-dimensional van-der-Waals alkylammonium halides. Via introducing long carbon chains in ammonium halide plastic crystals, two-dimensional structure forms in (CH3-(CH2)n-1)2NH2X (X: halogen element) with weak interlayer van-der-Waals force, which dictates interlayer expansion as large as 13% and consequently volume change as much as 12% during phase transition. Such anisotropic expansion provides sufficient space for carbon chains to undergo dramatic conformation disordering, which induces colossal entropy change with large pressure-sensitivity and small hysteresis. The record reversible colossal barocaloric effect with entropy change ΔSr ~ 400 J kg-1 K-1 at 0.08 GPa and adiabatic temperature change ΔTr ~ 11 K at 0.1 GPa highlights the design of novel barocaloric materials by engineering the dimensionality of plastic crystals.


Conflict of interest statement

The authors declare no competing interests.

Figures

Fig. 1
Fig. 1. Crystalline structure and thermal properties of phase transition for (CH3–(CH2)9)2NH2Cl.
a Crystalline structure of (CH3–(CH2)9)2NH2Cl at 300 K, where the unit cell is marked by black frame. b Molecular structure of (CH3–(CH2)9)2NH2Cl. c N–H…Cl hydrogen bond interaction in (CH3–(CH2)9)2NH2Cl, where partial carbon and hydrogen atoms are omitted. d DSC measurement of (CH3–(CH2)9)2NH2Cl at atmosphere pressure with temperature ramping rate 0.1 K min−1. e Temperature-dependence of entropy change across phase transition calculated from (d).
Fig. 2
Fig. 2. Barocaloric performance of (CH3–(CH2)9)2NH2Cl obtained by the quasi-direct method.
a Heat flow curves under variable pressure measured at a temperature rate 1 K/min. b Pressure-dependent phase transition temperature from (a). c Isothermal entropy change ΔS at variable pressure from the pressure-variable entropy curves (Supplementary Fig. S5). d Reversible entropy change ΔSr by overlapping of pressurization and depressurization from (c). e Adiabatic temperature change ΔTad from pressure-variable entropy curves (Supplementary Fig. S7). f Reversible adiabatic temperature change ΔTr from heating entropy curve at atmosphere pressure and cooling entropy curves under applied pressure.
Fig. 3
Fig. 3. The comparison of reversible barocaloric entropy change of our dC10Cl with other reported colossal barocaloric materials.
The materials include 3D plastic crystals PG, NPG, NPA, spin-crossover Fe3(bntrz)6(tcnset)6, substituted adamantane Br-adamantane, Cl-adamantane and hybrid organic–inorganic perovskite (CnH2n+1NH3)2MnCl4 (n = 9, 10),,,–. Light color denotes the entropy change ΔS of phase transition, while dark color marks the reversible entropy change ΔSr driven by a hydrostatic pressure of 0.1 GPa.
Fig. 4
Fig. 4. The direct measurement of adiabatic temperature change ΔTad driven by pressure in dC10Cl.
a ΔTad induced by pressure of 0.1 GPa. b Schematic illustration of temperature change and pressure evolution during the adiabatic test, containing the processes of pressurization (press-) and depressurization (depress-). c Cycle measurements of ΔTad induced by pressure of 0.1 GPa. d Schematic diagram of direct measurement of ΔTad, where the sample’s image is for indication only, and the real image of single crystal sample is shown at top right.
Fig. 5
Fig. 5. Powder x-ray diffraction result of the (CH3–(CH2)9)2NH2Cl.
a Refinement result of diffraction pattern at 300 K for low-temperature-state in (CH3–(CH2)9)2NH2Cl. b Le Bail method fitting result of diffraction pattern at 330 K for high-temperature-state in (CH3–(CH2)9)2NH2Cl, where the observed (black), calculated patterns (red), their difference (green), peak positions (purple bar), background (blue), and error factor Rwp are provided. c The evolution of lattice parameters and unit cell volume with temperature in (CH3–(CH2)9)2NH2Cl. d Schematic illustration of layer spacing expansion across the phase transition in (CH3–(CH2)9)2NH2Cl.
Fig. 6
Fig. 6. MD simulation on the (CH3–(CH2)9)2NH2Cl.
MD results of molecular crystal structure are shown in (a) for 300 K and (b) for 500 K. c The radial distribution function of carbon atoms at variable temperatures in the range of 0–20 Å. d Enlarged zone of 5–20 Å from (c). e The schematic demonstration of short-range order of carbon chain. f The schematic demonstration of distribution disorder of carbon chain at long-range level.
Fig. 7
Fig. 7. The distribution of C–C–C–C dihedral angle composed of 3 C-C bonds from the MD simulation for (CH3–(CH2)9)2NH2Cl.
a The dihedral angle distribution at variable temperatures. b The schematic relation between the carbon chain conformer and the dihedral angle.
Fig. 8
Fig. 8. Temperature-variable infrared spectra of (CH3–(CH2)9)2NH2Cl.
a The interchain and interlayer vdW interactions and the hydrogen bond interaction of organic chains with Cl- anions in (CH3–(CH2)9)2NH2Cl. b Temperature-variable infrared spectra in the range of 1300–1650 cm−1. c Temperature-dependent vibration frequency of specific vibration band in (b). d, e Temperature-variable infrared spectra in the range of 2300–2700 cm−1 and 2700–3000 cm−1, respectively.

Similar articles

Cited by

References

    1. Moya X, Mathur ND. Caloric materials for cooling and heating. Science. 2020;370:797–803. doi: 10.1126/science.abb0973. - DOI - PubMed
    1. Pecharsky VK, Gschneidner KA., Jr. Giant magnetocaloric effect in Gd5(Si2Ge2) Phys. Rev. Lett. 1997;78:4494–4497. doi: 10.1103/PhysRevLett.78.4494. - DOI - PubMed
    1. Hu F, et al. Influence of negative lattice expansion and metamagnetic transition on magnetic entropy change in the compound LaFe11.4Si1.6. Appl. Phys. Lett. 2001;78:3675–3677. doi: 10.1063/1.1375836. - DOI
    1. Tegus O, Brück E, Buschow KHJ, De Boer FR. Transition-metal-based magnetic refrigerants for room-temperature applications. Nature. 2002;415:150–152. doi: 10.1038/415150a. - DOI - PubMed
    1. Law JY, et al. A quantitative criterion for determining the order of magnetic phase transitions using the magnetocaloric effect. Nat. Commun. 2018;9:2680. doi: 10.1038/s41467-018-05111-w. - DOI - PMC - PubMed