. 2024 Feb 28;10(1):104.
doi: 10.1038/s41420-024-01876-w.

Diminished NAD+ levels and activation of retrotransposons promote postovulatory aged oocyte (POAO) death

Affiliations

Diminished NAD+ levels and activation of retrotransposons promote postovulatory aged oocyte (POAO) death

Ajay K Singh et al. Cell Death Discov. .

Abstract

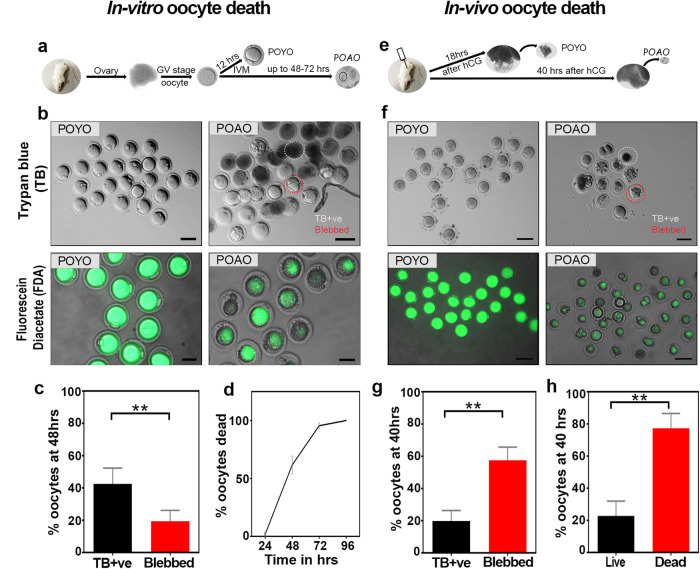
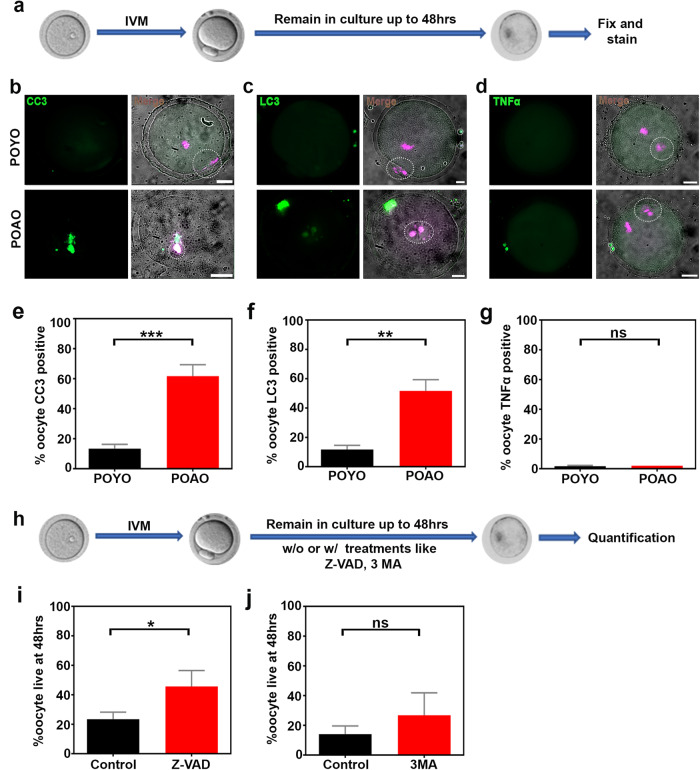
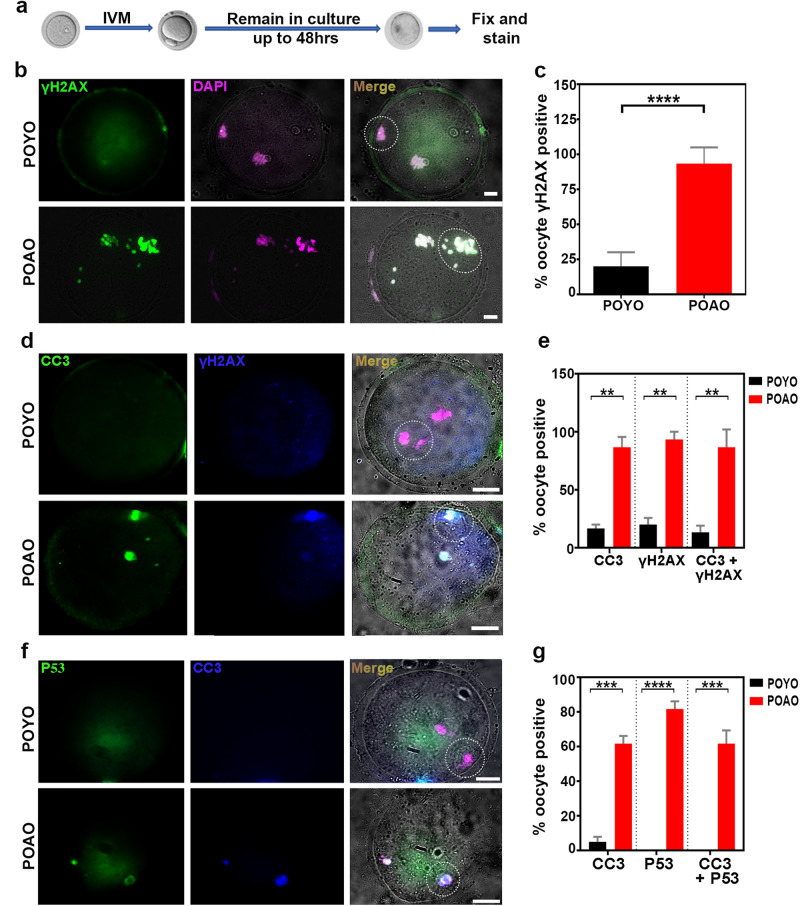
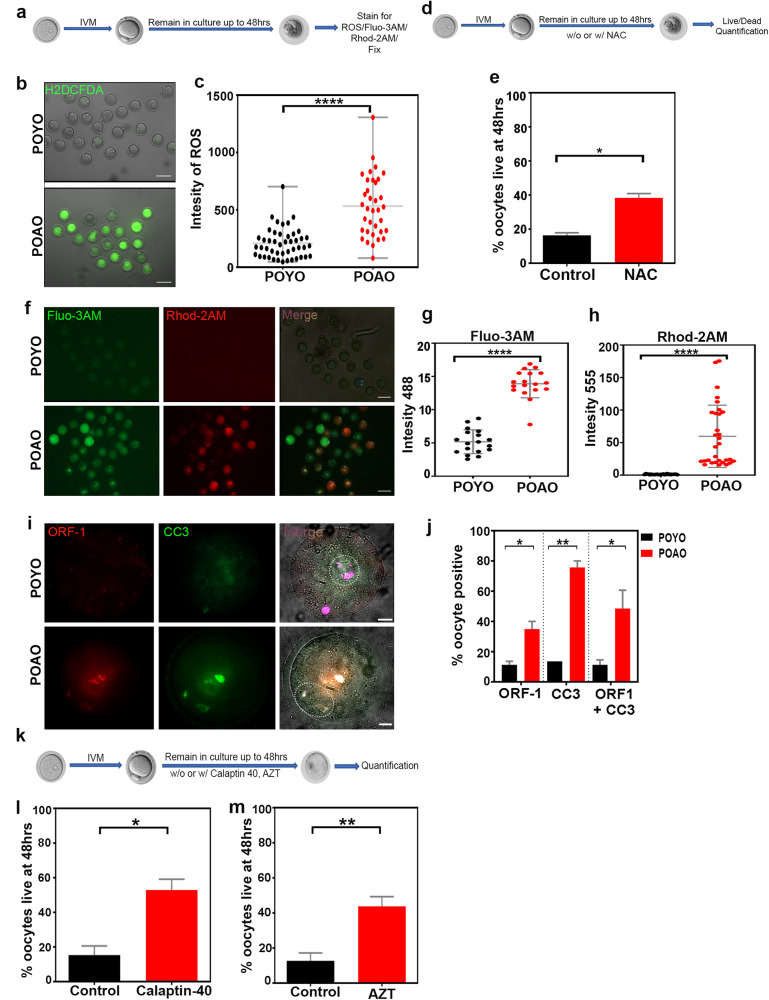
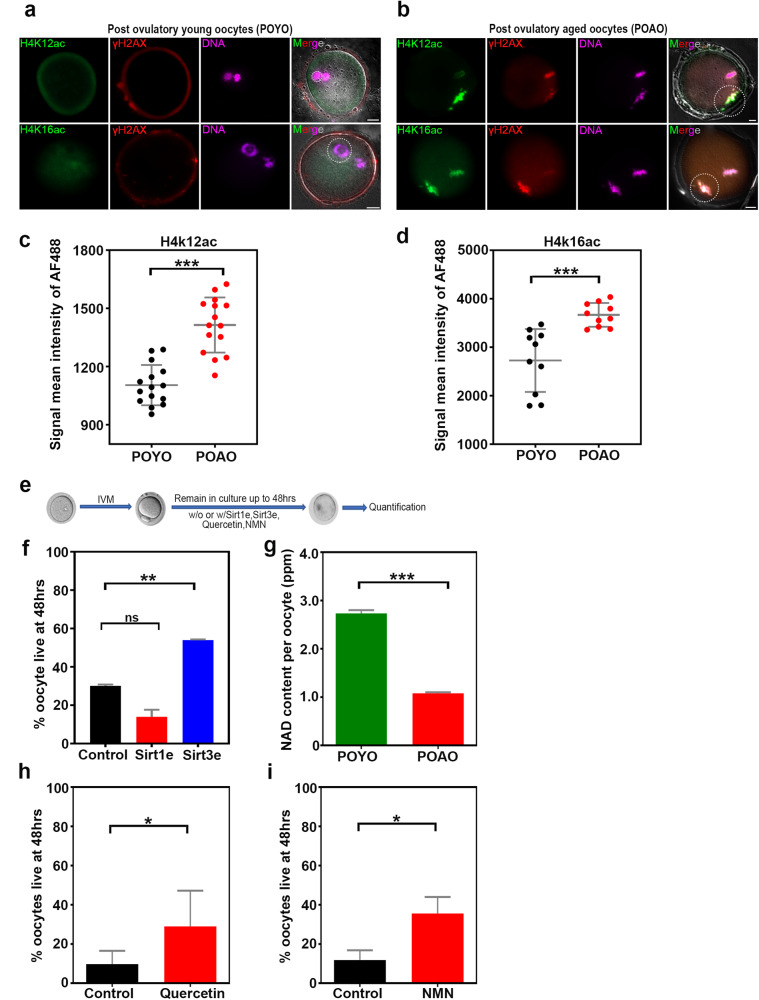
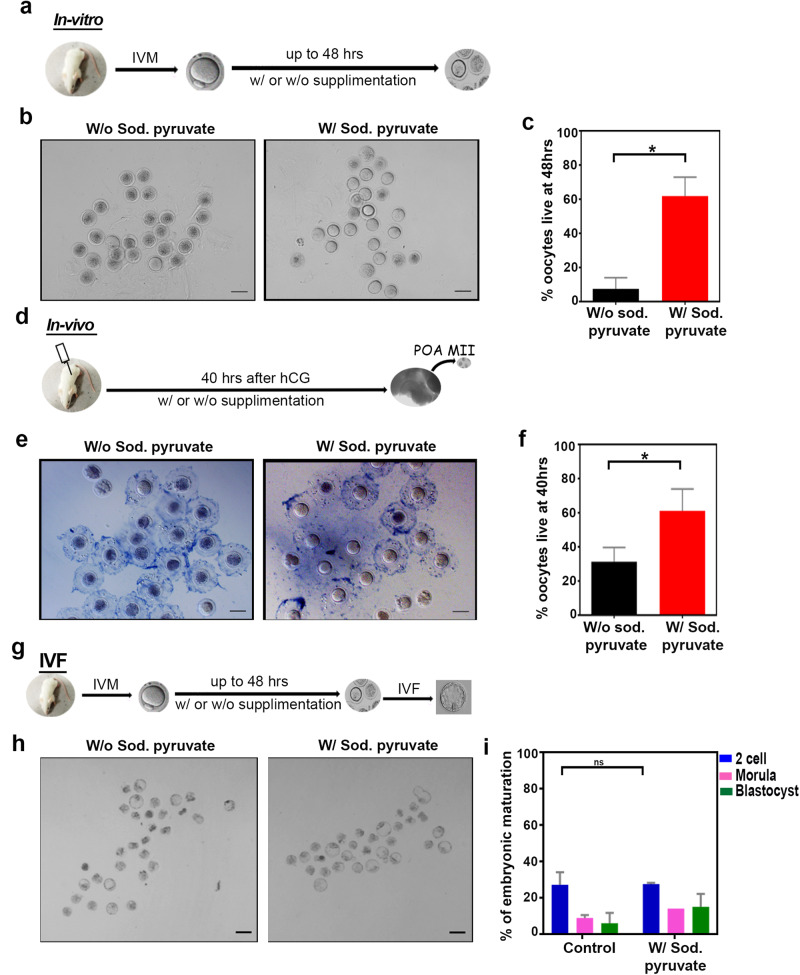
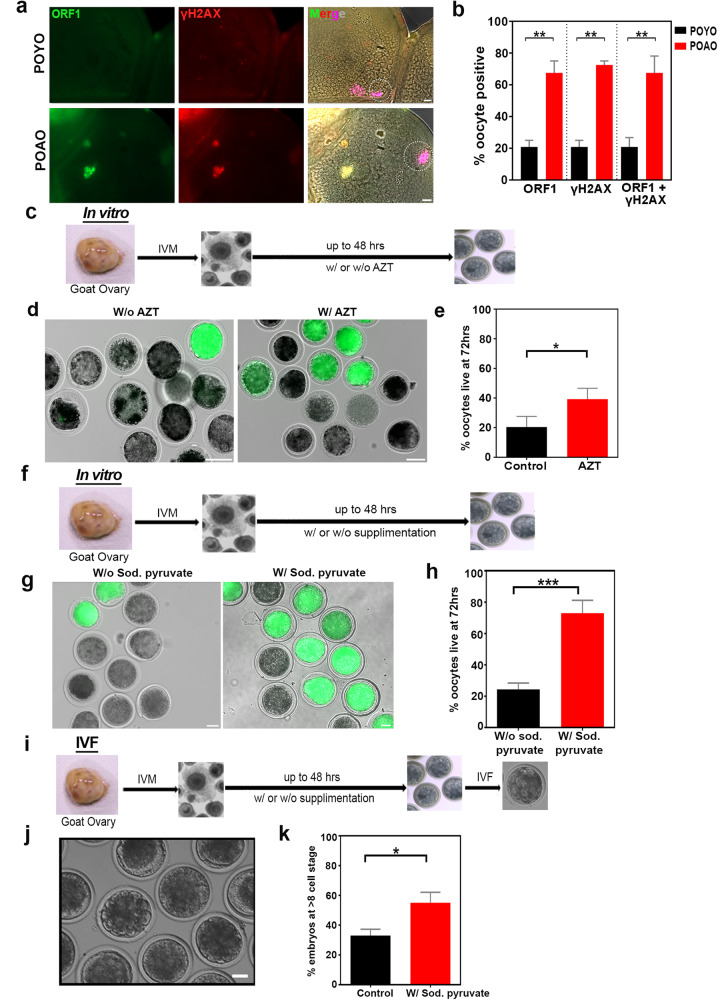
Death is the fate of postovulatory aged or unfertilized oocytes (POAO) in many animals. However, precise molecular mechanisms are yet to be discovered. Here, we demonstrate that increased amounts of reactive oxygen species (ROS), calcium ion (Ca+2) channels, and retrotransposon activity induce apoptosis, which in turn causes POAO death. Notably, suppression of ROS, Ca+2 channels, and retrotransposons delayed POAO death. Further, we found that the histone H4K12 and K16 acetylation increased via downregulation of NAD+ and NAD+ -dependent histone deacetylase SIRT3. Furthermore, adding NMN, sodium pyruvate, or CD38 inhibition delayed the death of postovulatory aged oocytes. Finally, we demonstrate the conservation of retrotransposon-induced DNA damage-dependent POAO death in higher-order vertebrates. Our findings suggest that POAO mortality is caused by cyclic cascade metabolic interactions in which low NAD+ levels increase histone acetylation by inhibiting histone deacetylases, resulting in an increase in retrotransposons, ROS, and Ca+2 channel activity and thus contributing to DNA damage-induced apoptosis.


Conflict of interest statement

The authors declare no competing interests.

Figures

Fig. 1
Fig. 1. In vitro and In vivo mouse postovulatory oocyte death kinetics.
a, e Schematic representation of postovulatory oocyte ageing. b POYO and POAO stained with trypan blue and FDA. c Quantification of trypan blue positive (TB +ve) and blebbed oocytes from in vitro maturation (d) POAO deathkinetics. f In vivo POYO and POAO stained with trypan blue and FDA. g Quantification of trypan blue +ve and blebbed oocytes from in vivo maturation. h Quantification of % live and dead oocytes from in vivo maturation. More than 500 matured oocytes used to quantify the in vitro death. 150 to 200 oocytes used to quantify the in vivo death. Error bars show mean ± s.e.m **P ≤ 0.008, unpaired t-tests. Scale bars = 100 μm.
Fig. 2
Fig. 2. Pathways responsible for POAO death.
a Schematic representation of postovulatory oocyte ageing. b Oocyte nuclei of respective stages immunostained for DNA marker DAPI (magenta) and CC3 (green). c Oocyte nuclei of respective stages stained for DNA marker DAPI (magenta) and LC3 (green) (d) Oocyte nuclei of respective stages stained for DNA marker DAPI (magenta) and TNFα (green). e, f, g Quantification of CC3, LC3 and TNFα in POYO and POAO. h Schematic representation of postovulatory oocyte ageing and treatment. i, j Quantification of % live POAO at 48 h in the presence and absence of ZVAD, and 3MA. 20 to 25 oocytes were analyzed for localizations. 130 to 150 oocytes were analyzed for each treatment. Error bars show mean ± s.e.m ***P ≤ 0.0005, **P ≤ 0.001, *P ≤ 0.03, (n.s.) P ≥ 0.01, unpaired t-tests. Scale bars = 10 μm.
Fig. 3
Fig. 3. Hyper DNA damage in POAO.
a Schematic representation of postovulatory oocyte ageing. b POYO and POAO nuclei were immunostained for DNA damage marker γH2AX (green) and DNA (magenta). c Quantification of γH2AX positive nuclei in respective ages. d POYO and POAO nuclei were immunostained for CC3 (green), DNA damage marker γH2AX (blue) and DNA (magenta). e Quantification of γH2AX and CC3 colocalized nuclei in respective ages. f POYO and POAO nuclei were immunostained for CC3 (blue), p53 (green) and DNA (magenta). g Quantification of p53 and CC3 colocalized nuclei in respective ages. 20 to 25 oocytes were analyzed for localizations and colocalizations. Error bars show mean ± s.e.m ****P ≤ 0.00001, ***P ≤ 0.0004, **P ≤ 0.001. A dotted circle indicates the polar body. Scale bars = 10 μm.
Fig. 4
Fig. 4. Retrotransposons and calcium levels upregulated in POAO.
a Schematic representation of postovulatory oocyte ageing and staining. b POYO and POAO stained for ROS (green). c Quantification of signal intensities of ROS. d Schematic representation of postovulatory oocyte ageing and treatments. e Quantification of % live POAO at 48 h in the presence and absence of NAC. f POYO and POAO stained for Fluo-3 AM (green) and Rhod-2 AM (red). g, h Quantification of Fluo-3AM and Rhod-2 AM intensities in POAO and young MII oocytes. i POYO and POAO stained for CC3 (green) and ORF1 (red). j Quantification of ORF1, CC3 alone and colocalization in POYO and POAO. k Schematic representation of postovulatory oocyte ageing and treatments. l, m Quantification of % live POAO at 48 h in the presence and absence of AZT and calpatin-40. More than 200 oocytes used for ROS and Ca+2 analysis. 20-25 oocytes used for ORF1 localization. 80 to 100 oocytes used for treatments. Error bars show mean ± s.e.m ****P ≤ 0.00001, **P ≤ 0.002, *P ≤ 0.04, unpaired t-tests. Scale bars = 10 μm.
Fig. 5
Fig. 5. Epigenetic modifications and NAD metabolism regulates the POAO death.
a, b POYO and POAO stained for histone modifications H4K12 or 16 ac (green), DNA damage marker γH2AX (red) and DNA (magenta). c, d Quantification of H4K12, 16ac signal intensities in POYO and POAO. e Schematic representation of postovulatory oocyte ageing and treatments (f) Quantification of % live POAO in the presence and absence of SIRT1 and SIRT3 enhancers. g Quantification of NAD+ in POYO and POAO. h, i Quantification of % live POAO in the presence and absence of CD38 inhibitor quercetin and NMN. 20–25 oocytes used for H4K12 and 16ac localization. 80 to 100 oocytes used for treatments. Error bars show mean ± s.e.m ***P ≤ 0.0001, **P ≤ 0.004, *P ≤ 0.03, (n.s.) P ≥ 0.01, paired t-tests. Scale bars = 10 μm.
Fig. 6
Fig. 6. Sodium pyruvate enhances the POAO life without compromising the quality.
a Schematic representation of oocyte treatments in vitro. b Trypan blue staining of POAO with or without sodium pyruvate. c Quantification of % live POAO in the presence and absence of sodium pyruvate at 48 h. d Schematic representation of oocyte treatments in vivo. e Trypan blue staining of POAO with or without sodium pyruvate. f Quantification of % live POAO with or without sodium pyruvate oral gavage at 40 h. g Schematic representation of IVF. h Embryo maturation efficiencies of oocytes POAO with or without sodium pyruvate. i % embryo maturation. Error bars show mean ± s.e.m, *P ≤ 0.02, paired t-tests. More than 200 oocytes were quantified for each treatment. Scale bars = 100 μm.
Fig. 7
Fig. 7. Evolutionary conservation of sodium pyruvate-dependent delayed POAO death.
a POYO and POAO nuclei were immunostained for ORF1 (green), γH2AX (red) and DNA (magenta). b Quantification of ORF1 and γH2AX colocalized nuclei in respective ages. c Schematic representation of goat oocyte IVM followed by POAO with or without AZT. d POAO with or without AZT stained for FDA (green). e Quantification of % live POAO with or without AZT at 72 h. f Schematic representation of goat oocyte IVM followed by POAO with or without sodium pyruvate. g POAO with or without sodium pyruvate stained for FDA (green). h Quantification of % live POAO with or without sodium pyruvate at 72 h. i Schematic representation of goat oocyte IVM followed by POAO with or without sodium pyruvate and IVF, embryo maturation. j Bright field images of goat embryo (k) Quantification of embryo development of goat POAO with or without sodium pyruvate. 20 to 25 oocytes were analyzed for localizations and colocalizations. Error bars show mean ± s.e.m ***P ≤ 0.0001, **P ≤ 0.004, *P ≤ 0.03, unpaired t-tests. Scale bars = 100 μm.

References

    1. Holesh JE, Bass AN, Lord M. Physiology, Ovulation. Stat Pearls [Internet]. Treasure Island (FL): Stat Pearls Publishing. 2022.
    1. Martin JH, Nixon B, Cafe SL, Aitken RJ, Bromfield EG, Lord T. Oxidative stress and reproductive function: oxidative stress and in vitro ageing of the post-ovulatory oocyte: an update on recent advances in the field. Reproduction. 2022;164:F109–F24. doi: 10.1530/REP-22-0206. - DOI - PubMed
    1. Lord T, Aitken RJ. Oxidative stress and ageing of the post-ovulatory oocyte. Reproduction. 2013;146:R217–27. doi: 10.1530/REP-13-0111. - DOI - PubMed
    1. Wilcox AJ, Weinberg CR, Baird DD. Post-ovulatory ageing of the human oocyte and embryo failure. Hum Reprod. 1998;13:394–7. doi: 10.1093/humrep/13.2.394. - DOI - PubMed
    1. Zhang X, Liu X, Chen L, Wu DY, Nie ZW, Gao YY, et al. Caffeine delays oocyte aging and maintains the quality of aged oocytes safely in mouse. Oncotarget. 2017;8:20602–11. doi: 10.18632/oncotarget.15292. - DOI - PMC - PubMed