. 2024 Feb 28;15(1):1799.
doi: 10.1038/s41467-024-45751-9.

A spatial map of hepatic mitochondria uncovers functional heterogeneity shaped by nutrient-sensing signaling

Affiliations

A spatial map of hepatic mitochondria uncovers functional heterogeneity shaped by nutrient-sensing signaling

Sun Woo Sophie Kang et al. Nat Commun. .

Abstract

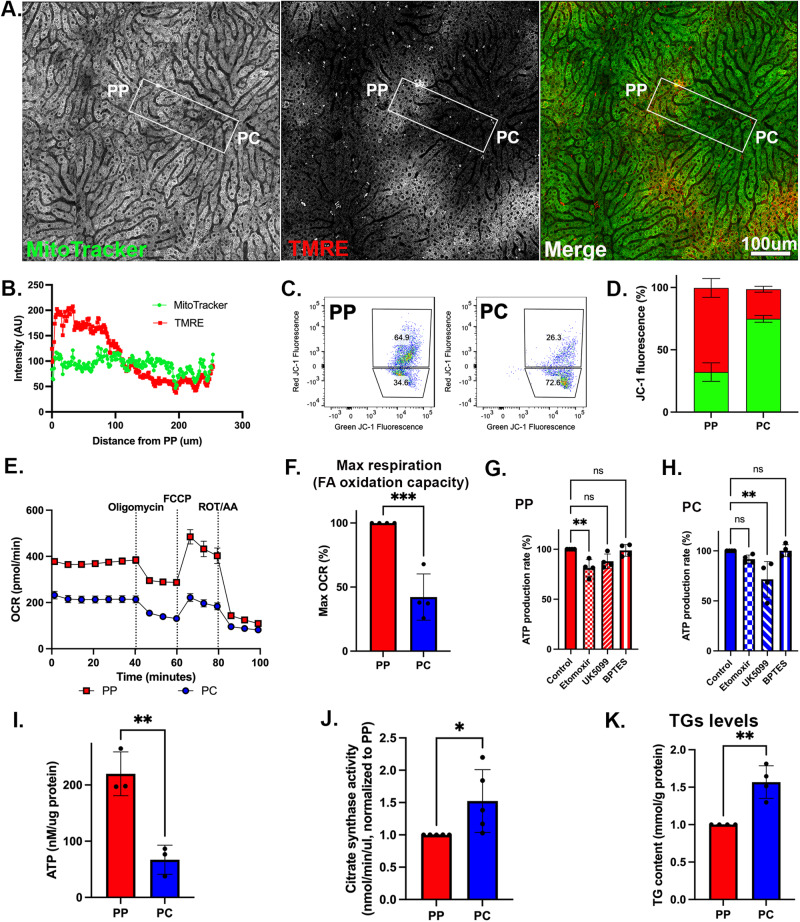
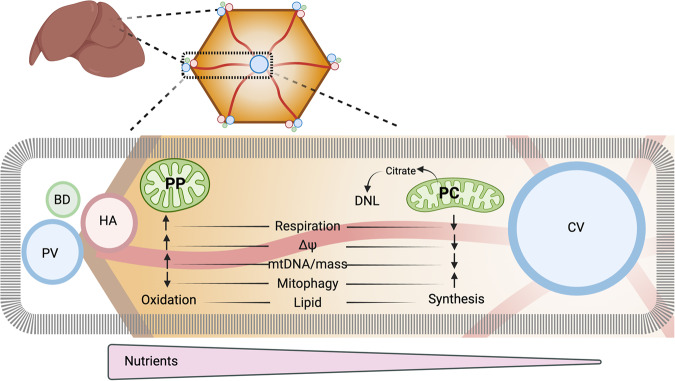
In the liver, mitochondria are exposed to different concentrations of nutrients due to their spatial positioning across the periportal and pericentral axis. How the mitochondria sense and integrate these signals to respond and maintain homeostasis is not known. Here, we combine intravital microscopy, spatial proteomics, and functional assessment to investigate mitochondrial heterogeneity in the context of liver zonation. We find that periportal and pericentral mitochondria are morphologically and functionally distinct; beta-oxidation is elevated in periportal regions, while lipid synthesis is predominant in the pericentral mitochondria. In addition, comparative phosphoproteomics reveals spatially distinct patterns of mitochondrial composition and potential regulation via phosphorylation. Acute pharmacological modulation of nutrient sensing through AMPK and mTOR shifts mitochondrial phenotypes in the periportal and pericentral regions, linking nutrient gradients across the lobule and mitochondrial heterogeneity. This study highlights the role of protein phosphorylation in mitochondrial structure, function, and overall homeostasis in hepatic metabolic zonation. These findings have important implications for liver physiology and disease.


Conflict of interest statement

The authors declare no competing interests.

Figures

Fig. 1
Fig. 1. Spatial enrichment of PP and PC hepatocytes.
A Schematic diagram depicting the workflow. Hepatocytes were isolated from the murine liver using two-step collagenase perfusion, after which unique surface markers were applied to label cells. Labeled cells were then enriched using fluorescence-activated cell sorting (FACS) to obtain hepatocytes from different zones. Illustration created using BioRender. B Immunofluorescence staining of a liver section showing the zonal distribution of CD73 (cyan) and E-cadherin (magenta). Representative image from three independent experiments. C Representative two-dimensional scatter plot of hepatocytes labeled with CD73 and E-cadherin. D Western blot of spatially sorted hepatocytes. Representative blot from n = 3 independent experiments. Source data is provided as a Source Data file for (D). PP periportal, PC pericentral, GS glutamine synthetase.
Fig. 2
Fig. 2. Comparative mitochondrial proteome of spatially sorted hepatocytes.
A Total number of non-mitochondrial proteins (gray) and mitochondrial proteins (green) was detected by mass spectrometry (left; n = 4 mice). Percentage of periportal (PP), pericentral (PC), and unzonated (UZ) mitochondrial proteins (right); zonated expression based on a p-value (0.05). B Volcano plot shows the log2 PC/PP fold-change (x-axis) and the −log10 p-value (y-axis) for mitochondrial proteins. Proteomics data was analyzed with Limma R package (v3.40.6). C, D Spatial distribution of the top 25 PP or PC mitochondrial proteins. Proteins were color-coded to reflect their cellular function. Pathways were listed based on the frequency at which they appeared. E Abundance of representative nuclear and mitochondria-encoded respiratory chain proteins are shown with floating bar graphs. The center represents the mean, top and bottom represent maxima and minima. The p-values were calculated with Limma R package (v3.40.6). F Bioinformatic STRING analysis of the PC mitochondria proteomic data. The interaction map illustrates the functional association of PC mitochondrial metabolism with cytosolic lipid synthesis. Data presented as mean ± SD. *p < 0.05, **p < 0.01, ***p < 0.001, ****p < 0.0001.
Fig. 3
Fig. 3. PP mitochondria display higher bioenergetic capacity.
A Intravital microscopy of the hepatic lobule labeled with tetramethylrhodamine ethyl ester (TMRE), and MitoTracker Green to evaluate the relative mitochondrial membrane potential. The scale bar is 100 μm. Similar trends were observed in three independent experiments. B Mitochondrial membrane potential was evaluated by measuring fluorescence intensity (AU) along a PP–PC axis line. C, D Measurement of mitochondrial membrane potential using JC1 and flow cytometry in spatially sorted hepatocytes. Dot plots of a representative experiment is shown. The bar graph shows similar trends in three independent experiments. Stacked bar plot of relative percentages of green or red positive cells from n = 3. Two-way ANOVA, Šidák multiple comparisons test p < 0.0001. E Oxygen consumption rate (OCR) in spatially sorted hepatocytes using the XF Mito Stress Test Kit and Seahorse XF96 Analyzer. Samples were normalized to cell number. Similar trends were observed in four independent experiments. F Maximum respiration capacity in spatially sorted hepatocytes expressed relative to PP. Data presented as mean ± SD from n = 4 independent experiments. Statistical significance was calculated with two-tailed unpaired Student’s t-test ***p = 0.0007. G, H Substrate dependency assay in spatially sorted hepatocytes using the MitoFuel Flex test. ATP production rate relative to PP is shown in cells treated with etomoxir, UK5099, or BPTES. Data presented as mean ± SD from n = 4 independent experiments. Statistical significance was calculated using one-way ANOVA, Dunnett’s multiple comparisons test; ns not significant; **p = 0.003. I ATP content relative to PP in spatially sorted hepatocytes using the colorimetric luciferase assay from three independent experiments. J Citrate synthase activity relative to PP in spatially sorted hepatocytes. Data presented as mean ± SD from n = 5 independent experiments. Statistical significance was calculated using two-tailed unpaired Student’s t-test *p = 0.04. K Intracellular triglyceride (TG) concentration relative to PP in spatially sorted hepatocytes. Data presented as mean ± SD from n = 4 independent experiments. Statistical significance was calculated using two-tailed unpaired Student’s t-test **p = 0.002. Periportal (PP) is labeled in red; pericentral (PC) in blue.
Fig. 4
Fig. 4. Mitochondrial morphology and organization across the lobule.
A Confocal image of the PP–PC axis in liver sections from Mito-Dendra2 transgenic mice. Mitochondria are shown in white, and actin was labeled with phalloidin in red. Enlarged insets of a representative PP (left) and PC (right) cell are shown. B Mitochondria were visualized by Focused Ion Beam Scanning Electron Microscopy (FIB-SEM). Representative sections of PP (left) and PC (right) cells. N Nucleus, LD Lipid droplet. C Segmentation and volume rendering of mitochondria from PP (left) and PC (right) cells using MitoNet and empanada-napari. DF Quantification of mitochondrial morphological features including volume, surface area, and sphericity index (a measure of similarity to a perfect sphere (=1)). A collection of 175 mitochondria in PP and 250 in PC were analyzed and statistical significance calculated by two-sided Mann–Whitney test. Data presented as mean ± SD; ****p < 0.0001. G Quantification of relative mtDNA copy number by qPCR in spatially sorted hepatocytes. The bar graph shows four independent experiments. Data presented as mean ± SD; ****p < 0.0001. Periportal (PP) is labeled in red; pericentral (PC) in blue.
Fig. 5
Fig. 5. PC mitochondria display higher turnover via mitophagy.
A mtKeima is a pH-sensitive mitophagy reporter. The ratio between the 440 nm (green; neutral pH) and 560 nm (red; acidic pH) excitation measures the proportion of mitochondria undergoing mitophagy. Illustration created using BioRender. B Intravital microscopy of transgenic mice expressing mtKeima in saline-injected or leupeptin-injected mice. Representative images of the hepatic lobule and magnified insets of PP and PC regions. C Quantification of mitophagy in PP and PC regions expressed as a fold-change relative to PP cells. Data presented as mean ± SD from n = 3 independent experiments. Statistical significance was calculated using two-way ANOVA, Tukey’s multiple comparisons test; ns not significant; *p = 0.03, **p = 0.001. D Immunoblots of Bnip3 and LC3A/B of unsorted (total) and sorted PP and PC hepatocyte populations from livers treated with either saline or leupeptin. Mouse 1 (M1); Mouse 2 (M2). EF Quantification of Bnip3 expression and LC3B/A ratio. Data presented as mean ± SD from n = 5 (saline) or n = 6 (leupeptin) independent experiments. Statistical significance was calculated using two-way ANOVA, Tukey’s multiple comparisons tests; ns not significant; *p = 0.02 and **p = 0.006 (Bnip3) ;*p = 0.03 and **p = 0.0014 (LC3B/A). Periportal (PP) is labeled in red; pericentral (PC) in blue.
Fig. 6
Fig. 6. Phosphoproteome highlights spatially regulated pathways contributing to mitochondrial phenotypes.
A Overview of phosphopeptides, phosphosites, and phosphoproteins identified in the phosphoproteome. B Proportion of phosphorylated serine (p-S), threonine (p-T), and tyrosine (p-Y) residues in the identified phosphopeptides. C Proportion of proteins identified with a certain number of phosphorylated residues per protein. D Number of phosphosites with a PP, PC, or unzonated (UZ) bias is shown in the bar graph. EF The PP or PC zonated phosphoproteins were analyzed using GO enrichment analysis. G Mitochondrial phosphoproteome is shown in a volcano plot with log2 PC/PP fold-change (x-axis) and the −log10 p-value (y-axis).
Fig. 7
Fig. 7. Nutrient-sensing signaling contributes to mitochondrial functional and morphological diversity.
A, B AMPK or mTOR signaling was modulated in vivo by injecting an activating drug, AICAR or MHY1485, or an inhibitory drug Cpc or Torin, respectively. The impact on mitochondrial membrane potential (JC1) and lipid droplets (BODIPY) was evaluated using flow cytometry. Data presented as mean ± SD from n = 4 independent experiments. Statistical significance was calculated using two-way ANOVA, and Fishers Least Significant Difference (LSD) test. C Confocal images of hepatocytes from liver sections of Mito-Dendra2 mice treated with vehicle, AICAR, or MHY1485. Mitochondria are shown in white, and phalloidin outlines hepatocytes in red. Scale bar = 3 μm. D Mitochondrial sphericity in mice treated with vehicle, AICAR, or MHY1485 was quantified. Data presented as mean ± SD from n = 4 independent experiments. Statistical significance was calculated using two-way ANOVA, and Tukey’s multiple comparisons test. Periportal (PP) is labeled in red; pericentral (PC) in blue.
Fig. 8
Fig. 8. Mitochondrial zonation in the hepatic lobule.
Mitochondria exhibit diversity in both topology and functions along the PP–PC axis. This variation is influenced by nutrient gradients, nutrient-sensing signaling, and subsequent phosphorylation processes. These factors enable hepatic mitochondria to promptly and reversibly adapt to fluctuations in nutrient supply.

Update of

References

    1. Picard M, Shirihai OS. Mitochondrial signal transduction. Cell Metab. 2022;34:1620–1653. doi: 10.1016/j.cmet.2022.10.008. - DOI - PMC - PubMed
    1. Glancy B. Visualizing mitochondrial form and function within the cell. Trends Mol. Med. 2020;26:58–70. doi: 10.1016/j.molmed.2019.09.009. - DOI - PMC - PubMed
    1. Hoppins S. The regulation of mitochondrial dynamics. Curr. Opin. Cell Biol. 2014;29:46–52. doi: 10.1016/j.ceb.2014.03.005. - DOI - PubMed
    1. Friedman JR, Nunnari J. Mitochondrial form and function. Nature. 2014;505:335–343. doi: 10.1038/nature12985. - DOI - PMC - PubMed
    1. Westermann B. Bioenergetic role of mitochondrial fusion and fission. Biochim. Biophys. Acta. 2012;1817:1833–1838. doi: 10.1016/j.bbabio.2012.02.033. - DOI - PubMed

LinkOut - more resources