. 2024 Feb 28;15(1):1828.
doi: 10.1038/s41467-024-45475-w.

Prediction of plasma ctDNA fraction and prognostic implications of liquid biopsy in advanced prostate cancer

Affiliations

Prediction of plasma ctDNA fraction and prognostic implications of liquid biopsy in advanced prostate cancer

Nicolette M Fonseca et al. Nat Commun. .

Abstract

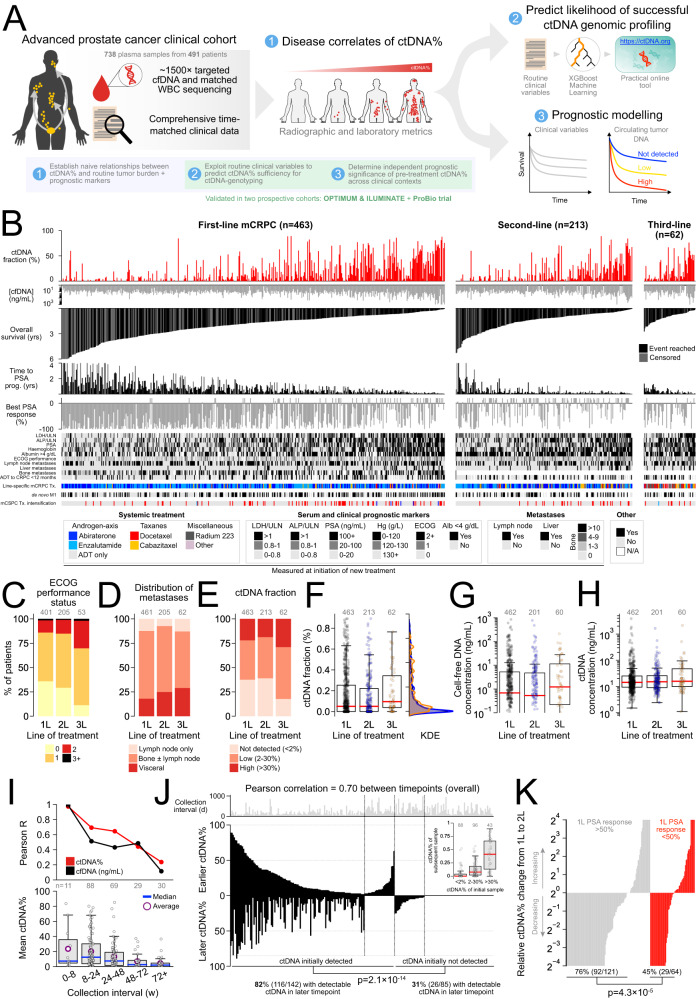
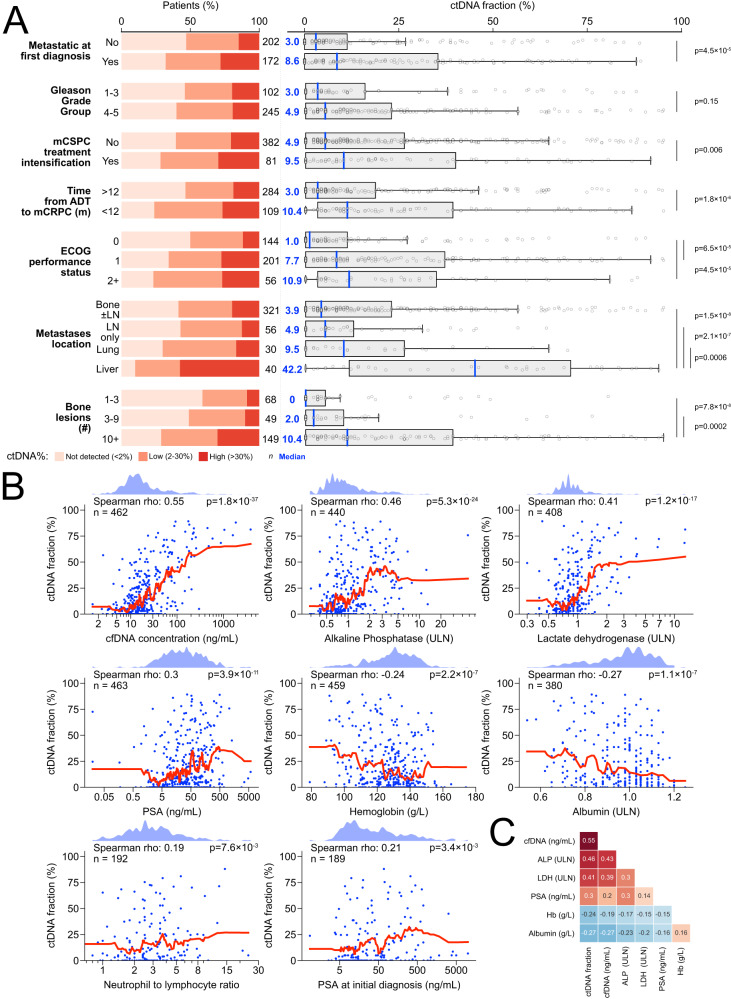
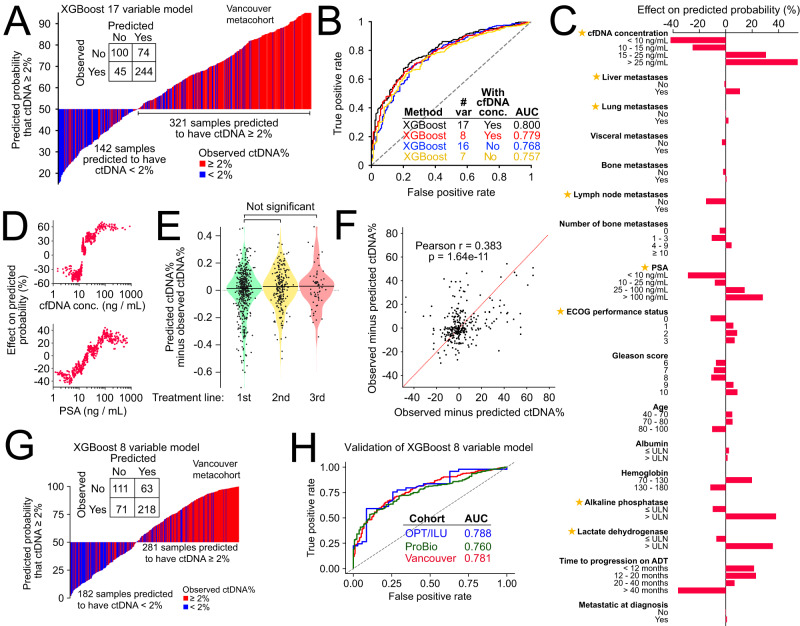
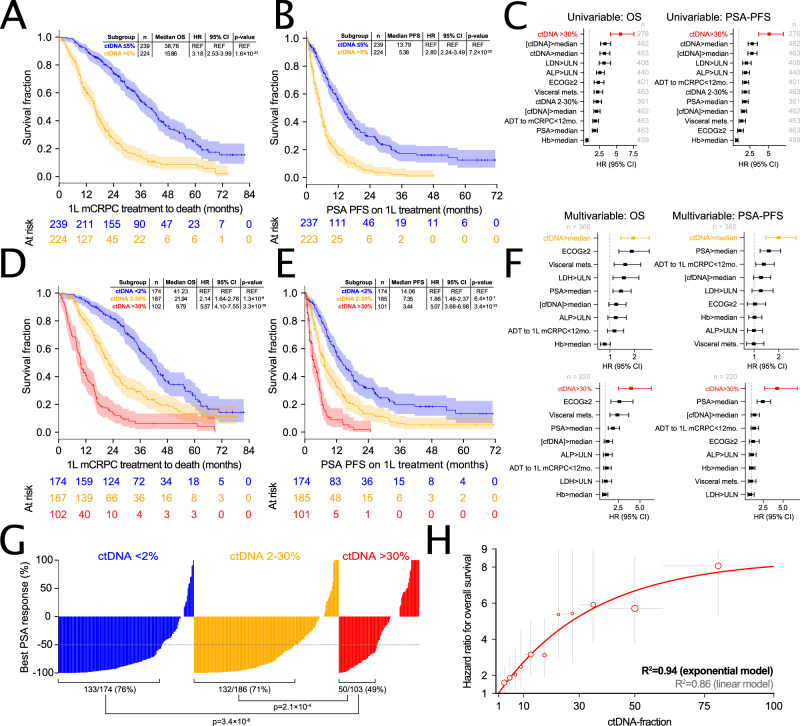
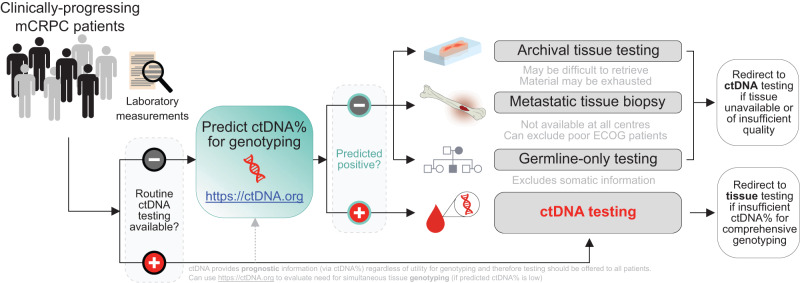
No consensus strategies exist for prognosticating metastatic castration-resistant prostate cancer (mCRPC). Circulating tumor DNA fraction (ctDNA%) is increasingly reported by commercial and laboratory tests but its utility for risk stratification is unclear. Here, we intersect ctDNA%, treatment outcomes, and clinical characteristics across 738 plasma samples from 491 male mCRPC patients from two randomized multicentre phase II trials and a prospective province-wide blood biobanking program. ctDNA% correlates with serum and radiographic metrics of disease burden and is highest in patients with liver metastases. ctDNA% strongly predicts overall survival, progression-free survival, and treatment response independent of therapeutic context and outperformed established prognostic clinical factors. Recognizing that ctDNA-based biomarker genotyping is limited by low ctDNA% in some patients, we leverage the relationship between clinical prognostic factors and ctDNA% to develop a clinically-interpretable machine-learning tool that predicts whether a patient has sufficient ctDNA% for informative ctDNA genotyping (available online: https://www.ctDNA.org ). Our results affirm ctDNA% as an actionable tool for patient risk stratification and provide a practical framework for optimized biomarker testing.


Conflict of interest statement

C.M.D. reports Honoria from MSD, Bristol-Myers Squibb, Medison and Pfizer and consulting fees from Biomica LTD. E.M.K. has served in consulting or advisory roles in Astellas Pharma, Janssen, Ipsen and received honoraria from Janssen, Ipsen, Astellas Pharma, and Research Review. E.M.K. also reports research funding from Astellas Pharma (institutional) and AstraZeneca (institutional), and travel expense reimbursement from Astellas Pharma, Pfizer, Ipsen and Roche. K.N. has served on advisory boards for Abbvie, Astellas, AstraZeneca, Bayer, Bristol-Myers Squibb, Merck, Janssen and Tersera. D.L.F. has served in advisory roles or received honorarium from Janssen, Bayer, Astellas, AstraZeneca and Pfizer. M.A. is a shareholder in Fluivia Ltd. K.N.C. reports grants from Janssen, Astellas, and Sanofi during the conduct of the study. K.N.C. also reports grants and personal fees from Janssen, Astellas, AstraZeneca, and Sanofi, as well as personal fees from Constellation Pharmaceuticals, Daiichi Sankyo, Merck, Novartis, Pfizer, Point Biopharma, and Roche outside the submitted work. A.W.W. has served on advisory boards and/or received honoraria from AstraZeneca, Astellas, Bayer, EMD Serono, Janssen, Merck, and Pfizer. A.W.W.’s laboratory has a contract research agreement with ESSA Pharma. The remaining authors declare no competing interests.

Figures

Fig. 1
Fig. 1. Clinical mCRPC cohort with comprehensive clinical annotation and ctDNA-fraction estimates.
A Study overview. B Per-patient summary of clinical prognostic metrics and treatment outcomes stratified by line of mCRPC therapy, illustrating approximate relationships between high ctDNA-fraction (ctDNA%) (see Supplementary Data 2) and poor prognosis (see Supplementary Data 1 for complete list of clinical variables). All variables (including ctDNA%) are measured at time of line-specific mCRPC treatment initiation except for pre-mCRPC clinical history and diagnostic metrics (i.e., time from androgen deprivation therapy (ADT) initiation to CRPC diagnosis, de novo metastatic diagnosis, and treatment intensification for metastatic castration-sensitive prostate cancer (mCSPC)). Bars representing right-censored time-to-event clinical endpoints are colored gray (events reached are black). Patients whose best PSA response was rising PSA (i.e., nadir at baseline) have been truncated at a fixed positive value. Note that bone metastases were only enumerated in the first-line context, although all patients (independent of treatment line) were evaluated for bone lesion presence/absence. Temporal consistency of key patient clinical characteristics (C, D) and plasma cfDNA and ctDNA measurements (EH) per initiating line of treatment. Number of patients with evaluable data matched to line of treatment annotated above (see Supplementary Data 3). I Correlation between consecutive same-patient ctDNA% and cfDNA concentration measurements taken at sequential clinical progressions as a function of collection interval. J Mirrored barplot showing same-patient ctDNA% across 227 consecutively collected cfDNA sample pairs (p-value reflects Fisher’s Exact Test). In-set boxplot is centered at median and displays interquartile ranges (IQR) and minima and maxima extending to 1.5× IQR. K Serial ctDNA% dynamics are associated with PSA response on intervening treatment. Relative ctDNA% change from initiation of first-line mCRPC therapy to initiation of second-line therapy in patients who did or did not achieve a PSA response ≥50% to first-line treatment. Fisher’s Exact Test compares proportion of patients in each category with serially decreasing ctDNA%. All p-values are two-sided. Yrs years, Tx treatment, PCa prostate cancer, prog. progression, w weeks, KDE kernel density estimation, ULN upper-limit of normal.
Fig. 2
Fig. 2. Serum and radiographic prognostic clinical features correlate with baseline ctDNA fraction.
A Fraction of patients with ctDNA>30%, ctDNA 2-30%, and ctDNA<2% (left) and ctDNA% as a continuous variable (right) across various categorical clinical subgroups. Note that the “bone ± lymph node” category excludes patients with visceral metastases, and the “lung” category excludes patients with liver metastases; the “liver” category does not exclude any other metastatic subgroup. P-values reflect Mann-Whitney U tests and are two-sided; boxplots are centered at the median and display interquartile ranges (IQR) and minima and maxima extending to 1.5× IQR. B Correlation between ctDNA% and eight continuous prognostic serum markers. K-nearest neighbor regression (neighbors = 20 with uniform weights; red line) is used to nonparametrically visualize each bivariate relationship (i.e., avoids making assumptions about how ctDNA% is linked to each clinical factor). Kernel density estimates shown above. Spearman p-values are two-sided. C Correlation matrix showing that most serum prognostic markers are co-correlated. Spearman’s rho is annotated. See Supplementary Data 2 for per-patient ctDNA% values. mCSPC metastatic castration sensitive prostate cancer, ADT androgen deprivation therapy, m months, LN lymph node, Hb hemoglobin, PSA prostate-specific antigen, ULN upper limit of normal.
Fig. 3
Fig. 3. ctDNA fraction prediction based on routine clinical variables.
A Predicted probability of ctDNA≥2% based on our 17-feature XGBoost model applied to 463 first-line mCRPC samples (see Supplementary Data 6 for complete list of clinical variables used for model training plus model performance metrics). True observed ctDNA ≥ 2% status is indicated with color. In-set confusion matrix for classification of ctDNA ≥ 2%. B Receiver operating characteristic curves for four separately trained and optimized XGBoost models evaluating different sets of clinical input features. C Average contribution of individual clinical input features to model predictions, quantified using Shapley (SHAP) values (evaluated on the 17-feature XGBoost model). Stars indicate clinical features selected for the parsimonious 8-variable ctDNA% prediction model. D SHAP scores for cfDNA concentration and PSA as continuous variables (evaluated on the 17-feature XGBoost model). E Uniform model prediction error across sequential lines of mCRPC treatment (pairwise comparisons use the Mann-Whitney U test and are not corrected for multiple hypothesis testing). F Scatterplot showing observed minus predicted ctDNA% in the earlier (x-axis) versus later (y-axis) timepoint for 288 same-patient sample pairs across different lines of treatment (p-value is two-sided). Positive correlation between axes suggests the existence of patient and/or tumor-specific multipliers on ctDNA% (i.e., clinical or biological variables not accounted for in our model). G Predicted probability of ctDNA ≥ 2% based on our 8-feature XGBoost model applied to 463 first-line mCRPC samples. H Validation of our 8-feature XGBoost model in two external clinical trial cohorts. var variables, conc. concentration.
Fig. 4
Fig. 4. ctDNA fraction is independently associated with mCRPC treatment outcomes.
Kaplan-Meier estimates of time from initiation of first-line systemic therapy for mCRPC to death or last follow-up (A + D) and PSA progression-free survival on first-line therapy (B + E) stratified by synchronously-measured ctDNA% dichotomized by median (A + B) or by predefined bins (high, low, undetectable) (D + E)—see Supplementary Data 2 for per-patient ctDNA% values. Shading indicates 95% confidence intervals; in-set tables show univariable hazard ratios (HRs) from a Cox proportional hazards model. Forest plots show HRs and 95% confidence intervals from univariable (C) and multivariable (F) Cox proportional hazard regression models incorporating ctDNA% plus additional clinical prognostic markers. G Waterfall plot showing best PSA response (relative to baseline PSA) on first-line mCRPC therapy stratified by baseline ctDNA% (ctDNA > 30%, ctDNA 2-30%, and ctDNA < 2%). P-values (two-sided) reflect Fisher’s Exact Test’s comparing the proportion of patients achieving a ≥50% PSA response across ctDNA categories. H Evidence for a nonlinear relationship between ctDNA% and risk of death. Univariable Cox proportional HRs (plotted as dots) for overall survival from initiation of first-line mCRPC therapy as a function of ctDNA% partitioned into non-overlapping intervals. Each interval is demarcated by the horizontal gray lines, with the center of each ctDNA% interval used as each datapoint’s x-coordinate. Vertical gray lines show individual intervals’ 95% HR confidence intervals. For all comparisons, the reference group is patients with ctDNA < 2%; marker size is proportional to the number of patients in the non-reference group (per-interval n is provided in the Source Data file). Solid red line shows a three-parameter negative exponential (with upper asymptote) curve fit. See Supplementary Data 4–6 for a complete summary of univariable and multivariable Cox proportional hazard regression model statistics, per-endpoint event rates, and summary of missing clinical data per initiating line of therapy. Correction for multiple hypothesis testing was not performed. REF reference.
Fig. 5
Fig. 5. Workflow for optimized clinical biomarker profiling for mCRPC incorporating ctDNA testing.
The ctDNA prediction tool (available at http://ctDNA.org) can be used to inform optimal strategy for mCRPC genomic biomarker testing, offering guidance as to whether to pursue ctDNA or tissue-based genotyping (in resource-limited circumstances where both testing modalities cannot be pursued simultaneously). Tissue-based genotyping should be initiated for patients with low predicted ctDNA%. However, ctDNA testing also offers valuable prognostic information (via ctDNA%) regardless of ctDNA%-sufficiency for sensitive genotyping, and therefore should be offered to patients if available as a prognostic adjunct (potentially in tandem with tissue-based genotyping). The tool’s output includes the probability of a sample having ctDNA ≥ 2% and a point estimate of predicted plasma ctDNA%. Finally, the ctDNA%-prediction tool is flexible to any combination of missing data as well as differences in laboratory reference range values for lactate dehydrogenase and alkaline phosphatase.

References

    1. Sung, H. et al. Global cancer statistics 2020: GLOBOCAN estimates of incidence and mortality worldwide for 36 cancers in 185 countries. CA Cancer J. Clin.71, 209–249 (2021). - PubMed
    1. Swami U, McFarland TR, Nussenzveig R, Agarwal N. Advanced prostate cancer: treatment advances and future directions. Trends Cancer Res. 2020;6:702–715. doi: 10.1016/j.trecan.2020.04.010. - DOI - PubMed
    1. Smaletz O, et al. Nomogram for overall survival of patients with progressive metastatic prostate cancer after castration. J. Clin. Oncol. 2002;20:3972–3982. doi: 10.1200/JCO.2002.11.021. - DOI - PubMed
    1. Halabi S, et al. Updated prognostic model for predicting overall survival in first-line chemotherapy for patients with metastatic castration-resistant prostate cancer. J. Clin. Oncol. 2014;32:671–677. doi: 10.1200/JCO.2013.52.3696. - DOI - PMC - PubMed
    1. Armstrong AJ, Garrett-Mayer E, de Wit R, Tannock I, Eisenberger M. Prediction of survival following first-line chemotherapy in men with castration-resistant metastatic prostate cancer. Clin. Cancer Res. 2010;16:203–211. doi: 10.1158/1078-0432.CCR-09-2514. - DOI - PubMed

Substances