. 2024 Mar;627(8003):416-423.
doi: 10.1038/s41586-024-07087-8. Epub 2024 Feb 28.

Durable and efficient gene silencing in vivo by hit-and-run epigenome editing

Affiliations

Durable and efficient gene silencing in vivo by hit-and-run epigenome editing

Martino Alfredo Cappelluti et al. Nature. 2024 Mar.

Abstract

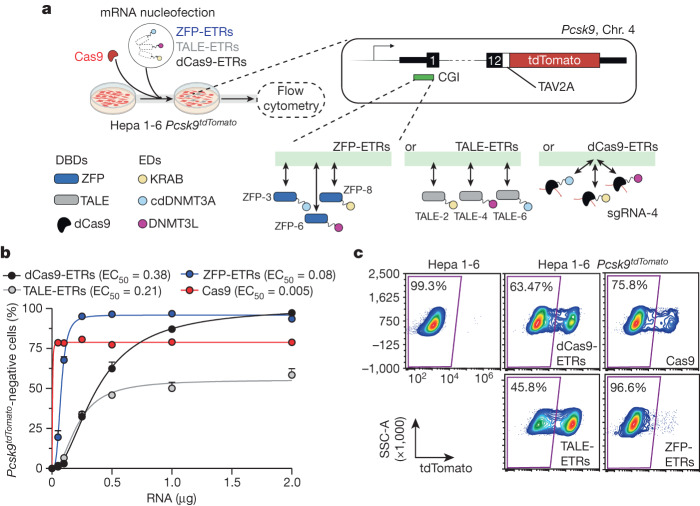
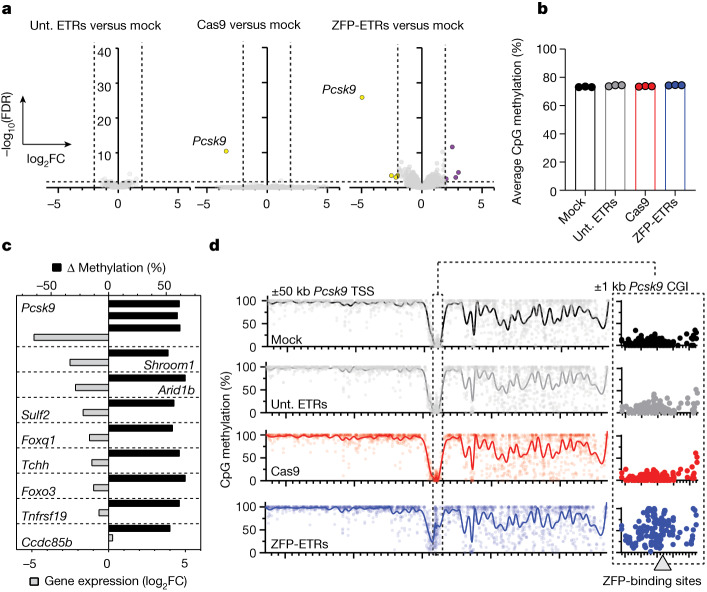
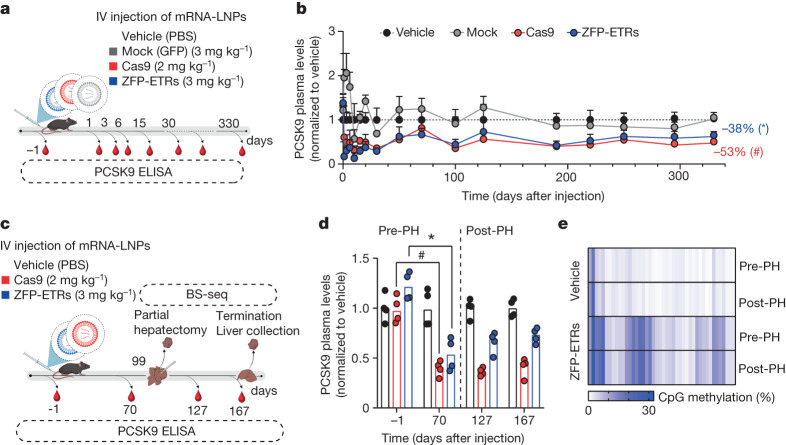
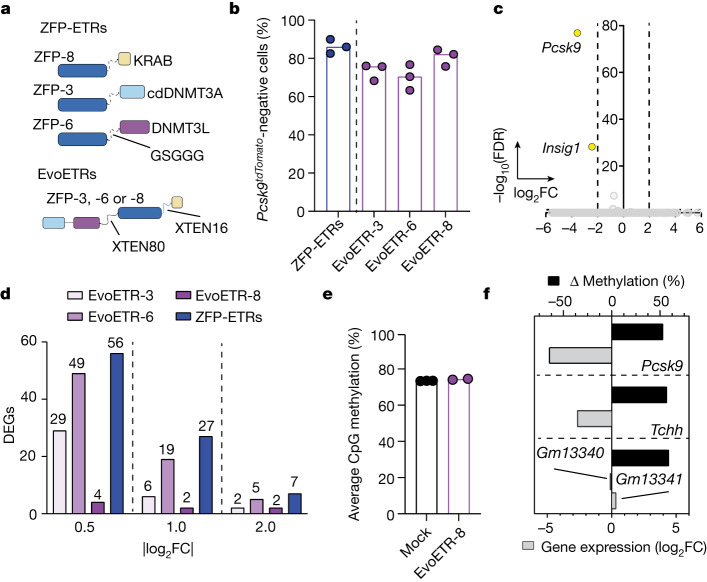
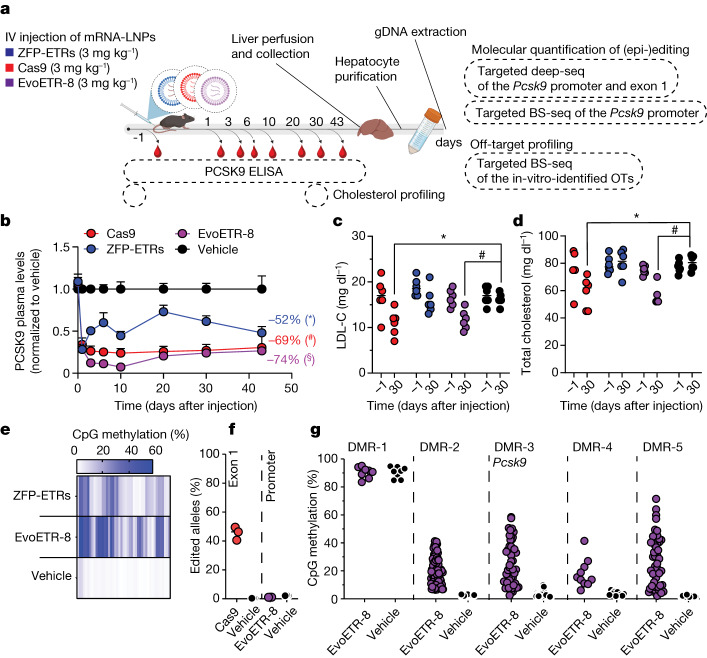
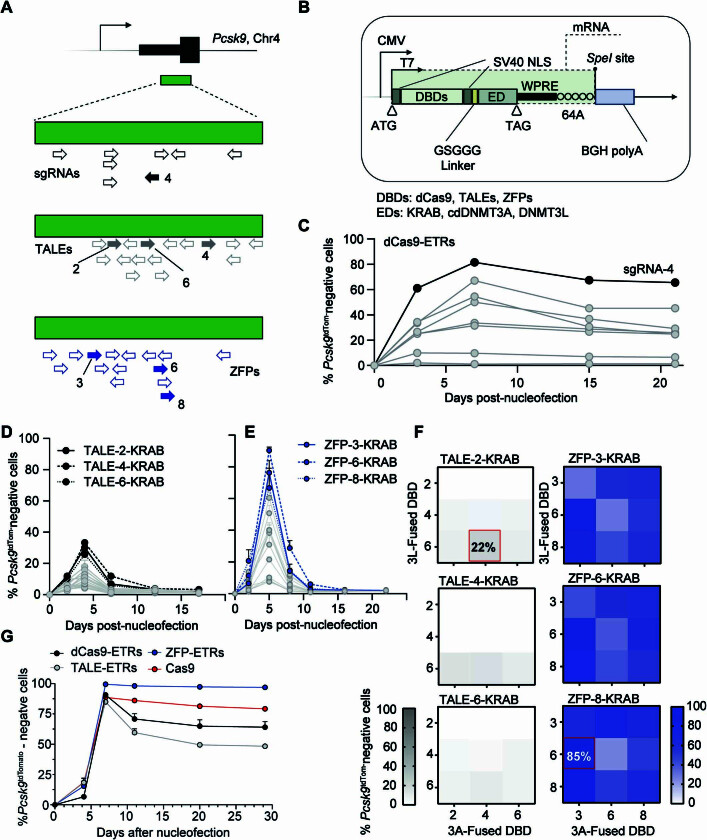
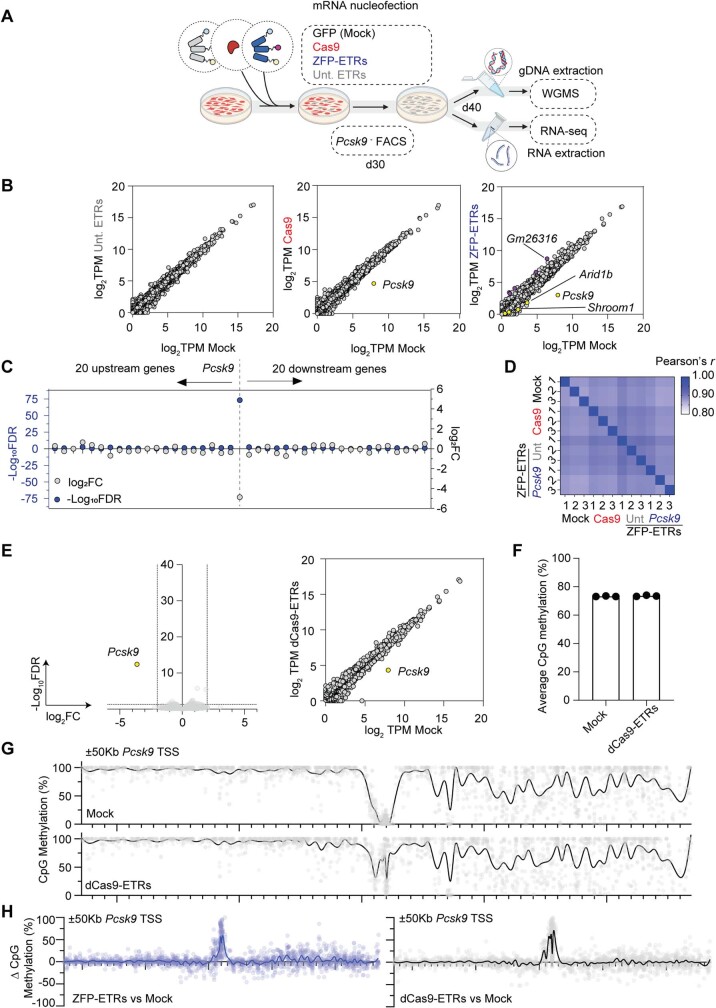
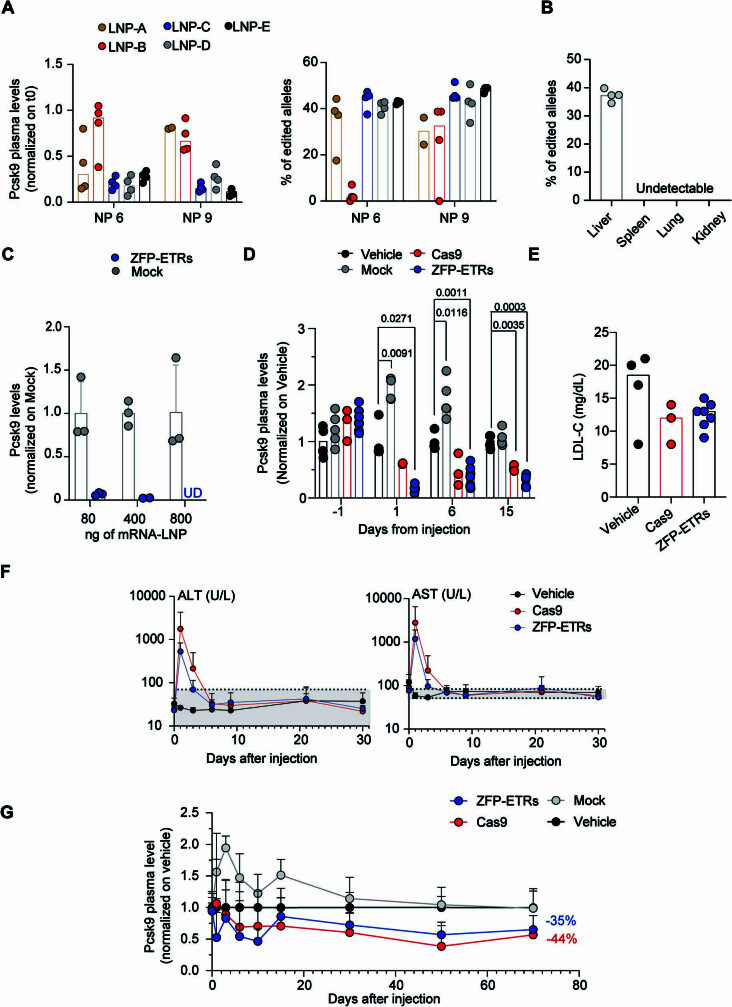
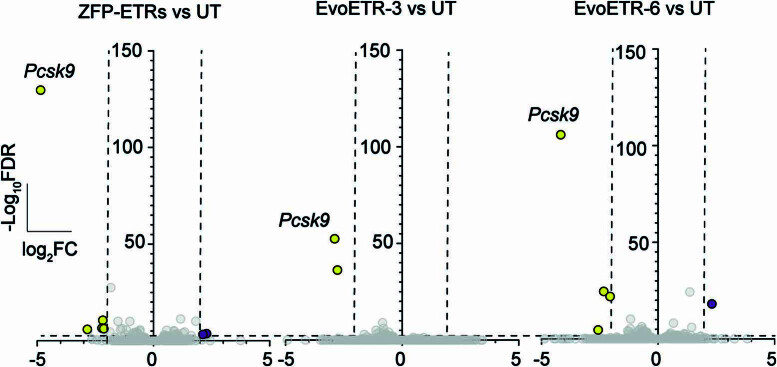
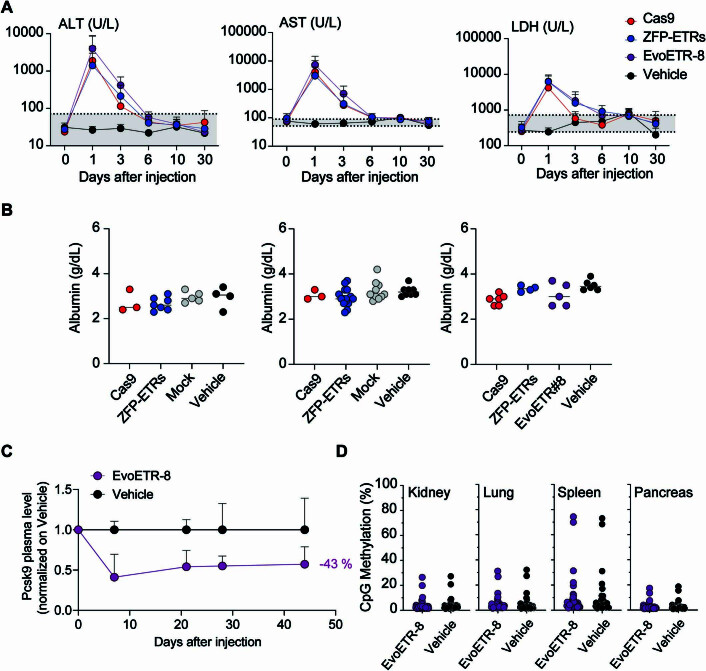
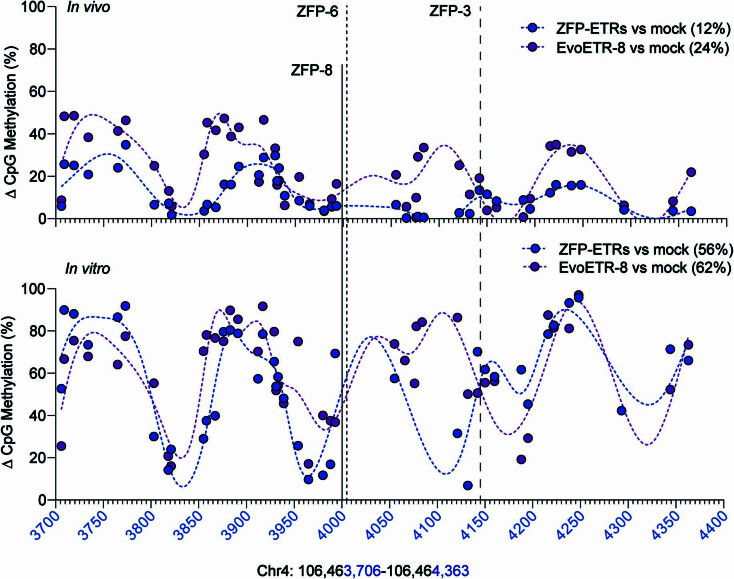
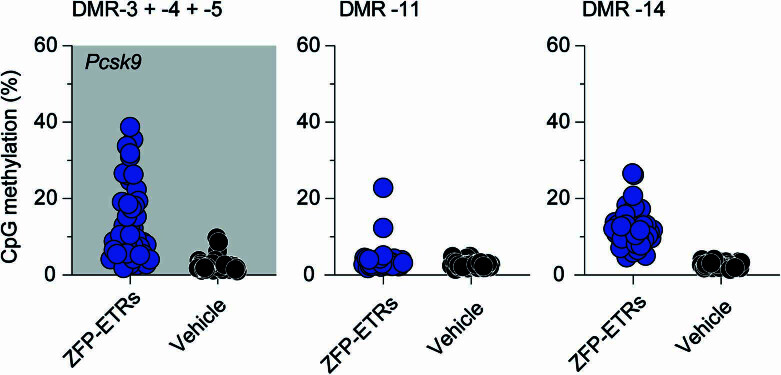
Permanent epigenetic silencing using programmable editors equipped with transcriptional repressors holds great promise for the treatment of human diseases1-3. However, to unlock its full therapeutic potential, an experimental confirmation of durable epigenetic silencing after the delivery of transient delivery of editors in vivo is needed. To this end, here we targeted Pcsk9, a gene expressed in hepatocytes that is involved in cholesterol homeostasis. In vitro screening of different editor designs indicated that zinc-finger proteins were the best-performing DNA-binding platform for efficient silencing of mouse Pcsk9. A single administration of lipid nanoparticles loaded with the editors' mRNAs almost halved the circulating levels of PCSK9 for nearly one year in mice. Notably, Pcsk9 silencing and accompanying epigenetic repressive marks also persisted after forced liver regeneration, further corroborating the heritability of the newly installed epigenetic state. Improvements in construct design resulted in the development of an all-in-one configuration that we term evolved engineered transcriptional repressor (EvoETR). This design, which is characterized by a high specificity profile, further reduced the circulating levels of PCSK9 in mice with an efficiency comparable with that obtained through conventional gene editing, but without causing DNA breaks. Our study lays the foundation for the development of in vivo therapeutics that are based on epigenetic silencing.


Conflict of interest statement

A.L. is a co-founder of, quota holder of and consultant for Chroma Medicine, a company aiming to develop epi-editing applications. A.L. and M.A.C. are inventors on pending and issued patents related to epi-silencing filed by the San Raffaele Scientific Institute and Telethon Foundation, or Chroma Medicine. The remaining authors declare no competing interests.

Figures

Fig. 1
Fig. 1. In vitro screen in Hepa 1-6 Pcsk9tdTomato cells identifies ZFP-based ETRs as the most effective platform for epi-silencing of Pcsk9.
a, Top left, diagram of the experimental procedure used to compare the efficiency of different ETR platforms in the Hepa 1-6 Pcsk9tdTomato cell line. mRNA nucleofection was used to deliver the ETRs into the cells. As an editing control, cells were co-transfected with mRNA encoding for Cas9 and a gRNA targeting the first exon of Pcsk9. Top right, schematic representation of the Hepa 1-6 Pcsk9tdTomato cell line, in which a TAV2A-tdTomato cassette was targeted in-frame into the last exon of Pcsk9. TAV2A denotes a self-cleaving peptide derived from the Thosea asigna virus. Bottom right, schematic of the different ETR platforms showing their relative binding to the CGI of Pcsk9 encompassing its promoter region. Double-headed arrows indicate dynamic binding of the different ETRs to their genomic target sites. The dCas9-based ETRs bind to the same target site, which is dictated by sgRNA-4. Bottom left, key for the pictograms used in the top left diagram. Created with BioRender.com. b, Dot plot analysis showing the percentage of Pcsk9tdTomato-negative cells at day 13 after the delivery of ascending doses of mRNAs encoding dCas9-, TALE- and ZFP-based ETRs, and Cas9. Data are mean ± s.d. (n = 3). The half-maximum effective concentration (EC50) for each editing platform is indicated, as calculated by fitting a four-parameter logistic model (R2 > 0.98 for all treatments). c, Representative flow cytometry dot plots of Hepa 1-6 and Hepa 1-6 Pcsk9tdTomato cells, the latter analysed at day 29 after RNA nucleofection of the indicated constructs. Data are from Extended Data Fig. 1g. SSC-A, side scatter area. Source data
Fig. 2
Fig. 2. Target-specific transcriptional downregulation with minimal off-target perturbations after epi-silencing of Pcsk9 by ZFP-based ETRs.
a, Volcano plots from RNA-seq analyses showing differential gene expression between mock-treated cells and cells treated with untargeted ETRs (unt. ETRs; left), Cas9 (middle) or ZFP-ETRs (right) (n = 3 for each experimental condition). The Wald test for binomial distributions was applied for differential gene-expression analysis and P values were corrected for multiple testing using the Benjamini–Hochberg approach. The horizontal dashed line indicates the threshold on the adjusted P value (FDR ≤ 0.05), and the vertical dashed lines correspond to the threshold on |log2FC| ≥ 2. Upregulated genes are in purple and downregulated ones are in yellow. Genes in grey are not differentially expressed according to the applied thresholds. b, Bar plot showing the genome-wide levels of CpG methylation of the indicated samples as calculated from the WGMS analyses (n = 3 for each experimental condition). c, Bar plot showing the correlation between differential methylation and variation in gene expression for the comparison of ZFP-ETRs versus mock. DMRs were associated with a given gene when falling into a ±10-kb window around its own TSS. Plotted are genes for which the |log2FC| and FDR can be computed from the differential expression analysis. Black bars indicate the variation in the percentage of CpG methylation of the indicated DMRs. d, Left, Manhattan plot from the WGMS in b showing the CpG methylation profiles of the indicated samples in a ±50-kb genomic region centred on the TSS of Pcks9. Individual dots indicate the average methylation of each CpG. Connecting lines were defined as smoothing spline with 100 knots. Right, magnified view of a ±1-kb region centred on the Pcsk9 CGI. The genomic region containing the ZFP-binding sites (3, 6 and 8) is indicated in the graph as a grey rectangle. Source data
Fig. 3
Fig. 3. Durable epigenetic silencing of Pcsk9 in mouse liver after LNP-mediated delivery of ZFP-ETRs.
a, Drawing of the experimental procedure that was used to assess the efficacy and durability of Pcsk9 editing in vivo. LNP D was loaded with mRNAs of ZFP-ETRs, Cas9 or eGFP and injected intravenously (IV). Before and after LNP injection, blood samples were collected to measure the levels of PCSK9 by ELISA. LNP doses are indicated as milligrams per kilogram. Vehicle, PBS-treated mice. Created with BioRender.com. b, Time-course analysis of circulating PCSK9 levels for up to 330 days after LNP injection. Data are mean ± s.d. (n = 7 for ZFP-ETR-treated, 3 for Cas9-treated, 5 for mock-treated and 4 for vehicle-injected mice). Statistical analysis by two-way repeated-measures (RM) ANOVA and Dunnett’s multiple comparisons test between vehicle and the other treatment conditions at the latest time point of analysis (*P = 0.0003 and #P = 0.0272). If not indicated, differences were not statistically significant. c, Drawing of the experimental procedure that was used to assess editing durability after partial hepatectomy. BS-seq, targeted bisulfite sequencing. Created with BioRender.com. d, Bar plot showing the levels of PCSK9 before and after partial hepatectomy (PH). Data for individual mice are normalized to the mean of vehicle-treated mice (dots); bars indicate the median (n = 4 for each experimental group). Statistical analysis by two-way RM ANOVA and Dunnett’s multiple comparisons test was performed among samples belonging to the same treatment (mock, ZFP-ETRs and Cas9) at different times (*P = 0.0148 and #P = 0.0040). If not indicated, differences were not statistically significant. e, Heat map showing the average methylation at single-CpG resolution within the Pcsk9 CGI in treated (ZFP-ETRs) and control (vehicle) samples before and after the partial hepatectomy. Colour intensity refers to the percentage of CpG methylation (mean of n = 4 for each experimental group). Each rectangle represents an individual CpG in the genomic region Chr. 4: 106,463,706–106,464,363. Source data
Fig. 4
Fig. 4. In vitro efficacy and specificity profiling of EvoETRs.
a, Schematic representation of the molecular architecture of ZFP-ETRs and EvoETRs. Created with BioRender.com. b, Bar plot showing the percentage of Pcsk9-silenced cells at day 40 after the delivery of either ZFP-ETRs (blue) or EvoETRs (purple). Dots represent individual percentages; bars represent the median for each treatment (n = 3). c, Volcano plot from RNA-seq analyses showing differential gene expression between EvoETR-8-treated and untreated cells (n = 2). The Wald test for binomial distributions was applied for differential gene expression analysis and P values were corrected for multiple testing using the Benjamini–Hochberg approach. Dashed lines indicate the thresholds on adjusted P values (FDR ≤ 0.05) and fold change (|log2FC| ≥ 2). Downregulated genes are in yellow. Genes in grey are not differentially expressed according to the applied thresholds. d, Bar plot showing the number of DEGs from the indicated samples versus untreated cells. These analyses were performed at three different |log2FC| thresholds and at FDR ≤ 0.05. e, Bar plot showing the genome-wide levels of CpG methylation of the indicated samples as calculated from the WGMS analyses (n = 3 for mock-treated and n = 2 for EvoETR-8-treated cells). f, Bar plot showing the correlation between differential methylation and variation in gene expression for the comparison EvoETR-8 versus mock. DMRs were associated with a given gene when falling into a ±10-kb window around its own TSS. Plotted are genes for which the log2FC and FDR can be computed from the differential expression analysis. Black bars indicate the variation in the average methylation levels of the DMRs. Source data
Fig. 5
Fig. 5. Improved epi-silencing of Pcsk9 in vivo after LNP-mediated delivery of EvoETR-8.
a, Schematic drawing of the experimental procedures. LNPs were loaded with mRNAs encoding ZFP-ETRs, Cas9 or EvoETR-8 and separately injected intravenously into mice. Vehicle, PBS-treated mice. Before and after LNP injection, blood samples were collected to measure the circulating levels of PCSK9 and cholesterol. Genomic DNA (gDNA) from purified hepatocytes at day 43 after injection was analysed to measure the efficiency of genetic or epigenetic editing at Pcsk9 by targeted deep sequencing (deep-seq) or BS-seq, respectively. DNA methylation levels were also quantified by targeted BS-seq of in-vitro-identified DMRs. OTs: off targets. Created with BioRender.com. b, Time course of the levels of circulating PCSK9 up to 43 days aftr LNP injection. Data are mean ± s.d. (n = 6). Statistical analysis by two-way RM ANOVA and Dunnett’s multiple comparisons test between vehicle and the other treatment conditions at the latest time point (*P = 0.0451, #P = 0.0117 and §P = 0.0118). If not indicated, differences were not statistically significant. c,d, Dot plots showing the levels of LDL-C (c) and total cholesterol (d) in mice 30 days after the treatments (n = 6). Dots represent individual mice; lines represent the median for each group. Statistical analysis by two-way RM ANOVA and Dunnett’s multiple comparisons test (*P = 0.0025 and #P = 0.0090 for LDL-C; *P = 0.0001 and #P < 0.0001 for total cholesterol). If not indicated, differences were not statistically significant. e, Heat map showing the average methylation of single CpGs within the Pcsk9 CGI of treated (ZFP-ETRs and EvoETR-8) and control (vehicle) mice. Colour intensity refers to the percentage of methylation (n = 3). Each rectangle represents an individual CpG in the genomic region Chr. 4: 106,463,706–106,464,363. f, Dot plot showing the percentage of edited alleles. Data are reported as percentages of individual mice (dots) and medians (lines). The percentage of edited alleles was measured in Pcsk9 exon 1 for Cas9- and vehicle-treated mice, and in the Pcsk9 promoter for EvoETR-8- and vehicle-treated mice (n = 3). g, Dot plots showing the percentage of in vivo methylation in EvoETR-8- and vehicle-treated mice by targeted BS-seq. Five genomic sites were interrogated, corresponding to the five DMRs that were identified in vitro from the comparison EvoETR-8 versus mock. Each dot represents a single CpG in the indicated DMR (mean of n = 3). The plot showing the Pcsk9-associated DMR (DMR-3) is a reanalysis of the data in e and was included here as reference for on-target methylation. Source data
Extended Data Fig. 1
Extended Data Fig. 1. In vitro selection of the most effective ETRs for Pcsk9 silencing.
a, Schematic drawing showing on top the Pcsk9 promoter region with the annotated CpG Island (CGI) and, on the bottom, a zoom on the CGI showing the target sites of all the tested single guide RNAs (sgRNAs; black arrows), TALEs (grey arrows), and ZFPs (blue arrows). Filled arrows indicate the most active sgRNA/DBDs used for subsequent experiments. Created with BioRender.com. b, Schematic representation of the plasmid used for ETR expression, either after its direct transfection into cells or as a template for In Vitro Transcription (IVT) of the ETRs’ mRNA. CMV: enhancer/promoter of the Cytomegalovirus. T7: promoter for mRNA production. ATG: start codon; DBDs: DNA-binding domains; SV40 NLS: nuclear localization signal of the simian virus 40; GSGGG: glycine-rich liker peptide; ED: effector domain, either KRAB from the ZNF10 protein, cdDNMT3A or DNMT3L; WPRE: woodchuck hepatitis virus post-transcriptional regulatory element; 64A: stretch of 64 adenines; SpeI: restriction site used to linearize the plasmid for IVT; BGH polyA: polyadenylation signal from the bovine growth hormone gene. Created with BioRender.com. c, Dot plot showing the percentage of Pcsk9tdTomato-negative cells over a period of 22 days post-delivery of plasmids encoding for the indicated dCas9-based ETRs and 8 different sgRNAs. sgRNA-4 was the most active among the tested guides (black dots and connecting line) and thus used for subsequent experiments. Data are reported as mean (n = 2). d, Dot plot showing the percentage of Pcsk9tdTomato-negative cells over a period of 17 days post-delivery of plasmids encoding for 16 different TALE DBDs fused to the KRAB domain. This experiment was meant to identify the most effective TALEs among those tested, using KRAB-mediated epi-silencing of Pcsk9 as a surrogate readout for DBD efficiency. TALE-2, -4 and -6 were the most active ones among those tested (black dots and connecting line) and thus used for subsequent experiments. Data are reported as mean ± s.d. (n = 4). e, Dot plot showing the percentage of Pcsk9tdTomato-negative cells over a period of 22 days post-delivery of plasmids encoding for 16 different ZFP DBDs fused to the KRAB domain. This experiment was meant to identify the most effective ZFPs among those tested, using KRAB-mediated epi-silencing of Pcsk9 as a surrogate readout for DBD efficiency. ZFP-3, -6 and -8 were the most active ones among those tested (blue dots and connecting line) and thus used for subsequent experiments. Data are reported as mean ± s.d. (n = 4). f, Left: heat maps showing the percentage of Pcsk9tdTomato-negative cells at day 7 post-delivery of combinations of plasmids encoding for KRAB-, DNMT3L and cDNMT3A-based ETRs containing TALEs. The matrixes were built by transfecting either one of the TALE-KRAB ETRs from d with all possible combinations of the three best-performing TALE DBDs (namely, 3, 6 and 8) fused to either DNMT3L (y axis) or cdDNMT3A (x axis). Given its highest performance, the triple-ETR combination containing TALE-2-KRAB, TALE-6-DNMT3L, and TALE-4-cDNMT3A was chosen for further studies. Colour intensity refers to average silencing efficiency (n = 2). Right: similar experiment as in left but performed with the three best-performing ZFPs from e. Given its highest activity, the triple-ETR combination containing ZFP-8-KRAB, ZFP-6-DNMT3L and ZFP-3-cDNMT3A was chosen for further studies. Colour intensity refers to average silencing efficiency (n = 3). Best-performing triple combinations of TALE- and ZFP-ETRs are indicated with a red square. g, Time-course analysis of Pcsk9tdTomato-negative cells from the 0.5 µg RNA treatment conditions in Fig. 1b of the main text. Data are reported as mean ± s.d. Source data
Extended Data Fig. 2
Extended Data Fig. 2. Specificity assessment of ZFP- and dCas9-based ETRs.
a, Schematic drawing showing experimental procedures for in vitro specificity profile of ETRs. Created with BioRender.com. b, Scatter plots from RNA-seq analyses comparing the gene expression levels between mock and either untargeted ETRs (Unt. ETRs; left), Cas9 (middle) or ZFP-ETR (right) treated cells. Purple and yellow dots indicate genes significantly up- and downregulated, respectively; grey dots indicate genes considered not differentially expressed. Thresholds were set at FDR ≤ 0.05 and |log2FC| ≥ 2. Data are expressed as log2 of transcript count per million (TPM) of mapped reads. c, Differential gene expression analysis of 20 genes either up- or downstream of Pcsk9 from RNA-seq analysis. d, Heat map of Pearson’s correlation among WGMS replicates calculated using the cor function after filtering by the coverage, normalizing and considering the positions shared by all the replicates in each condition. Values are reported for each replicate (1, 2 and 3) in each condition. e, Volcano plot (right) and scatter plot (left) from RNA-seq analyses showing differential gene expression between mock and dCas9-ETR-treated cells (n = 3). Yellow dots indicate genes significantly downregulated; grey dots indicate genes considered not differentially expressed. Thresholds were set at FDR ≤ 0.05 and |log2FC| ≥ 2. For the scatter plot, data are expressed as log2 of transcript count per million (TPM) of mapped reads. f, Bar plot showing the genome-wide levels of CpG methylation of the indicated samples as calculated from the WGMS analyses (n = 3 technical replicates). g, Manhattan plot from WGMS showing the CpG methylation profiles of the indicated samples in a ±50-kb genomic region centred on the TSS of Pcks9. Individual dots indicate the average methylation of each CpG. Connecting lines were defined as smoothing spline with 100 knots. h, Manhattan plot from WGMS showing differential methylation of CpGs in a ±50-kb genomic region centred on the TSS of Pcks9 between the indicated samples and mock-treated cells. Individual dots show the differential methylation between the indicated samples at each CpG site. Connecting lines were defined as smoothing spline with 100 knots. Source data
Extended Data Fig. 3
Extended Data Fig. 3. Editing of Pcsk9 in mice.
a, Bar plots showing the circulating levels of Pcsk9 (left) and percentage of edited alleles (right) at day 7 post-injection of the indicated LNP formulations encapsulated with Cas9-encoding mRNA and a sgRNA targeting the first exon of Pcsk9 (n = 4 for each group). Treatments with LNP A (NP ratio 9) and LNP-E (NP ratio 9) resulted in 2 and 1 death, respectively. Dots: data from individual mice normalized to pre-treatment levels. Bars: median for each group. b, Bar plot showing the percentage of Pcsk9 edited alleles from different organs of mice treated with LNP D (NP ratio 6) encapsulated with Cas9-encoding mRNA and a sgRNA targeting the first exon of Pcsk9. Dots: data from individual mice (n = 4). Bars: median for each group. c, Bar plot showing levels of Pcsk9 in the supernatants of mouse hepatocytes after transfection of three different doses of mRNAs encoding for either ZFP-ETRs or eGFP (mock). Pcsk9 levels for each replicate and each group were normalized to the mean of the mock at the same dose. Data from individual replicates are reported as dots; bars indicate average values (n = 3, mean ± s.d.). UD: undetectable. d, Bar plot showing the levels of Pcsk9 in the plasma of mice treated as indicated in Fig. 3a,b of the main text. Data for individual mice (dots) are reported as normalized to the mean of vehicle-treated mice. Bars indicate the median for any conditions. Data are reported as mean ± s.d. (n = 7 for ZFP-ETR-, 3 for Cas9-, 5 for mock- and 4 for vehicle-injected mice).Statistical analysis by two-way RM ANOVA and Dunnett’s multiple comparisons test between vehicle and the other treatment conditions at the lates time point of analysis; P values are reported in the figure. If not indicated, differences were not statistically significant. e, Bar plots showing the circulating levels of LDL-C in mice 30 days after the indicated treatments (n = 7 for ZFP-ETR-, 3 for Cas9-, 5 for mock- and 4 for vehicle-injected mice). Dots: individual mice. Bars: median level for each group. f, Time course of transaminases (ALT and AST) until day 30 post-treatment. Data are reported as the mean ± s.d. of U/L of plasma (n = 6 for any groups). Grey area indicates physiological levels. g, Time course of circulating Pcsk9 until day 70 post-treatment. Data are reported as the mean ± s.d. and normalized to PCSK9 levels in vehicle-treated mice (n = 22 for ETR-, 7 for Cas9-, 16 for mock- and 15 for vehicle-injected mice). Source data
Extended Data Fig. 4
Extended Data Fig. 4. In vitro characterization of the specificity of EvoETRs.
Volcano plots from RNA-seq analyses showing differential gene expression between the indicated ETR-treated samples and untreated cells (n = 2). Purple and yellow dots indicate genes significantly up- and downregulated, respectively; grey dots indicate genes considered not differentially expressed. Thresholds were set at FDR ≤ 0.05 and |log2FC| ≥ 2 and are indicated in the graphs as dashed lines. Source data
Extended Data Fig. 5
Extended Data Fig. 5. Efficacy, biodistribution and liver toxicity of LNP-mediated delivery of ETRs.
a, Time-course analysis of plasma levels of ALT, AST and LDH after LNP-mediated delivery of mRNAs encoding for either Cas9, ZFP-ETRs, or EvoETR-8. Data are reported as mean ± s.d. (n = 6). b, Quantification of circulating albumin at the last time point analysed. Data are reported as individual values (dots) and medians (lines). Left: experiment in Fig. 3b, 330 days post-injection; centre: experiment in Extended Data Fig. 3g, 70 days post-injection; right: experiment in Fig. 5b, 43 days post-injection. c, Time course of circulating Pcsk9 until day 44 post-injection of GenVoy-LNPs encapsulating the mRNA of EvoETR-8. Data are reported as mean ± s.d. and normalized to the PCSK9 levels of vehicle-treated mice (n = 5 for EvoETR-8- and 2 for vehicle-injected mice). d, Dot plots showing the percentage of CpG methylation at the Pcsk9 promoter in the indicated organs from EvoETR-8- and vehicle-treated mice. Each dot represents a single CpG (mean of n = 3). Source data
Extended Data Fig. 6
Extended Data Fig. 6. CpG methylation profiles at Pcsk9 in vivo and in vitro.
Dot plots reporting the delta methylation between either ZFP-ETR- or EvoETR-8-treated samples versus untreated controls. Individual dots indicate the average delta methylation of each CpG in the genomic region Chr.4: 106,463,706–106,464,363. Connecting lines were defined as smoothing spline with 20 knots. Mean delta methylation throughout the entire windows for each sample are reported in brackets. Top: replotting of the targeted BS-seq data of Fig. 5e. Bottom: replotting of the WGMS analysis of Fig. 4e,f (for EvoETR-8) and Fig. 2d for ZFP-ETRs. Positions of ZFP-binding sites are indicated as continuous (ZFP-8) or dashed (ZFP-6 and ZFP-3) lines. Source data
Extended Data Fig. 7
Extended Data Fig. 7. In vivo methylation profile of the top three DMRs identified in vitro from the ZFP-ETRs versus mock comparison.
Dot plots reporting the percentage of in vivo methylation at single-CpG resolution in ZFP-ETR- and vehicle-treated mice by targeted BS-seq. Two genomic sites were interrogated corresponding to the top two DMRs identified in vitro from the ZFP-ETRs versus mock comparison. DMR-3, -4 and -5 were identified in vitro as associated with the Pcsk9 promoter region. The in vivo methylation levels of these DMRs were quantified producing a single PCR including all the three DMRs. Each dot represents a single CpG in the indicated DMRs (mean of n = 3 for each experimental group). Source data

Comment in

References

    1. Sgro A, Blancafort P. Epigenome engineering: new technologies for precision medicine. Nucleic Acids Res. 2020;48:12453–12482. doi: 10.1093/nar/gkaa1000. - DOI - PMC - PubMed
    1. Ueda J, Yamazaki T, Funakoshi H. Toward the development of epigenome editing-based therapeutics: potentials and challenges. Int. J. Mol. Sci. 2023;24:4778. doi: 10.3390/ijms24054778. - DOI - PMC - PubMed
    1. Kungulovski G, Jeltsch A. Epigenome editing: state of the art, concepts, and perspectives. Trends Genet. 2016;32:101–113. doi: 10.1016/j.tig.2015.12.001. - DOI - PubMed
    1. Nakamura M, Gao Y, Dominguez AA, Qi LS. CRISPR technologies for precise epigenome editing. Nat. Cell Biol. 2021;23:11–22. doi: 10.1038/s41556-020-00620-7. - DOI - PubMed
    1. Gilbert LA, et al. CRISPR-mediated modular RNA-guided regulation of transcription in eukaryotes. Cell. 2013;154:442. doi: 10.1016/j.cell.2013.06.044. - DOI - PMC - PubMed