. 2024 Mar;627(8004):636-645.
doi: 10.1038/s41586-024-07135-3. Epub 2024 Feb 28.

SOX17 enables immune evasion of early colorectal adenomas and cancers

Affiliations

SOX17 enables immune evasion of early colorectal adenomas and cancers

Norihiro Goto et al. Nature. 2024 Mar.

Abstract

A hallmark of cancer is the avoidance of immune destruction. This process has been primarily investigated in locally advanced or metastatic cancer1-3; however, much less is known about how pre-malignant or early invasive tumours evade immune detection. Here, to understand this process in early colorectal cancers (CRCs), we investigated how naive colon cancer organoids that were engineered in vitro to harbour Apc-null, KrasG12D and Trp53-null (AKP) mutations adapted to the in vivo native colonic environment. Comprehensive transcriptomic and chromatin analyses revealed that the endoderm-specifying transcription factor SOX17 became strongly upregulated in vivo. Notably, whereas SOX17 loss did not affect AKP organoid propagation in vitro, its loss markedly reduced the ability of AKP tumours to persist in vivo. The small fraction of SOX17-null tumours that grew displayed notable interferon-γ (IFNγ)-producing effector-like CD8+ T cell infiltrates in contrast to the immune-suppressive microenvironment in wild-type counterparts. Mechanistically, in both endogenous Apc-null pre-malignant adenomas and transplanted organoid-derived AKP CRCs, SOX17 suppresses the ability of tumour cells to sense and respond to IFNγ, preventing anti-tumour T cell responses. Finally, SOX17 engages a fetal intestinal programme that drives differentiation away from LGR5+ tumour cells to produce immune-evasive LGR5- tumour cells with lower expression of major histocompatibility complex class I (MHC-I). We propose that SOX17 is a transcription factor that is engaged during the early steps of colon cancer to orchestrate an immune-evasive programme that permits CRC initiation and progression.


Conflict of interest statement

Competing interests

Ö.H.Y. holds equity and is a SAB member in Ava Lifesciences and AI Proteins. Ö.H.Y. receives research support from Microbial Machines. Ö.H.Y. is a consultant for Nestle. T.J. is a member of the Board of Directors of Amgen and Thermo Fisher Scientific and a co-founder of Dragonfly Therapeutics and T2 Biosystems; serves on the Scientific Advisory Board of Dragonfly Therapeutics, SQZ Biotech, and Skyhawk Therapeutics; and is President of Break Through Cancer. T.J.’s laboratory currently receives funding from Johnson & Johnson and The Lustgarten Foundation, but these funds did not support the research described in this manuscript. None of the other authors have any conflicts to declare.

Figures
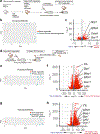
Extended Data Figure 1.
Extended Data Figure 1.. In vivo transplantation of naïve AKP organoids induces SOX17 expression.
a, Schematic of generation of mouse naïve AKP organoids by shApc and primary tumour-derived AKP organoids from immunocompetent mice by colonoscopy-based orthotopic transplantation. b, c, PCA plot (b) and volcano plot (c) of RNA-seq in naïve and primary tumour-derived AKP organoids (shApc model) from immunocompetent mice. n = 3–6 mice per group. d, Schematic of RNA-seq in bulk resected primary tumours as well as in flow cytometry-sorted tdTomato+ tumour cells that were freshly isolated from primary tumours. e, f, PCA plot (e) and volcano plot (f) of RNA-seq in naïve AKP organoids and bulk resected primary tumours. n = 3–6 mice per group. g, h, PCA plot (g) and volcano plot (h) of RNA-seq in naïve AKP organoids and flow cytometry-sorted tdTomato+ tumour cells that were freshly isolated from primary tumours. n = 3–4 mice per group.
Extended Data Figure 2.
Extended Data Figure 2.. Autochthonous tumours and transplanted tumours in immunodeficient mice show elevated SOX17 expression.
a, Autochthonous tumour models by colonoscopy-guided 4-OH-Tamoxifen injection into the colonic mucosa of Villin-CreERT2; Apc f/f; Kras LSL-G12D; P53 f/f; Rosa LSL-tdTomato (AKPVT) mice. b-d, PCA plot (b), volcano plot (c), and GSEA (d) of RNA-seq in normal colon and autochthonous AKPVT tumours. n = 4–7 mice per group. e, Schematic of generation of mouse naïve AKP organoids and mouse primary tumour-derived AKP organoids from immunodeficient mice (Rag2−/− mice) by colonoscopy-based orthotopic transplantation. f, g, PCA plot (f) and volcano plot (g) of RNA-seq in naïve and primary tumour-derived AKP organoids from immunodeficient mice. n = 3 mice per group.
Extended Data Figure 3.
Extended Data Figure 3.. Generation of human naive AKP organoids.
a, Schematic of generation of human naive AKP organoids by CRISPR-Cas9 editing. b, Representative image of human APC−/− organoids and Sanger sequencing result confirming the biallelic frameshift mutations in APC. c, Representative image of human APC−/−; P53−/− organoids and Sanger sequencing result confirming the biallelic frameshift mutations in TP53. d, e, Strategy to knock in a KRASG12D point mutation by homology directed repair (d), and PCR results confirming the correct homology directed repair (e). f, Representative image of human APC−/−; KRASG12D; P53−/− organoids and the Sanger sequencing result confirming the KRASG12D point mutation. g, Immunoblots for SOX17 in human naive AKP organoids and in vivo tumour-derived human AKP organoids.
Extended Data Figure 4.
Extended Data Figure 4.. SOX17 loss does not affect tumour growth/proliferation in immunodeficient mice.
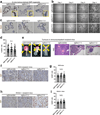
a, IHC for SOX17 in sgScramble, sgSox17–1, and sgSox17–2 in vivo tumour-derived AKP organoids. b, Time-course images of sgScramble, sgSox17–1, and sgSox17–2 AKP organoids. 2,000 single cells in 10 μl Matrigel were plated for each well. Representative of 10 wells. Representative of three independent experiments. See also Fig. 2c for organoid growth curve. c, d, IHC for BrdU (c) and the percentage of BrdU+ cells (d) in sgScramble, sgSox17–1, and sgSox17–2 AKP organoids that were incubated for 4 hrs with 10 μM BrdU in the culture media. n = 30 organoids per group. e, Representative images and H&E staining of orthotopically transplanted sgScramble, sgSox17–1, and sgSox17–2 AKP tumours in immunocompetent mice. f, g, IHC for Ki67 (f) and quantification (g) in orthotopically transplanted sgScramble, sgSox17–1, and sgSox17–2 AKP tumours in NCG mice. n = 20 fields from 5 mice per group. h, i, IHC for Ki67 (h) and quantification (i) in orthotopically transplanted sgScramble, sgSox17–1, and sgSox17–2 AKP tumours in Rag2−/− mice. n = 20 fields from 5 mice per group. One-way ANOVA (d, g, i). Data are mean ± SD. N.S. not significant. Scale bar, 20 μm (a, c, f, h), 1000 μm (b), 500 μm (e)
Extended Data Figure 5.
Extended Data Figure 5.. Sox17 knockdown in established AKP tumours inhibits tumour growth.
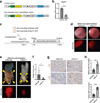
a, Constructs for Sox17 knockdown and control. b, qRT-PCR for Sox17 mRNA expression 48hr after doxycycline administration. n = 3 organoid culture wells per group. c, Schematic of Sox17 knockdown in established AKP tumours using doxycycline-inducible system. d, Tumour formation was confirmed by colonoscopy 1 week after the transplantation. e, f, Representative images (e) and tumour size (f) 2 weeks after doxycycline administration. n = 15 mice per group. Pooled from three independent experiments. g, h, IHC for CD4 and CD8 (g) and quantification (h) in control (shRenilla) and Sox17 knockdown (shSox17) tumours. n = 20 fields from 5 mice per group. Unpaired two-tailed t-tests (b, f, h). Data are mean ± SD. *p < 0.05. Scale bar, 20 μm (g).
Extended Data Figure 6.
Extended Data Figure 6.. Time-course analysis of scRNA-seq of immune cells in control and SOX17-null tumours.
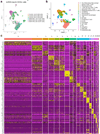
a, b, UMAP plots of CD45+ cells in control and SOX17KO AKP tumours at 1-, 2- and 4-weeks post-transplantation. Classified by sample groups (a) and cell clusters (b). Control at 1 wk; n = 5,296 cells, control at 2 wks; n = 4,585 cells, control at 4 wks; n = 6,230 cells, SOX17KO at 1 wk; n = 7,047 cells, SOX17KO at 2 wks; n = 2,894 cells, SOX17KO at 4 wks; n = 6,207 cells, pooled from 5 mice in each group. c, Expressions of key genes used for identification of major populations in the scRNA-seq analysis of control and SOX17KO tumours.
Extended Data Figure 7.
Extended Data Figure 7.. SOX17 alters CD4+ T cell subsets in AKP CRCs
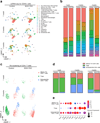
a, b, Time-course analysis of CD45+ cells in control and SOX17KO AKP tumours at 1-, 2- and 4-weeks post-transplantation by scRNA-seq. UMAP plots (a). Bar graphs showing % of each subcluster (b). c-e, UMAP plots (c) of re-clustering of CD4+ T cell clusters (clusters 5 and 9 in Extended Data Fig. 7b). Bar graphs showing % of each subcluster (d). Dot plots of gene expressions in each subcluster (e).
Extended Data Figure 8.
Extended Data Figure 8.. Effector Th1 CD4+ T cells contribute to the elimination of SOX17-null tumours.
a-c, IHC for SOX17 (a) and CD4 (b) and quantification (c) in sgScramble, sgSox17–1, and sgSox17–2 AKP tumours at 1-, 2- and 4-weeks post-transplantation. n = 20 fields from 5 mice per group. d, Violin plot for Ifng expression in scRNA-seq data from Extended Data Figure 6a. e-g, Schematic (e), representative images (f), and tumour engraftment rate (g) of orthotopically transplanted SOX17KO (sgSox17–1 and sgSOX17–2) AKP tumours in isotype control- and anti-CD4 antibody-treated mice. n=10 mice per group. Pooled from two independent experiments. h, SOX17-null tumour size in anti-CD4 antibody and anti-CD8 antibody-treated mice. n= 9–10 mice per group. Pooled from two independent experiments. i, j, IHC for CD8 (i) and quantification (j) in isotype control- and anti-CD4 antibody-treated mice. n = 20 fields from 5 mice. One-way ANOVA (c). Fisher’s exact test (g). Unpaired two-tailed t-tests (h, j). Data are mean ± SD. *p < 0.05. Scale bar, 25 μm (a), 20 μm (b, i).
Extended Data Figure 9.
Extended Data Figure 9.. SOX17 expression augments the resistance of colon cancer cells to CD8+ T cell-mediated killing.
a-b, Sanger sequencing chromatograms and TIDE analyses for sgH2k1 clones (a) and sgB2m clones (b). c-e, Schematic (c), representative images (d), and tumour engraftment rate (e) of orthotopic transplantation of SOX17KO (sgSox17–1); sgScramble, SOX17KO; H2K1 KO (sgH2k1 clone 3), and SOX17KO; B2M KO (sgB2m clone 23) AKP organoids into the colons of immunocompetent mice. n= 7–13 mice per group. f, Schematic of co-culture experiments of SOX17OE SIINFEKL-expressing colon cancer organoids with activated OT-1 T cells. g-i, Representative images (g), and quantification of organoids (h) and CD8+ T cell numbers (i) in the co-culture experiments. n = 3 per group. j, Ifnar1 and Ifnar2 expression by RNA-seq data of control and SOX17KO AKP organoids. n = 3 per group. k, l, Flow cytometry analysis of protein surface levels of IFNAR1 (k) and quantification (l). n = 3 per group. Chi-square test (e). Unpaired two-tailed t-tests (h, I, j). One-way ANOVA (l). Data are mean ± SD. *p < 0.05. N.S. not significant. Scale bar, 500 μm (h).
Extended Data Figure 10.
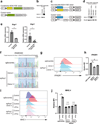
Extended Data Figure 10.. Generation of SOX17 overexpression organoids and IFNGR1 knockout organoids.
a, Constructs for constitutive SOX17 overexpression (SOX17OE). b, Immunoblots confirmed SOX17 overexpression in naïve AKP organoids transduced with a constitute SOX17OE cassette. c, Constructs for dox-inducible SOX17OE. d, Immunoblots confirmed SOX17 overexpression in naïve AKP organoids transduced with a dox-inducible SOX17OE cassette 72h after doxycycline administration. e, qRT-PCR for Ifngr1 mRNA expression in constitutive and dox-inducible SOX17OE AKP organoids compared with controls. n = 3–6 each group. f, Sanger sequencing chromatograms for IFNGR1KO clones. g, h, Flow cytometry (g) and quantification (h) of IFNGR1 expression. n = 3 per group. i, j, Flow cytometry (i) and quantification (j) of MHC-I expressions 24 hr after IFNγ (10 ng/ml) administration in the organoids. n = 3 per group. One-way ANOVA (h). Unpaired two-tailed t-test (j). Data are mean ± SD. N.S. not significant.
Extended Data Figure 11.
Extended Data Figure 11.. In vivo APC loss induces SOX17 expression.
a-c, Schematic (a), representative images (b), and tumour engraftment rate (c) of orthotopic transplantation of SOX17KO (sgSox17–1) and SOX17KO; CXCL10KO (sgCxcl10 clones 6 and 9) AKP organoids into immunocompetent recipient mice. n= 20 mice per group. Sanger sequencing results of CXCL10KO organoids are in Supplementary Fig. 4. d, IHC for SOX17 in Villin-CreERT2; Apc f/f mouse normal colon and adenoma. e, Schematic of generation of naïve and primary tumour-derived Apc−/− organoids. f, qRT-PCR for Sox17 mRNA expression in naïve and primary tumour-derived Apc−/− organoids. n = 3 mice per group. g, H&E staining and IHC for β-Catenin and SOX17 in Lgr5-CreERT2; Apc f/f and Lgr5-CreERT2; Apc f/f; Sox17 f/f mouse intestines after tamoxifen injections. Representative of n = 6 mice per group. h, Flow cytometry of MHC-I (H-2Kb) expression in Lgr5-GFP and Lgr5-GFP+ cells from Lgr5-CreERT2; Apc −/− adenoma. n = 4 mice. See Fig. 5i for quantification. Chi-square test (c). Unpaired two-tailed t-test (f). Data are mean ± SD. *p < 0.05. Scale bar, 20 μm (d, g).
Extended Data Figure 12.
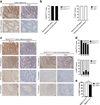
Extended Data Figure 12.. SOX17 expression in human adenomas and CRCs anti-correlates with CD8+ T cell infiltration.
a, b, Representative images (a) and classification (b) of IHC for SOX17 and CD8 in adenomas from patients with (n = 8) or without (n = 11) familial adenomatous polyposis (FAP). c-e, Representative images (c) and classification (d) of IHC for SOX17 and CD8 in CRC samples at different pathologic tumour stages (pT1: n = 9, pT2: n = 10, pT3: n = 10, pT4: n = 10). Plot (e) showing the % of CD8high tumours and CD8low tumours in SOX17high/med tumours versus SOX17low/neg tumours. n = 39 cases. Tumours were classified into SOX17high (≥70%), SOX17med (<70%, ≥30%), SOX17low (<30%, >0%), and SOX17neg (0%) based on the percentage of SOX17 nuclear staining-positive cells. Tumours with ≥ 50 CD8+ cells per x20 field were classified as CD8high tumours, < 50 CD8+ cells per x20 field as CD8low tumours. Scale bar, 20 μm (a, c). Fisher’s exact test (e). *p < 0.05.
Extended Data Figure 13.
Extended Data Figure 13.. Frequency of Lgr5-GFP+ cells decreases over time in adenomas.
a, Schematic of time-course analysis of the tumours in Lgr5-CreERT2; Apc f/f mice after tamoxifen injections. b, c, IF for Lgr5-GFP and β-catenin in Lgr5-CreERT2; Apc f/f mouse intestines (b) and quantification for the percentage of Lgr5-GFP+ cells in β-catenin nuclear accumulation positive tumour cells (c). n = 30 fields from 5 mice per group. d, Schematic of anti-CD8 antibody treatment in Lgr5-CreERT2; Apc f/f mice with tamoxifen injections. e, f, IF for Lgr5-GFP (e) and quantification of Lgr5-GFP+ areas (f) in anti-CD8 or isotype antibody-treated Lgr5-CreERT2; Apc f/f mouse intestines. n = 10 fields from 5 mice per group. g, Lgr5 mRNA expression in RNA-seq of control and SOX17KO AKP organoids. n = 3 per group. h, ISH for Lgr5 in control and SOX17OE AKP tumours. Representative of n = 9–11 mice per group. i, qRT-PCR for Lgr5 mRNA expression in control and SOX17OE naïve AKP organoids. n = 3 per group. One-way ANOVA (c). Unpaired two-tailed t-test (f, g, i). Data are mean ± SEM (c) and mean ± SD (f, g, i). *p < 0.05. Scale bar, 50 μm (b, e), 20 μm (h).
Extended Data Figure 14.
Extended Data Figure 14.. LGR5+ and LGR5 tumour cells are highly plastic and give rise to one another during tumour growth.
a, Schematic of generation of Lgr5-GFP; AKP organoids and orthotopic transplantation. b, Flow cytometry for Lgr5-GFP+ cells from Lgr5-GFP; AKP tumours and wild-type colon epithelia (negative control). Representative of n = 6 mice. c, qRT-PCR for Lgr5 mRNA expression in sorted Lgr5-GFP and Lgr5-GFP+ cells from Lgr5-GFP; AKP tumours. n = 3 mice per group. d, e, Schematic (d) and tumour engraftment rate (e) of orthotopic transplantation of sorted Lgr5-GFP and Lgr5-GFP+ cells into the colons of immunocompetent mice. In each mouse, 4,000 cells were orthotopically transplanted. n = 10–13 mice per group. Representative of two independent experiments. f, IF for Lgr5-GFP and SOX17 in Lgr5-GFP cell-derived tumours and Lgr5-GFP+ cell-derived tumours. Representative of n = 6 mice per each group. Unpaired two-tailed t-test (c). Fisher’s exact test (e). Data are mean ± SD. N.S. not significant. *p < 0.05. Scale bar, 50 μm (f).
Figure 1.
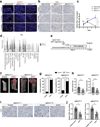
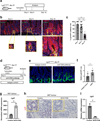
Figure 1.. Early in vivo epigenetic alterations of AKP CRCs converge on SOX17.
a, Schematic of generation of mouse naïve AKP organoids by CRISPR-Cas9 editing and Cre-mediated recombination, and mouse primary tumour-derived AKP organoids from immunocompetent mice by colonoscopy-based orthotopic transplantation. b, PCA plots of RNA-seq and ATAC-seq in naïve and primary tumour-derived AKP organoids. n = 3 mice per group. c, Volcano plot and GSEA of RNA-seq in naïve and primary tumour-derived AKP organoids. d, e, Comparison of RNA-seq DGE and ATAC-seq open promoter peak and motif enrichment analyses (d). SOX17 is the only transcription factor that is commonly detected in these three analyses (e). f, IHC for SOX17 in mouse naïve AKP organoids and mouse AKP primary tumours. Representative of n = 10 mice. g, Schematic of generation of human naïve and primary tumour-derived AKP organoids. h, qRT-PCR for SOX17 mRNA expression in human naïve and primary tumour-derived AKP organoids. n = 3 independent recipient mice. Representative of two independent experiments. i, IHC for SOX17 in human naïve AKP organoids and human AKP primary tumours in NCG mice. Representative of n = 6 mice. Unpaired two-tailed t-test (h). Data are mean ± SD. *p < 0.05. Scale bar, 20 μm (f,i).
Figure 2.
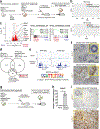
Figure 2.. SOX17 loss leads to immune-mediated rejection of colon tumours.
a, Generation of SOX17KO in vivo tumour-derived AKP organoids using 2 different sgRNAs. b, Immunoblots for SOX17 in naïve AKP organoids, in in vivo tumour-derived AKP organoids that were control (sgScramble) organoids and 4 different lines of SOX17KO using 2 sgRNAs (sgSox17–1, 2). c, Growth curve of sgScramble, sgSox17–1, and sgSox17–2 AKP organoids. n = 30 organoids from 10 wells per group. d-g, Schematic (d), representative images (e), tumour engraftment rate (f), and tumour size (g) of orthotopic transplantation of sgScramble, sgSox17–1, and sgSox17–2 AKP organoids into the colons of immunocompetent mice. n= 14–16 mice per group. h, H&E staining and IHC for CD4 and CD8 in sgScramble, sgSox17–1, and sgSox17–2 AKP tumours. i. Quantification of CD4+ and CD8+ cells in sgScramble, sgSox17–1, and sgSox17–2 AKP tumours. n = 40 fields from 5 mice per group, pooled from four independent experiments. j, Schematic of orthotopic transplantation of sgScramble, sgSox17–1, and sgSox17–2 AKP organoids into the colons of immunodeficient mice. k, l, Representative images, tumour engraftment rate, and tumour size of orthotopic transplantation of sgScramble, sgSox17–1, and sgSox17–2 AKP organoids into the colons of NCG mice (k) and Rag2−/− mice (l). n = 15–16 mice per group. Pooled from three independent experiments. One-way ANOVA (c,g,I,k,l). Chi-square test (f). Data are mean ± SD. *p < 0.05. N.S. not significant. Scale bar, 20 μm (h).
Figure 3.
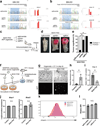
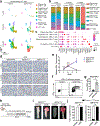
Figure 3.. SOX17 suppresses CD8+ T cell-mediated tumour elimination via IFNγ signalling.
a-c, Analysis of re-clustered T cells from scRNA-seq of CD45+ cells in control and SOX17KO AKP tumours at 1-, 2- and 4-weeks post-transplantation (see also Extended Data Fig. 7). UMAP of the re-clustered T cells (a). Bar graphs showing % of each subcluster (b). Dot plots of gene expression in each subcluster (c). 1-wk control; n = 93 cells, 2-wks control; n = 2,216 cells, 4-wk control; n = 4,097 cells, 1-wk SOX17KO; n = 178 cells, 2-wk SOX17KO; n = 810 cells, 4-wk SOX17KO; n = 4,724 cells. Pooled from 5 mice in each group. d, e, Representative images (d) and quantification (e) of IHC for CD8 in sgScramble, sgSox17–1, and sgSox17–2 AKP tumours at 1-, 2- and 4-weeks post-transplantation. n = 20 fields from 5 mice per group. f, g, Flow cytometry of IFNγ and TNFa in CD8+ T cells (f: see also Supplementary Fig. 3 and Methods for details) and quantification of IFNγ+TNFa+ cells per CD8+ cells (g) in control and SOX17KO (sgSox17–1) tumours. n = 3 mice per group. h-j, Schematic (h), representative images (i), and tumour engraftment rate (j) of orthotopic transplantation of SOX17KO (sgSox17–1 and sgSox17–2 lines) AKP organoids into the colons of anti-CD8 antibody-treated mice. n= 9–10 mice per group, pooled from two independent experiments. One-way ANOVA (e). Unpaired two-tailed t-test (g). Fisher’s exact test (j). Data are mean ± SD. *p < 0.05. Scale bar, 20 μm (d).
Figure 4.
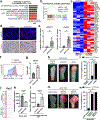
Figure 4.. SOX17 suppresses Ifngr1-mediated MHC-I expression to evade CD8+ T cell-mediated tumour cell killing.
a-c, RNA-seq in control and SOX17KO AKP organoids. GSEA using Hallmark gene sets in the Molecular Signatures Database (FDR < 0.25; a, b). Heatmap of IFNγ signalling pathway genes (Ifngr1 plus top ranked genes of IFNG response gene set in rank order). FDR, false-discovery rate; NES, normalized enrichment score. n = 3 organoid clones per group (Control: sgScramble clones 26, 27, and 28; SOX17KO: sgSox17–1 clones 1 and 7, and sgSox17–2 clone 15; Supplementary Fig. 2). d, e, Representative images (d) and quantification (e) of IF for pSTAT1 and ISH for Cxcl10 in control and SOX17KO (sgSox17–1) tumours at 6 wks post-transplantation. n = 20 fields from 5 mice. f, g, Flow cytometry (f) and quantification (g) of MHC-I (H-2Kb) expression in control and SOX17KO (sgSox17–1) tumours at 2 wks post-transplantation. n = 4 mice per group. h, i, Representative images (h) and tumour engraftment rate (i) of orthotopically transplanted SOX17KO (sgSox17–1) AKP tumours in isotype control, anti-IFNAR1 antibody, and anti-IFNγ antibody-treated mice. j, CUT&RUN for SOX17 showed SOX17 binding to the Ifngr1 promoter. n = 3 different organoid lines per group. k, l, Ifngr1 mRNA expression in RNA-seq of control vs dox-inducible and constitutive SOX17OE naïve AKP organoids (k) and control vs SOX17KO in vivo tumour-derived AKP organoids (l). n = 2–3 per group. m, n, Representative images (m), and tumour engraftment rate (n) of orthotopic transplantation of SOX17KO (sgSox17–1); sgScramble AKP organoids and SOX17KO (sgSox17–1); IFNGR1KO (sgIfngr1 clones 4 and 11) AKP organoids into the colons of immunocompetent mice. n= 9–10 mice per group. Unpaired two-tailed t-tests (e, g, k, l). Chi-square tests (i, n). Data are mean ± SD. *p < 0.05. Scale bar, 20 μm (d).
Figure 5.
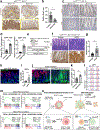
Figure 5.. SOX17 produces LGR5 cells to evade antitumour immunity.
a-d, IHC for β-Catenin (a) and quantification of nuclear β-Catenin-positive tumour cell areas (b) in Lgr5-CreERT2; Apc f/f and Lgr5-CreERT2; Apc f/f; Sox17 f/f mouse intestines. IHC for CD4 and CD8 (c) and quantification of CD4+ and CD8+ cell numbers (d). n = 20 fields from 5 mice per group. Experiments were repeated three times. e-g, Schematic (e) of anti-CD8 antibody treatment in Lgr5-CreERT2; Apc f/f; Sox17 f/f mice with tamoxifen injections. H&E staining and IHC for β-Catenin (f) in anti-CD8 or isotype antibody-treated Lgr5-CreERT2; Apc f/f; Sox17 f/f mouse intestines. Quantification of β-Catenin nuclear accumulation-positive tumour cell areas (g). n = 20 fields from 5 mice per group. Experiments were repeated three times. h, IF for Lgr5-GFP and SOX17 in Lgr5-CreERT2; Apc −/− adenoma. Representative of n= 6 mice. i, Quantification of MHC-I (H-2Kb) expression in Lgr5-GFP and Lgr5-GFP+ cells from Lgr5-CreERT2; Apc −/− adenoma. n = 4 mice. j, k, IF (j) for Lgr5-GFP and SOX17 in anti-CD8 antibody-treated Lgr5-CreERT2; Apc f/f and Lgr5-CreERT2; Apc f/f; Sox17 f/f mouse intestinal tumours. Quantification of Lgr5-GFP+ area (k). n = 6 fields from 5 mice per group. l, CUT&RUN for SOX17 showed SOX17 binding to the Lgr5 promoter and introns. n = 3 per group. m, GSEA using foetal intestinal gene makers in RNA-seq data of control and SOX17OE naïve AKP organoids and control and SOX17KO in vivo tumour-derived AKP organoids. n, Schematic of the role of SOX17 in immune evasion of colon adenoma/adenocarcinoma. Unpaired two-tailed t-tests (b, d, g, i, k). Data are mean ± SD. *p < 0.05. Scale bar, 20 μm (c, f), 50 μm (h, j), 5 mm (a: upper panels), 100 μm (a; lower panels). Schematic in n created using BioRender (www.biorender.com).

Comment in

References

    1. Pelka K et al. Spatially organized multicellular immune hubs in human colorectal cancer. Cell 184, 4734–4752.e4720 (2021). 10.1016/j.cell.2021.08.003 - DOI - PMC - PubMed
    1. Lin JR et al. Multiplexed 3D atlas of state transitions and immune interaction in colorectal cancer. Cell 186, 363–381.e319 (2023). 10.1016/j.cell.2022.12.028 - DOI - PMC - PubMed
    1. Tauriello DVF et al. TGFbeta drives immune evasion in genetically reconstituted colon cancer metastasis. Nature 554, 538–543 (2018). 10.1038/nature25492 - DOI - PubMed
    1. Shankaran V et al. IFNgamma and lymphocytes prevent primary tumour development and shape tumour immunogenicity. Nature 410, 1107–1111 (2001). 10.1038/35074122 - DOI - PubMed
    1. Koebel CM et al. Adaptive immunity maintains occult cancer in an equilibrium state. Nature 450, 903–907 (2007). 10.1038/nature06309 - DOI - PubMed

Method references

    1. Barker N et al. Identification of stem cells in small intestine and colon by marker gene Lgr5. Nature 449, 1003–1007 (2007). https://doi.org/nature06196 [pii] 10.1038/nature06196 - DOI - PubMed
    1. el Marjou F et al. Tissue-specific and inducible Cre-mediated recombination in the gut epithelium. Genesis 39, 186–193 (2004). 10.1002/gene.20042 - DOI - PubMed
    1. Kuraguchi M et al. Adenomatous polyposis coli (APC) is required for normal development of skin and thymus. PLoS genetics 2, e146 (2006). 10.1371/journal.pgen.0020146 - DOI - PMC - PubMed
    1. Johnson L et al. Somatic activation of the K-ras oncogene causes early onset lung cancer in mice. Nature 410, 1111–1116 (2001). 10.1038/35074129 - DOI - PubMed
    1. Marino S, Vooijs M, van Der Gulden H, Jonkers J & Berns A Induction of medulloblastomas in p53-null mutant mice by somatic inactivation of Rb in the external granular layer cells of the cerebellum. Genes & development 14, 994–1004 (2000). - PMC - PubMed