. 2024 Mar;627(8002):149-156.
doi: 10.1038/s41586-024-07132-6. Epub 2024 Feb 28.

Multisensory gamma stimulation promotes glymphatic clearance of amyloid

Affiliations

Multisensory gamma stimulation promotes glymphatic clearance of amyloid

Mitchell H Murdock et al. Nature. 2024 Mar.

Abstract

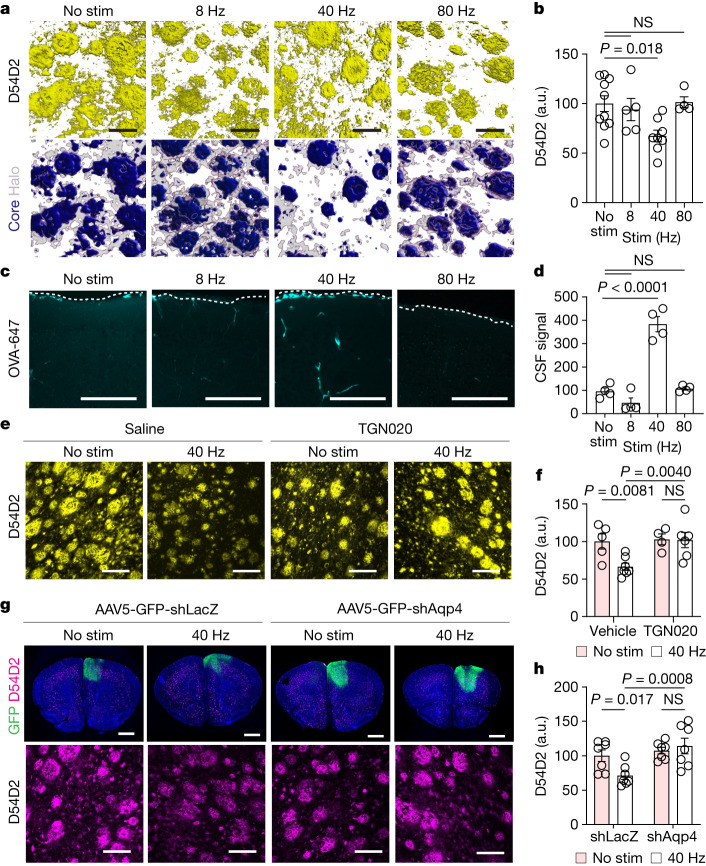
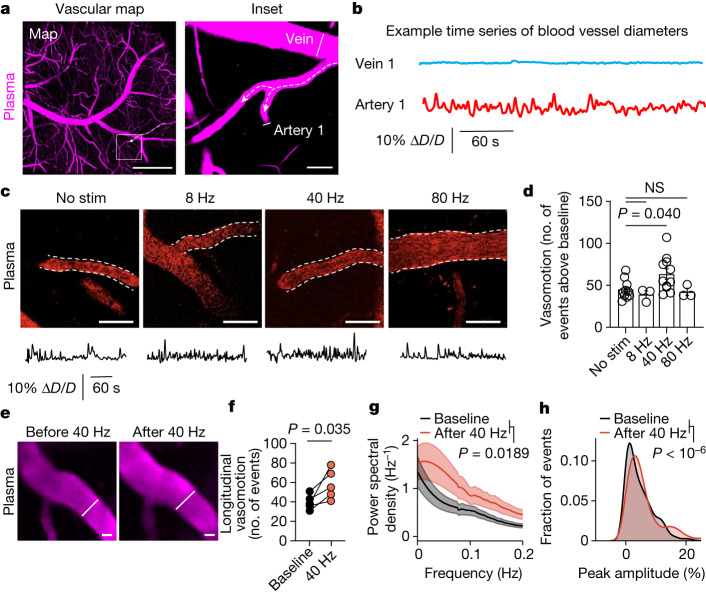
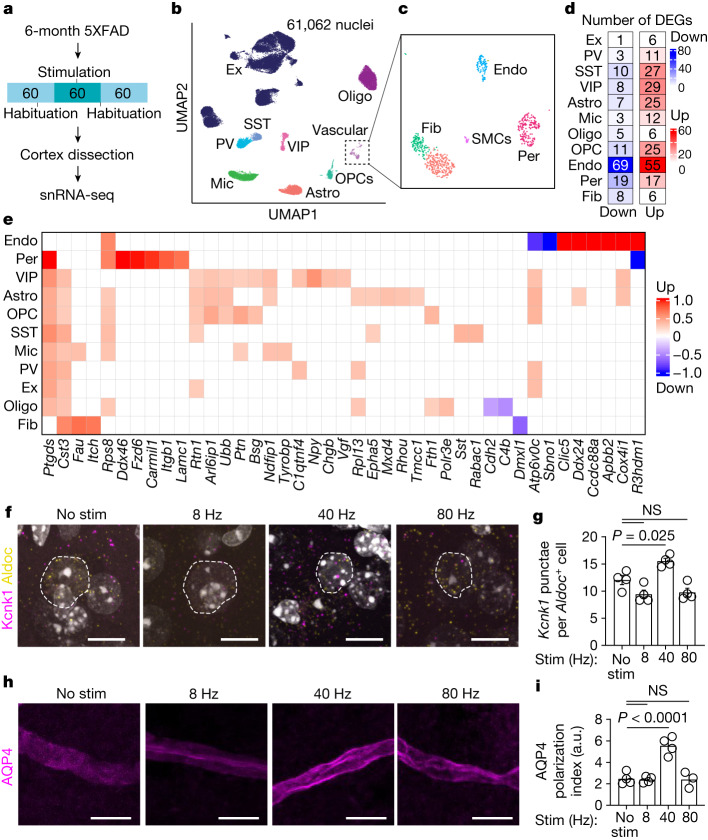
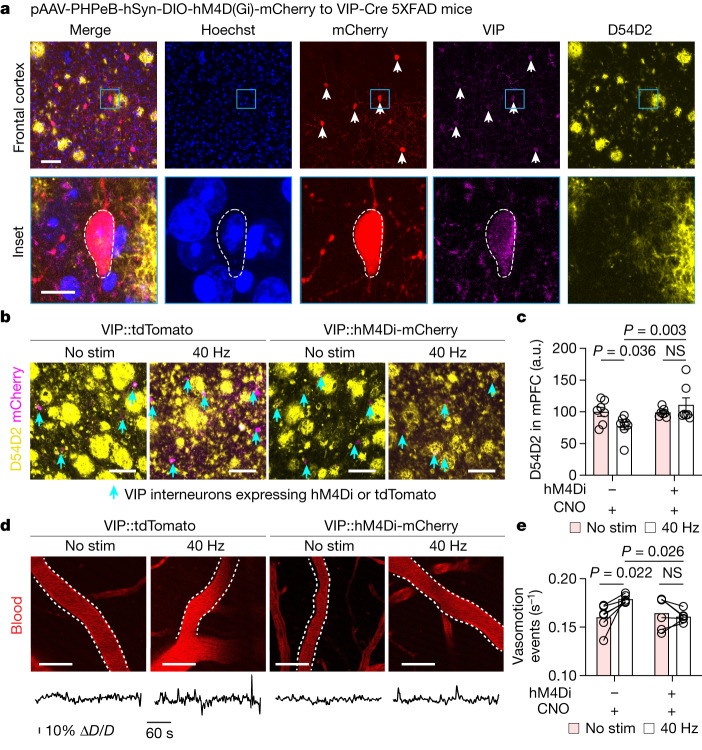
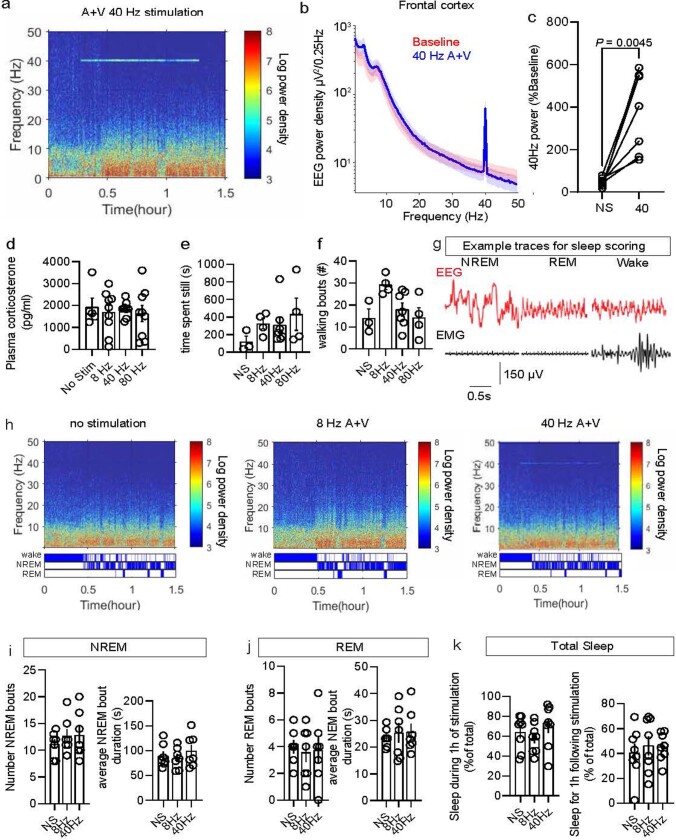
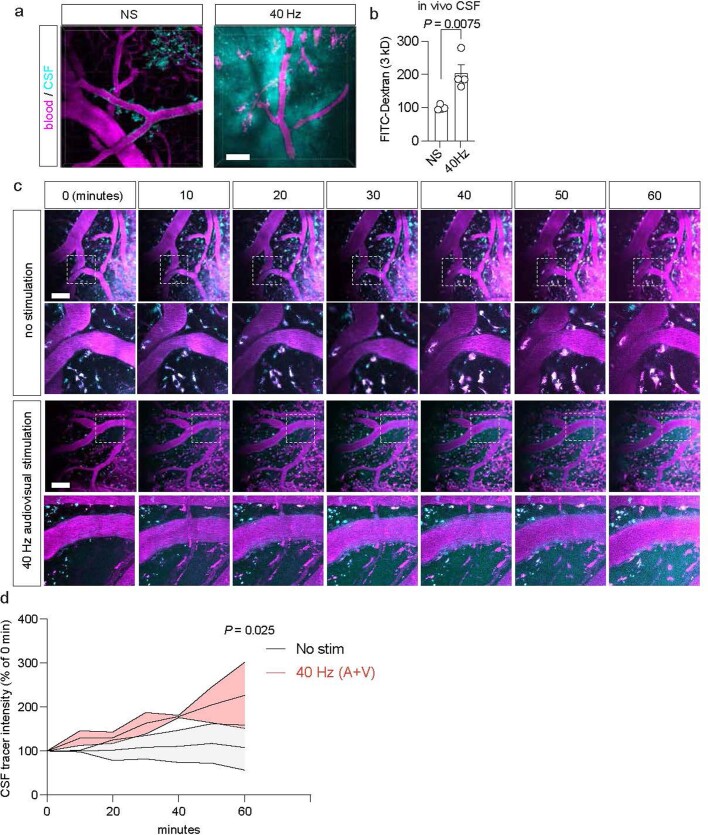
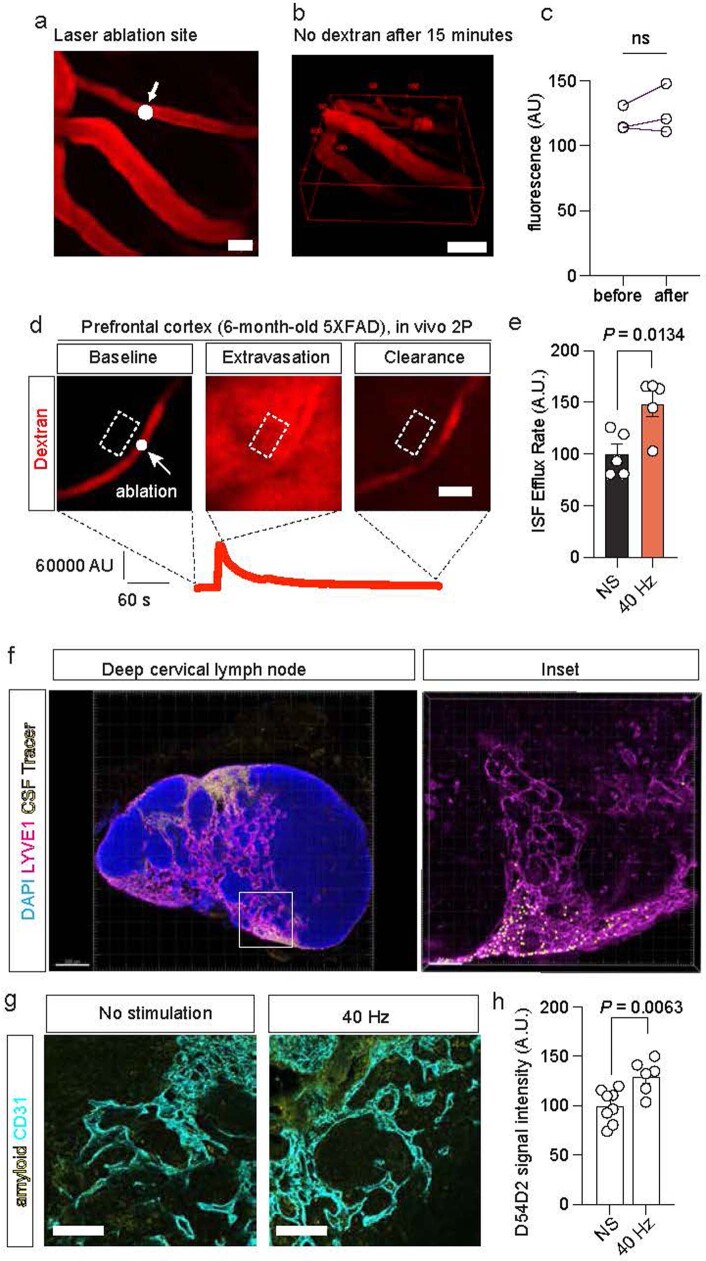
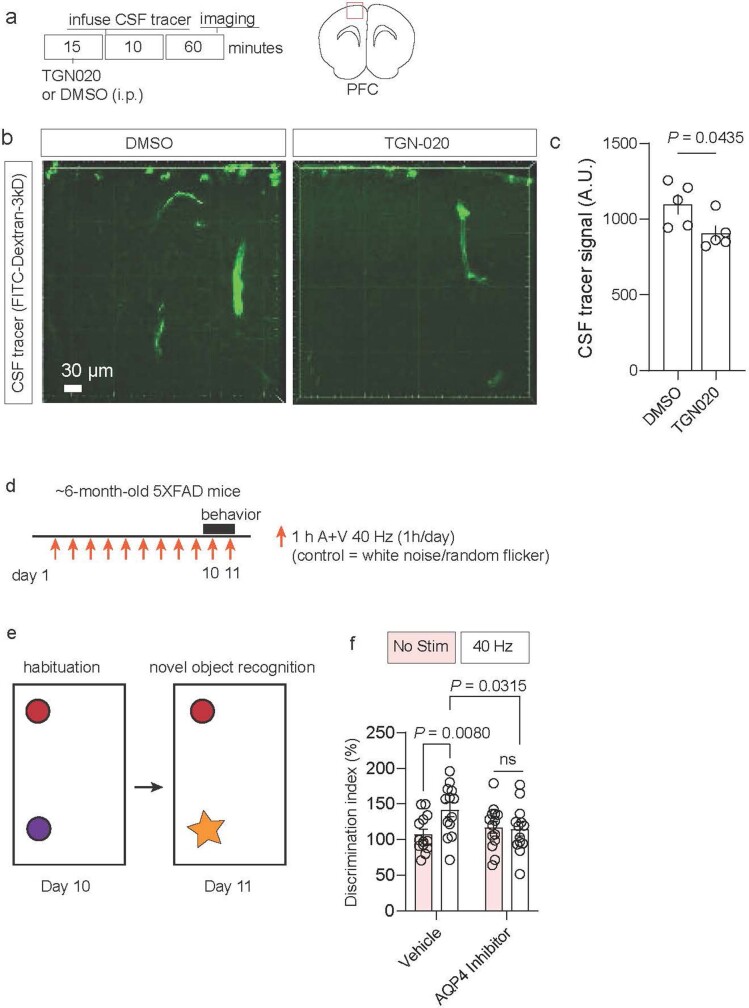
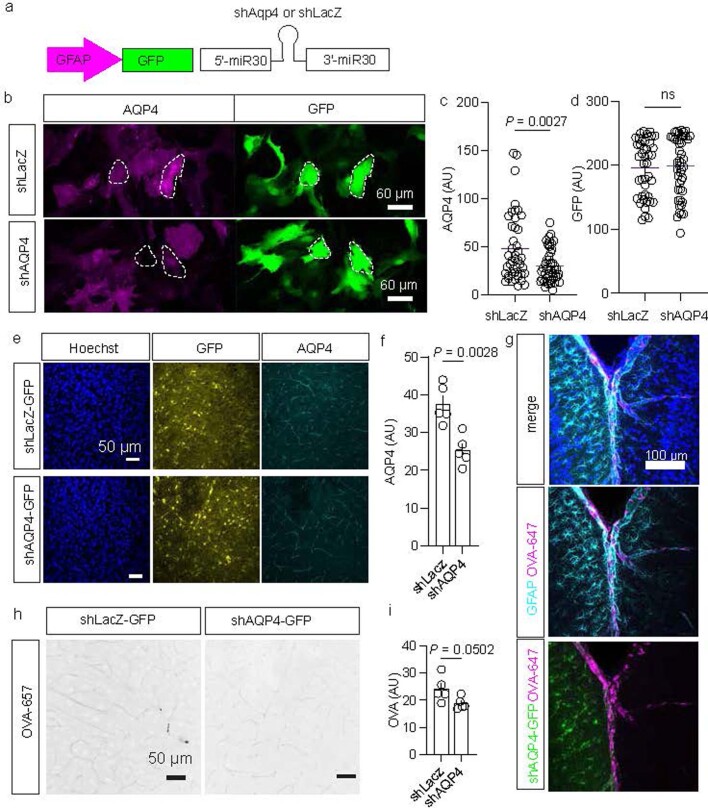
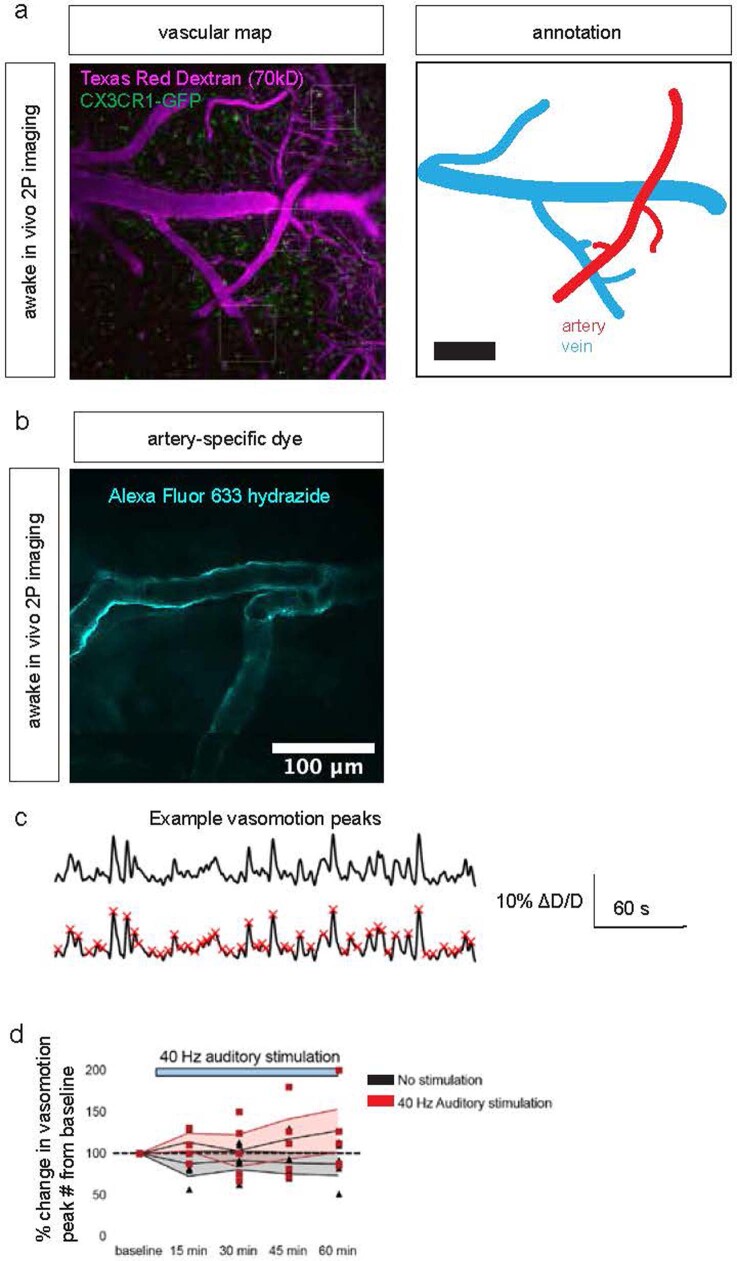
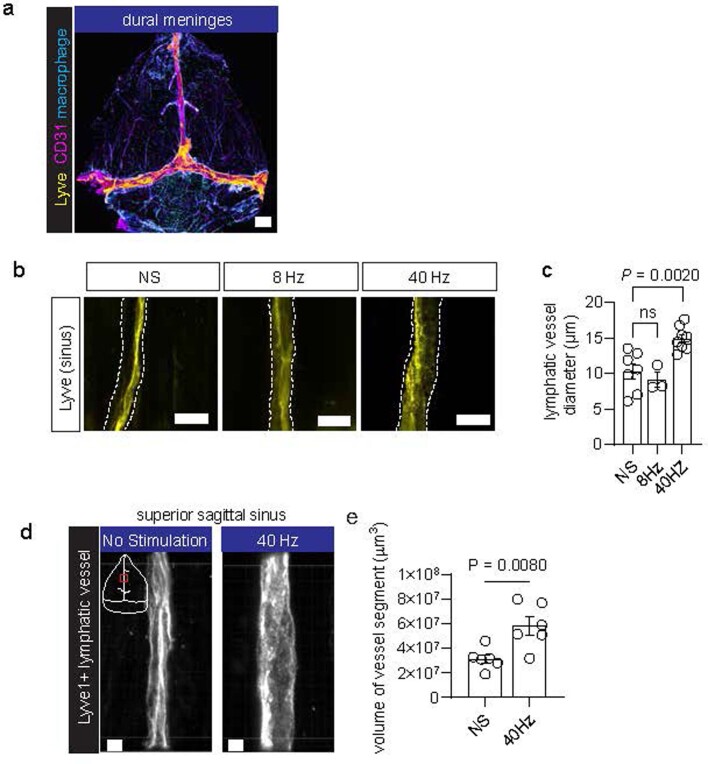
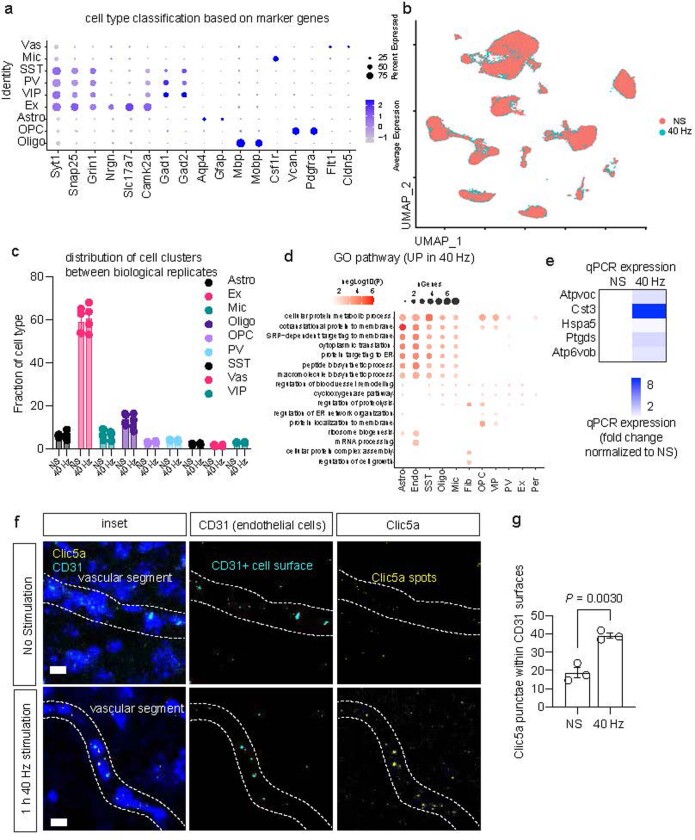
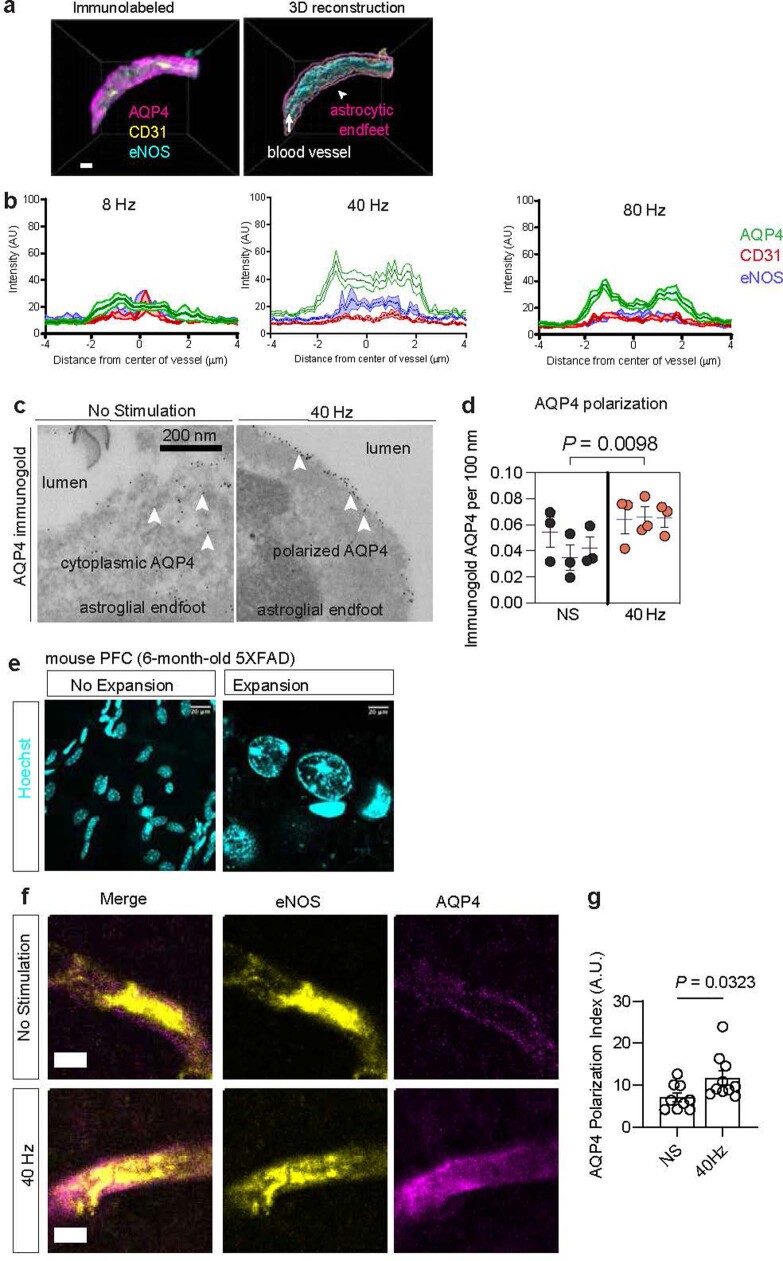
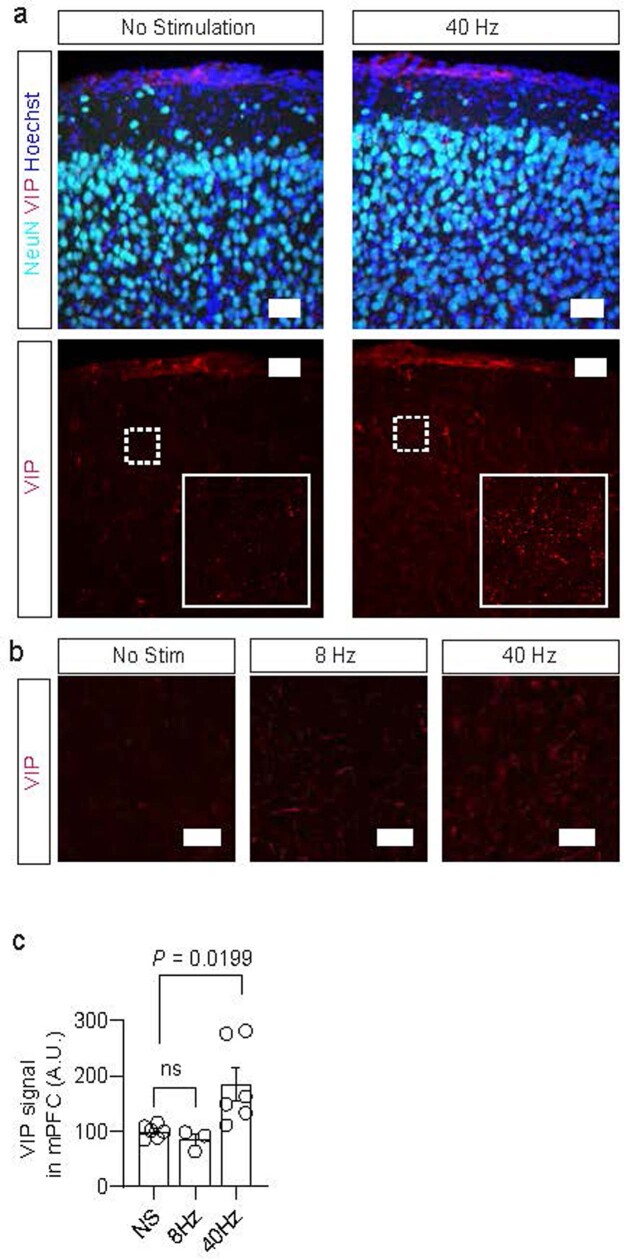
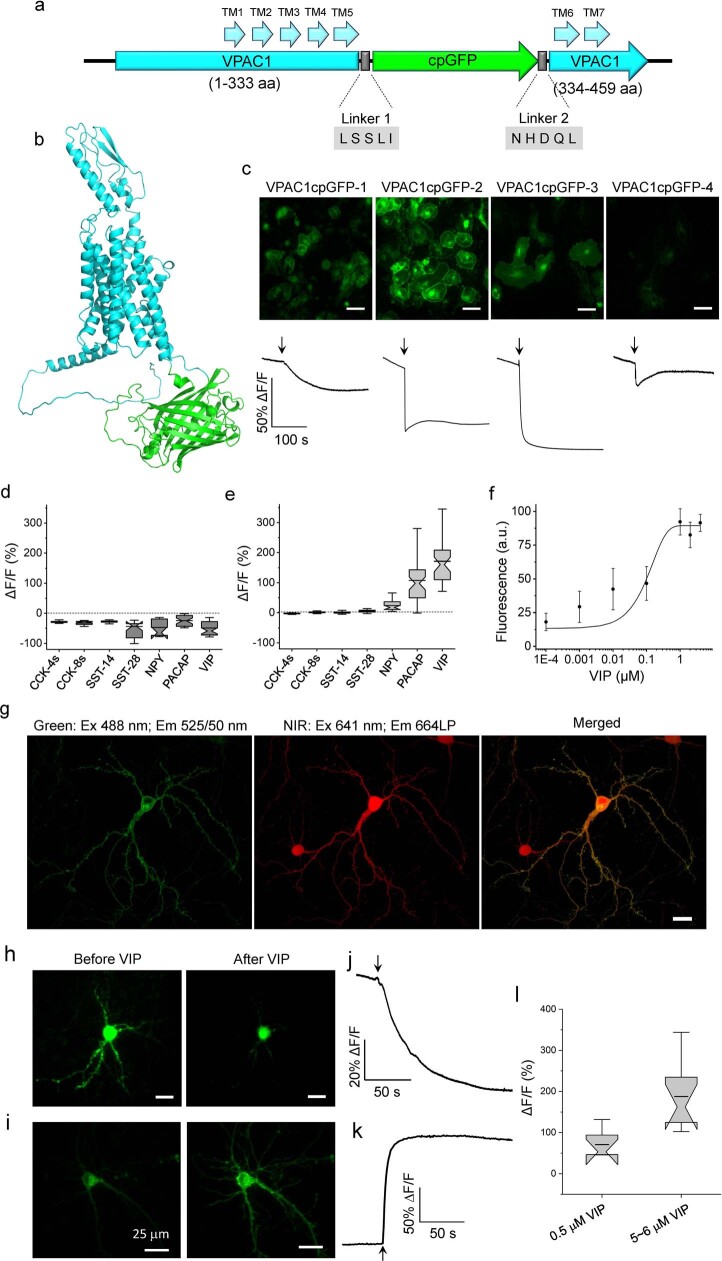
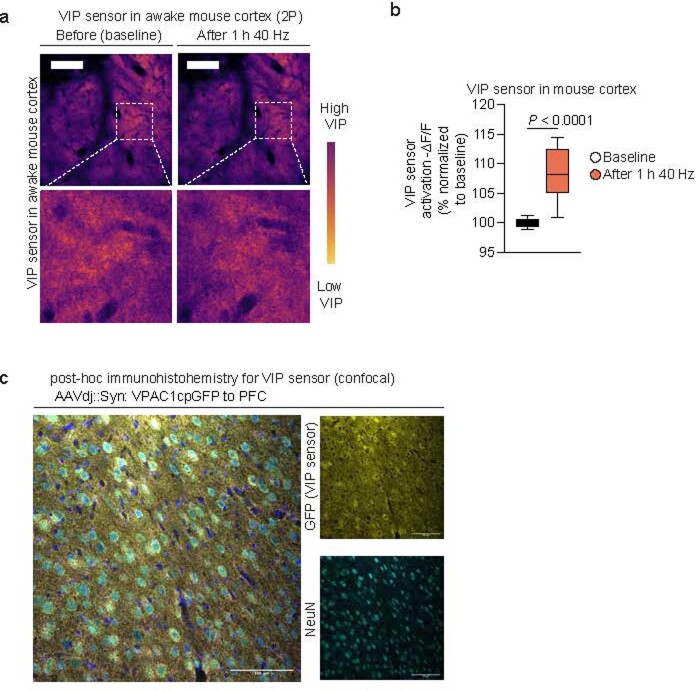
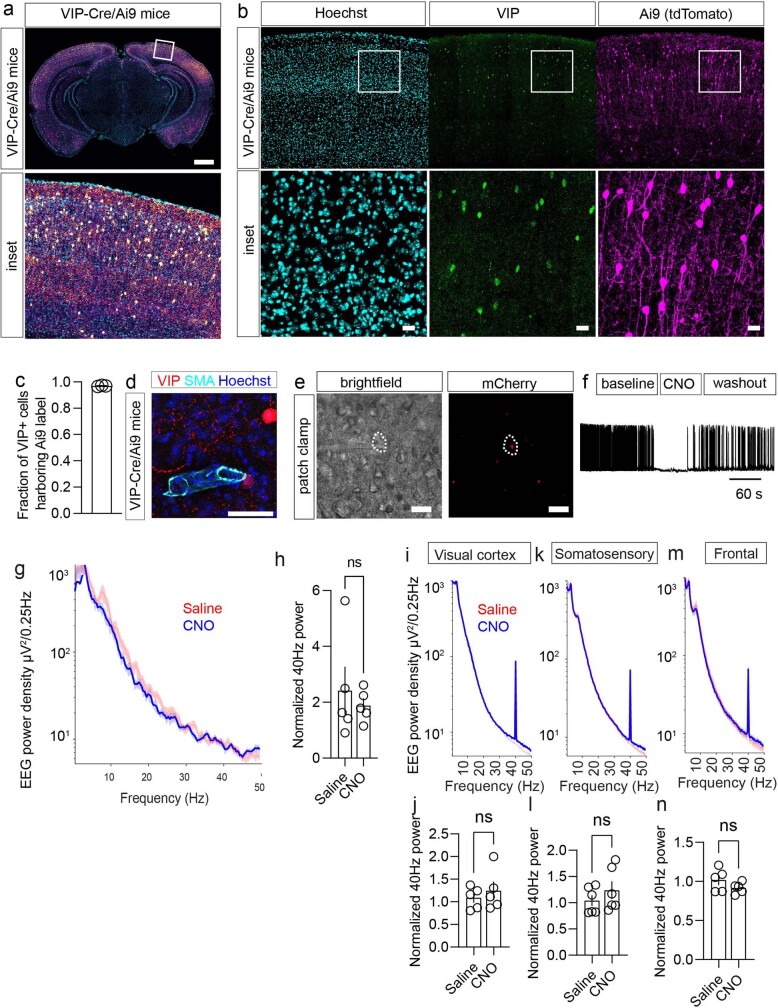
The glymphatic movement of fluid through the brain removes metabolic waste1-4. Noninvasive 40 Hz stimulation promotes 40 Hz neural activity in multiple brain regions and attenuates pathology in mouse models of Alzheimer's disease5-8. Here we show that multisensory gamma stimulation promotes the influx of cerebrospinal fluid and the efflux of interstitial fluid in the cortex of the 5XFAD mouse model of Alzheimer's disease. Influx of cerebrospinal fluid was associated with increased aquaporin-4 polarization along astrocytic endfeet and dilated meningeal lymphatic vessels. Inhibiting glymphatic clearance abolished the removal of amyloid by multisensory 40 Hz stimulation. Using chemogenetic manipulation and a genetically encoded sensor for neuropeptide signalling, we found that vasoactive intestinal peptide interneurons facilitate glymphatic clearance by regulating arterial pulsatility. Our findings establish novel mechanisms that recruit the glymphatic system to remove brain amyloid.


Conflict of interest statement

L.-H.T. and E.S.B. are co-scientific founders and serve on the scientific advisory board of Cognito Therapeutics. The other authors declare no competing interests.

Figures

Fig. 1
Fig. 1. Multisensory 40 Hz stimulation promotes AQP4-dependent clearance of amyloid.
a, Top row, example confocal z-stack reconstructions of D54D2 (monoclonal β-amyloid antibody) signal from frontal cortex of 6-month-old 5XFAD mice with stimulations at indicated frequency or no stimulation (No stim). Bottom row, amyloid signals based on dense-core and non-core regions. Scale bars, 20 μm. b, Quantification of D54D2 signal intensity in experiments represented in a (n = 10 (no stimulation), 5 (8 Hz), 8 (40 Hz) and 4 (80Hz) 6-month-old 5XFAD mice; P values by one-way analysis of variance (ANOVA) and Dunnett’s multiple comparison test). a.u., arbitrary units; NS, not significant. c, Maximum intensity projections of confocal z-stacks for cisterna magna-infused CSF tracer (OVA-647) imaged in frontal cortex. The dotted line shows cortical surface. Scale bars, 100 μm. d, Quantification of cisterna magna-infused OVA-647 from c (n = 4 6-month-old 5XFAD mice per condition; P values by one-way ANOVA and Dunnett’s multiple comparison test). e, Example confocal z-stack projections of D54D2 in frontal cortex of 6-month-old 5XFAD mice. Scale bars, 100 μm. f, Quantification of amyloid signal intensity in frontal cortex (n = 5 (no stimulation), 7 (40 Hz), 4 (no stimulation + TGN020) and 6 (40 Hz + TGN020) 6-month-old 5XFAD mice; P values by two-way ANOVA and Fisher’s least significant difference (LSD) test). g, Top row, example coronal section showing signal from Hoechst (blue), adeno-associated virus (AAV) expressing short hairpin RNA (shRNA) targeting Aqp4 (AAV-eGFP-shAqp4) or lacZ (AAV-eGFP-shLacZ) and D54D2. Bottom row, example confocal z-stack maximum intensity projection of D54D2 signal. Scale bars: 1,000 μm (top), 100 μm (bottom). h, Quantification of D54D2 signal intensity from experiments represented in g (n = 6 (no stimulation), 7 (no stimulation + shLacZ), 7 (40 Hz + shLacZ) and 7 (40 Hz + shAqp4); P values by two-way ANOVA and Fisher’s LSD test; data are mean ± s.e.m.). Source Data
Fig. 2
Fig. 2. Multisensory 40 Hz stimulation promotes arterial pulsatility.
a, Example image of blood vessels imaged by two-photon microscopy through a cranial window using Texas Red–dextran 70 kD in 6-month-old 5XFAD mice. Dotted arrows depict blood flow direction, and line segments indicate regions used to quantify blood vessel diameter over time. Scale bars: 500 μm (left) and 20 μm (right). b, Example time series of diameter (D) of blood vessels. ∆D/D is change in blood vessel diameter as a fraction of the mean diameter. c, Example images and traces of vasomotion after multisensory stimulations in 6-month-old 5XFAD mice. Scale bars, 50 μm. d, Number of peaks after 1 h of noninvasive multisensory stimulation in 6-month-old 5XFAD mice (n = 10 (no stimulation), 3 (8 Hz), 11 (40 Hz) and 3 (80 Hz) vascular segments; P values by one-way ANOVA followed by Dunnett’s multiple comparisons test; data are mean ± s.e.m.). e, Repeated imaging of the arterial segments before and after 1 h of noninvasive multisensory gamma stimulation. Example images and representative diameter traces are shown. Scale bars, 20 μm. f, Number of peaks within time series traces from vasomotion patterns for a subset of mice from d imaged longitudinally (n = 5 mice imaged before and after 40 Hz stimulation; P values by paired t-test). g, Fast Fourier transform analysis of arterial vasomotion (n = 5 mice imaged both before and after gamma stimulation; P values by paired t-test; shaded areas represent s.e.m.). h, Distribution of vasomotive events based on amplitude peak over baseline (n = 5 mice imaged both before and after gamma stimulation; P < 10−6 by two-tailed Mann–Whitney test). Source Data
Fig. 3
Fig. 3. snRNA-seq of mouse cortex following gamma stimulation reveals changes in astrocyte membrane trafficking.
a, Six-month-old 5XFAD mice were presented with 1 h of 40 Hz multisensory stimulation or no stimulation, allowed to rest for 1 h, and cortex was prepared for snRNA-seq. b, Cell type clustering by uniform manifold approximation and projection (UMAP) of 61,062 high-quality nuclei. Cells were classified as excitatory neurons (Ex), parvalbumin interneurons (PV), somatostatin interneurons (SST), vasoactive intestinal peptide (VIP) interneurons, microglia (Mic), astrocytes (Astro), oligodendrocyte precursor cells (OPCs), oligodendrocytes (Oligo) and vascular cells. c, Vascular cells were annotated using in silico enrichment as endothelial cells (Endo), smooth muscle cells (SMCs), fibroblasts (Fib) and pericytes (Per). d, Differentially expressed genes (DEGs) with 1 h of 40 Hz stimulation versus no stimulation for each cell type. e, DEGs per cell type based on fold-change difference with stimulation. f, Example confocal z-stack projections of RNA in situ hybridization of the DEG Kcnk1 (magenta) in astrocyte-specific nuclei (Aldoc+, yellow). Dashed white outlines represent the nucleus. Scale bars, 10 μm. g, Quantification of images in f. Imaris was used to identify astrocyte nuclei based on Aldoc expression, and the spots feature was used to quantify the number of Kcnk1 puncta per cell (n = 4 mice per group; each data point represents the mean of Kcnk1+ puncta per Aldoc+ astrocyte from each mouse; data are mean ± s.e.m.; P values by one-way ANOVA followed by Dunnett’s multiple comparison test). h, Example confocal images of AQP4 immunofluorescence in mouse prefrontal cortex. Astrocytic endfeet (magenta) are visualized and ensheath the blood vessel. i, The polarization index of AQP4 (n = 4 (no stimulation), 4 (8 Hz), 4 (40 Hz) and 3 (80 Hz) 6-month-old 5XFAD mice; data are mean ± s.e.m.; P values by one-way ANOVA followed by Dunnett’s multiple comparison test). Source Data
Fig. 4
Fig. 4. VIP neurons mediate gamma-mediated glymphatic clearance.
a, Top row, example image of frontal cortex of 6-month-old VIP-Cre 5XFAD mice after receiving PHP.eB.AAV.Syn.DIO-hM4Di-mCherry. Bottom row, magnified view of indicated region in the top row. This experiment was repeated twice. Scale bar: 50 μm (top row) and 10 μm (bottom row). b, Example confocal z-stack maximum intensity images of medial prefrontal cortex (mPFC) of 6-month-old VIP-Cre 5XFAD mice injected with PHP.eB.AAV.Syn.DIO-hM4Di-mCherry (VIP::hM4Di-mCherry) or control (VIP::tdTomato) and labelled with D54D2 and mCherry (indicated with cyan arrowheads) receiving no stimulation or 40 Hz stimulation. Scale bars, 100 μm. c, Quantification of amyloid in experiment represented in b (n = 7 (no stimulation + tdTomato), 8 (40 Hz + tdTomato), 7 (no stimulation + hM4Di) and 7 (40 Hz + hM4Di) VIP-Cre 5XFAD mice; data are mean ± s.e.m.; P values by two-way ANOVA followed by Fisher’s LSD test). d, Example images and time series of arterial pulsatility after multisensory stimulation. Scale bars, 50 μm. e, Quantification of arterial pulsatility (n = 5 VIP-Cre 5XFAD per group; data are mean ± s.e.m.; P values by two-way ANOVA followed by Fisher’s LSD test). Source Data
Extended Data Fig. 1
Extended Data Fig. 1. Arousal state following multisensory stimulations in 6-month-old 5XFAD mice.
a. Example spectrogram from frontal EEG signal recorded in one 6-month-old 5XFAD mouse during 40 Hz stimulation (presented between 0.3 h and 1.3 h). b. Mean EEG power density measured in frontal cortex (n = 7 6-month-old 5XFAD mice; data is presented as the mean across all mice; shaded area represents the standard error of the mean). c. Average power at 40 Hz measured in frontal cortex of 6-month-old 5XFAD mice during one hour of audio-visual 40 Hz stimulation compared to baseline period (no stimulation). Values are expressed as % of mean power density during baseline (no stimulation) (n = 7 6-month-old 5XFAD mice; data is presented as the mean ± s.e.m.; P value was calculated by paired two-tailed t-test). d. Plasma corticosterone measured by ELISA following 1 h of multisensory stimulation (either 8 Hz, 40 Hz, or 80 Hz multisensory stimulation or no stimulation) in 6-month-old 5XFAD mice (n = 5 mice for no stimulation; 9 mice for 8 Hz; 9 mice for 40 Hz; 9 mice for 80 Hz; data is presented as the mean ± s.e.m.; statistical analysis used one-way ANOVA followed by Tukey’s multiple comparisons test). e. Time spent still (seconds) during 1 h of multisensory stimulation (either no stimulation, 8 Hz, 40 Hz, or 80 Hz multisensory stimulation) in 6-month-old 5XFAD mice (n = 3 mice for no stimulation (NS); 4 mice for 8 Hz; 7 mice for 40 Hz; 4 mice for 80 Hz; data is presented as the mean ± s.e.m.; one-way ANOVA followed by Tukey’s multiple comparisons test was used for statistical analysis). f. Number of walking bouts during 1 h of multisensory stimulation (either no stimulation, 8 Hz, 40 Hz, or 80 Hz multisensory stimulation) in 6-month-old 5XFAD mice (n = 3 mice for no stimulation (NS); 4 mice for 8 Hz; 7 mice for 40 Hz; 4 mice for 80 Hz; data is presented as the mean ± s.e.m.; one-way ANOVA followed by Tukey’s multiple comparisons test was used for statistical analysis). g. Representative EEG traces (recorded from the frontal cortex) and the EMG (recorded from the neck muscle) during NREM, REM and wake in one mouse using established methods. h. Representative spectrograms (top) and hypnogram (bottom) for each stimulation condition in one mouse. The top bar of the hypnogram represents the time spent wake, middle bar represents NREM state, and bottom bar represents REM state. i. Quantification of NREM bouts (left) and average NREM bout duration (right) across stimulation conditions (no stimulation; 8 Hz; or 40 Hz) (n = 7 6-month-old 5XFAD mice; repeated measures paired one-way ANOVA followed by Tukey’s multiple comparisons test was used for statistical analysis; data is presented as the mean ± s.e.m.). j. Quantification of REM bouts (left) and average REM bout duration (right) across stimulation conditions (no stimulation; 8 Hz; or 40 Hz) (n = 7 6-month-old 5XFAD mice; repeated measures paired one-way ANOVA followed by Tukey’s multiple comparisons test was used for statistical analysis; data is presented as the mean ± s.e.m.). k. Quantification of total sleep during (left) and 1 h after (right) stimulation (No stimulation (NS), 8 Hz audio-visual, 40 Hz audio-visual stimulation) as a percent of total time (n = 8 6-month-old 5XFAD mice; repeated measures paired one-way ANOVA followed by Tukey’s multiple comparisons test was used for statistical analysis; data is presented as the mean ± s.e.m.). Source Data
Extended Data Fig. 2
Extended Data Fig. 2. Monitoring CSF dynamics following multisensory 40 Hz stimulation via two-photon microscopy in awake 6-month-old 5XFAD mice.
a. Example 2 P z-stacks of vascular blood (magenta, Texas Red-Dextran-70kD, injected retro-orbitally) and CSF tracer (cyan, FITC-Dextran-3kD, infused through a cannula installed into the cisterna magna) following 1 h of multisensory gamma stimulation or no stimulation control, imaged via a cranial window in frontal cortex. Scale bar, 50 μm. b. Quantification of CSF tracer (FITC-Dextran-3kD) infused via intracisternal cannulation into 6-month-old 5XFAD mouse cortex via 2 P microscopy. The intensity of tracer signal was quantified using ImageJ (n = 4 mice per condition; each data point represents the mean of at least two z-stacks per mouse; data is presented as the mean ± s.e.m.; P value represents unpaired two-sided t-test). c. Example 2 P z-stacks imaged every 10 min after no stimulation or 40 Hz stimulation. Images are representative of two separate experiments. Scale bar, 100 um. d. Quantification of CSF tracer dynamics (n = 2 6-month-old 5XFAD mice per group; P value by two-way ANOVA followed by Fisher’s LSD test). Source Data
Extended Data Fig. 3
Extended Data Fig. 3. Clearance assays following gamma stimulation.
a. The white dot marks the representative position of a 2P-laser ablation applied to a vascular segment, to induce brief extravasation of intravenously loaded dextran (Texas Red-Dextran-70kD). Scale bar, 20 μm. b. Representative volumetric scan of Texas Red-Dextran-70kD in mouse PFC 15 min after application of the laser ablation, suggesting extravasated tracer is cleared within 15 min. c. Quantification of extravascular fluorescence before and after ISF ablation assay (n = 3 regions of interest from 1 6-month-old 5XFAD mouse; two-tailed unpaired t-test was used for statistical analysis). Scale bar, 50 um. d. Example images of 2 P focal ablation assay showing clearance of extravasated material due to interstitial fluid flux in 6-month-old 5XFAD mice. The white dot (left panel) marks the representative position of a 2P-laser ablation applied to a vascular segment, inducing extravasation of intravenously loaded dextran (Texas Red-Dextran-70kD; middle panel) that is then quickly cleared from the brain parenchyma (right panel; scale bar, 10 μm). The red graph under the panel shows the Texas Red fluorescence intensity in the region surrounded by the dotted box over time. e. Quantification of interstitial fluid efflux in 6-month-old 5XFAD mice following 1 h of multisensory gamma stimulation or non-stimulated control (n = 5 6-month-old 5XFAD mice per stimulation condition; each mouse was imaged in 3 vessel segments; data is presented as the mean ± s.e.m.; P value by unpaired two-tailed student’s t-test). f. Example confocal image of lymph node following infusion of FluoSphere beads to the cisterna magna. Inset reveals beads in LVYE+ area. Scale bar, 200 μm. This experiment was performed once. g. Example confocal z-stack projections of endothelial cells (CD31, cyan) and amyloid (D54D2, yellow) in deep cervical lymph nodes from 6-month-old 5XFAD mice receiving 1 h of multisensory gamma stimulation or no stimulation. Scale bar. h. Quantification of amyloid in deep cervical lymph nodes in 6-month-old 5XFAD mice after no stimulation (NS) or 1 h of 40 Hz stimulation (n = 8 mice for no stimulation and 7 mice for 40 Hz stimulation; each data point represents the mean signal intensity from confocal z-stacks acquired from at least three lymph nodes from each mouse; data is presented as the mean ± s.e.m.; P value calculated by unpaired two-tailed student’s t-test). Source Data
Extended Data Fig. 4
Extended Data Fig. 4. Effects of TGN020 on CSF tracer dynamics and behavior.
a. Experimental schematic. C57BL6/J mice received intraperitoneal injection of TGN020 or DMSO control. CSF tracer was infused via intracisternal magna and tracer was allowed to circulate for 60 min. b. Example images of CSF tracer (FITC-3kD-dextran) infused to cisterna magna and quantified in frontal cortex. Scale bar, 30 μm. c. Quantification of CSF tracer signal in frontal cortex (n = 5 C57BL6/J mice per group; data presented as mean +/− SEM; P value was calculated by unpaired two-tailed student’s t-test). d. Experimental schematic. 6-month-old 5XFAD mice were subjected to daily (1 h/day) of audio + visual 40 Hz stimulation (control = white noise and random flicker at the same lux and sound intensity). Mice received i.p. injections of vehicle or TGN020 prior to daily stimulation. e. Novel object recognition testing was performed on days 10 and 11. f. Quantification of discrimination index following novel object recognition test quantified as percent of time spent exploring novel object (n = 13 6-month-old 5XFAD mice for Vehicle + No Stim, 14 animals for Vehicle + 40 Hz; 13 mice for TGN020 + No Stim; 13 mice for TGN020 + 40 Hz. P values represent two-way ANOVA followed by Fisher’s LSD multiple comparison’s test; data is presented as the mean ± s.e.m.). Source Data
Extended Data Fig. 5
Extended Data Fig. 5. shAQP4 strategy to attenuate AQP4 function.
a. miR-30 based shRNA strategy to reduce AQP4. Constructs target the coding region of AQP4 or, as a control, LacZ. Constructs targeting three different regions of AQP4 were packaged into individual AAVs and then pooled for injection. b. Example confocal z-stack maximum intensity projections of mouse primary astrocyte cultures showing AQP4 signal (magenta) and GFP (green) following AAV application delivering shAQP4 or shLacZ. c. Quantification of AQP4 signal intensity (n = 43 cells for shLacZ, n = 46 cells for shAQP4; data is presented as the mean ± s.e.m; P value calculated by unpaired two-tailed student’s t-test). d. Quantification of GFP signal intensity (n = 43 cells for shLacZ, n = 46 cells for shAQP4; data is presented as the mean ± s.e.m; unpaired two-tailed student’s t-test was used for statistical analysis). e. Example confocal z-stack maximum intensity projections of mouse cortex following 4 weeks of viral injection (AAV-GFAP-shLacZ or AV-GFAP-shAQP4-GFP). Immunostaining shows Hoechst (blue), AQP4 signal (cyan) and GFP (yellow). Scale bar, 50 um. f. Quantification of AQP4 signal intensity from z-stacks. (n = 5 3-month-old C57BL/6 J mice for shLacZ and 5 mice for shAQP4; data is presented as the mean ± s.e.m; P value calculated by unpaired two-tailed student’s t-test). g. Example confocal z-stack maximum intensity projections of 3-month-old C57BL/6 J mouse cortex following 4 weeks of viral injection (AAV-GFAP-shLacZ or AV-GFAP-shAQP4-GFP) followed by OVA-647 injection to the cisterna magna. Immunostaining shows Hoechst (blue), GFP signal (green) and OVA-647 CSF tracer (magenta). This experiment was performed twice. Scale bar, 50 um. h. Example confocal z-stack maximum intensity projections of mouse cortex of OVA-47 (black). i. Quantification of OVA CSF tracer in mouse cortex after shLacZ or shAQP4 (n = 5 mice for shLacZ and 5 mice for shAQP4; data is presented as the mean ± s.e.m; P value calculated by unpaired two-tailed student’s t-test). Source Data
Extended Data Fig. 6
Extended Data Fig. 6. Validation of arterial imaging, including arterial segment identification and motion correction.
a. Example two-photon image of blood (magenta) and microglia (green) to define vascular segments. This experiment annotating vascular segments was used for all 2 P imaging of vasculature. b. Example image of Alexa-633, an artery marker, to define arterial segments. The experiment was repeated twice. Scale bar, 100 μm. c. Example quantification of vasomotion peaks. A Savitzky-Golay filter was applied to the vasomotion trace, and peaks were identified using find_peaks (scipy.signal). d. Longitudinal imaging of 40 Hz auditory stimulation and simultaneous 2 P vasomotion analysis in frontal cortex of 6-month-old 5XFAD mice normalized to baseline at the first imaging session prior to the onset of multisensory 40 Hz stimulation (n = 5 6-month-old 5XFAD mice; data is presented as the mean ± s.e.m). Source Data
Extended Data Fig. 7
Extended Data Fig. 7. Meningeal lymphatic response to multisensory 40 Hz.
a. Example confocal tile z-stack image of a whole mount preparation of the dural meninges showing endothelial cells (CD31, magenta), lymphatic endothelial cells (LYVE1, yellow), and meningeal macrophages (Lyve1 non-vascular cells, cyan). Dural meninges were obtained from the skull caps of 6-month-old 5XFAD mice. Similar dural whole mounts were obtained for all images of the sinus regions. Scale bar, 1000 μm. b. Example confocal images of lymphatic vessels in the dural meninges in 6-month-old 5XFAD mice. c. Quantification of diameter of meningeal lymphatic vessel using confocal microscopy in 6-month-old 5XFAD mice (n = 7 mice for no stimulation, 3 mice for 8 Hz stimulation, and 8 mice for 40 Hz stimulation; each data point represents the mean lymphatic vessel diameter from 3 images of the superior sagittal sinus; data is presented as the mean ± s.e.m.; P value calculated by one-way ANOVA followed by Dunnett’s multiple comparisons test). Scale bar, 20 μm. d. Example Airyscan confocal images of LYVE1+ lymphatic vessels in the meningeal superior sagittal sinus region (red box in the white schematic of the dural meninges) from 6-month-old 5XFAD mice receiving either 40 Hz stimulation or no stimulation. 3D images of z-stacks from lymphatic vessel segments were generated using Imaris. Scale bar, 5 μm. e. Quantification of lymphatic vessel volume in 6-month-old 5XFAD mice receiving 40 Hz or no stimulation (NS) (n = 6 mice per condition; each data point represents the mean volume from 3 segments of meningeal lymphatic vessel from the superior sagittal sinus for each mouse; data is presented as the mean ± s.e.m.; P value calculated by unpaired student’s two-tailed t-test). Source Data
Extended Data Fig. 8
Extended Data Fig. 8. snRNA-seq cell type annotation, analysis, and quality control.
a. Marker genes used for cell type annotation. Cells were classified as excitatory neurons (Ex), parvalbumin interneurons (PV), somatostatin interneurons (SST), and vasoactive intestinal peptide interneurons (VIP), microglia (Mic), astrocytes (Astro), oligodendrocyte precursor cells (OPCs), oligodendrocytes (Oligo), and vascular cells (Vas). Dot size indicates percent expressed, and dot color indicates average gene expression level. b. Distribution of cell types based on stimulation condition between no stimulation (NS) and 40 Hz stimulation (40 Hz). c. Distribution of cell cluster numbers based on biological replicate between no stimulation (NS) and 40 Hz stimulation (40 Hz) (n = 4 biological replicates per group, with each replicate consisting of three 6-month 5XFAD mouse cortex; data is presented as the mean ± s.e.m.; unpaired two-tailed t-test was used for statistical analysis). d. GO analysis of DEGs following snRNA-seq. The test for GO term enrichment was Fisher exact test. e. qPCR was conducted for genes upregulated in at least 3 cell types. A heatmap of expression change is presented, with fold difference calculated using the 2−ΔΔCt method types (n = 5 6-month-old 5XFAD mice per group, performed with two technical duplicates). f. Example confocal z-stack projections of RNA in situ hybridization (RNAscope) in the prefrontal cortex (PFC) of 6-month-old 5XFAD mice with probes to detect CD31 (cyan, endothelial cell marker, not differentially expressed between groups) and Clic5a (yellow; upregulated in 40 Hz). The dotted line represents a putative vascular segment. Scale bar, 10 μm. g. Quantification of Clic5a (yellow spots) in endothelial cells (cyan surface rendering) increased in 40 Hz stimulation (40 Hz) compared to no stimulation (NS) (n = 3 6-month-old 5XFAD mice per group; each data point represents the mean number of Clic5a puncta from CD31+ endothelial cells from 4 confocal z-stacks per mouse; data is presented as the mean ± s.e.m.; P value was calculated by unpaired two-tailed student’s t-test). Source Data
Extended Data Fig. 9
Extended Data Fig. 9. Aquaporin analysis following sensory stimulation.
a. Example confocal image of immunohistochemistry of AQP4 in mouse PFC. Astrocytic endfeet (magenta) are visualized and ensheath the blood vessel, visualized based on endothelial nitric oxide synthase (eNOS) and platelet endothelial cell adhesion molecule-1 (PECAM-1/CD31). 3D reconstruction using Imaris reveals astrocytic endfeet ensheath the blood vessel. Similar vascular segments were obtained for all experiments involving AQP4 polarization analyses presented. b. Example analysis of AQP4 polarization and Imaris 3D reconstruction of astrocytic endfeet from the PFC of a 6-month-old 5XFAD mouse. A perpendicular line segment of astrocytic endfeet was drawn in ImageJ, and the signal intensity of AQP4 was plotted. The distribution of the intensity reveals the polarization of AQP4. The polarization index is quantified by dividing the peak signal intensity of the AQP4 line segment normalized to the background intensity. An increase in the ratio between the peak of AQP4 compared to the background signal intensity signifies an increase in AQP4 polarization. Red, CD31 signal. Green, AQP4 signal. Blue, eNOS signal. The polarization of the green AQP4 signal highlights the ensheathment of AQP4 signal around blood vasculature. Shaded areas represent standard error of the mean. c. Example images of transmission electron microscopy (TEM) resolving astrocytic endfeet and AQP4 distribution (dark puncta). 6-month-old mice received one hour of noninvasive multisensory gamma stimulation or no stimulation control, and 40 μm sections of PFC coronal sections were prepared for TEM imaging. d. Quantification of AQP4 distribution via TEM within astrocytic endfeet in 6-month-old 5XFAD mice (n = 3 6-month-old 5XFAD mice per group; data is presented as the mean ± s.e.m. in a nested plot; P was calculated by nested two-tailed t-test). e. Validation of Expansion Microscopy using DAPI from mouse cortex. Left = no expansion. Right = post expansion; the experiment was repeated three times. Scale bar, 20 μm. f. Example confocal images of Expansion Microscopy of astrocytic endfeet labeled with AQP4 (magenta), the endothelial cell marker endothelial nitric oxide synthetase (yellow). Scale bar, 5 μm. g. Quantification of aquaporin-4 polarization (n = 9 astrocytic endfeet segments for no stimulation and 10 astrocytic endfeet segments for gamma stimulation; data is presented as the mean ± s.e.m.; P was calculated by unpaired two-tailed student’s t-test). Source Data
Extended Data Fig. 10
Extended Data Fig. 10. Immunohistochemistry for vasoactive intestinal peptide (VIP) following gamma stimulation.
a. Example images of VIP (red) and NeuN (cyan) immunohistochemistry in 6-month-old 5XFAD mouse prefrontal cortex following gamma stimulation or no-stimulation control. Insets reveal increased VIP immunofluorescence in gamma-treated mice. Scale bar, 50 μm. b. Example images of VIP immunohistochemistry in 6-month-old 5XFAD mouse cortex following gamma stimulation or control (red, VIP). Scale bar, 20 μm. c. Quantification of VIP signal intensity (n = 5 mice for no stimulation, 3 mice for 8 Hz stimulation, and mice for 40 Hz stimulation; each data point represents the mean from 3 z-stacks of the prefrontal cortex; data is presented as the mean ± s.e.m.; *P was calculated by one-way ANOVA followed by Dunnett’s multiple comparisons test). Source Data
Extended Data Fig. 11
Extended Data Fig. 11. Development and validation of a genetically encoded sensor for vasoactive intestinal peptide (VIP).
a. Molecular design of VIP sensor used for in vivo recordings. b. Prediction of the VIP sensor 3D structure using Alphafold v2.1 (computed on Galaxy provided by High-performance computing center at Westlake University). c. Optimization VIP sensor in HeLa cells; (top) representative images of HeLa cells expressing different variants of VIP sensor (n = 2 FOVs from two independent transfections each), (bottom) representative fluorescence traces for each tested variant of VIP sensor (n = 30, 37, 46, and 23 cells from 1, 2, 3, and 2 independent transfections, respectively; arrow indicates time point of VIP administration). d. Fluorescence changes of the VPAC1L sensor expressed in HEK293T cells in response to the indicated compounds applied to the extracellular solution (n > 19 cells from two independent transfections). e. Fluorescence changes of the VIP1.0 sensor expressed in HEK293T cells in response to the indicated compounds applied to the extracellular solution (n > 32 cells from two independent transfections). f. Normalized dose-response curve of the VIP1.0 sensor expressed in HEK cells to VIP (n = 50 cells from two independent transfections). Squares represent the mean, error bars represent the standard deviation. g. Representative image of a cultured primary neuron co-expressing the VIP sensor and miRFP (n = 31 neurons from two independent cultures). h. Representative image of a cultured primary neuron expressing the VIP sensor before and after VIP administration (n = 31 neurons from two independent cultures). i. Representative image of a cultured primary neuron expressing the VIP1.0 sensor before and after VIP administration (n = 10 neurons from four independent cultures). j. Fluorescence trace for neuron shown in h (arrow indicates time point of VIP administration). k. Fluorescence trace for neuron shown in i (arrow indicates time point of VIP administration). l. Fluorescence changes of the VIP1.0 sensor expressed in cultured neurons in response to VIP at the indicated concentrations (n = 6 and 10 neurons from four independent transfections). Box plots with notches: narrow part of notch, median; top and bottom of the notch, 95% confidence interval for the median; top and bottom horizontal lines, 25% and 75% percentiles for the data; whiskers extend 1.5-fold the interquartile range from the 25th and 75th percentiles; horizontal line, mean. Source Data
Extended Data Fig. 12
Extended Data Fig. 12. VIP sensor in awake mouse cortex.
a. Example 2 P images of VIP sensor (VPAC1cpGFP) expressed in awake mouse cortex visualized through a cranial window centered over prefrontal cortex before and after 1 h of multisensory gamma stimulation. The reduction in signal signifies an increase in VIP sensor activation following 40 Hz treatment; the experiment was repeated twice. Scale bar, 25 μm. b. Quantification of VPAC1cpGFP fluorescence change before and after 40 Hz treatment in 6-month-old 5XFAD mouse cortex via a closed cranial window. The increase in fluorescence change signifies an increase in VIP sensor activation following noninvasive multisensory gamma stimulation (presented as VIP sensor activation, i.e., -ΔF/F). A two-sided Student’s t-test was performed for data analysis (n = 15 ROIs from 3 mice imaged before and after gamma stimulation; box plots depict the median, interquartile range, and minimum and maximum; *P < 0.0001 by unpaired two-tailed student’s t-test). c. Immunohistochemistry of VIP sensor in mouse cortex; the experiment was repeated twice. Scale bar, 100 µm. Source Data
Extended Data Fig. 13
Extended Data Fig. 13. VIP-Cre mouse validation and effects on 40 Hz neuronal activity.
a. Example coronal section of VIP-Cre/Ai9 mouse acquired with confocal microscopy. VIP-IRES-Cre mice have Cre recombinase expression directed to VIP-expressing cells by the endogenous promoter/enhancer elements of the vasoactive intestinal polypeptide locus. The experiment was repeated twice. Scale bar, 1000 um. b. Example confocal z-stack maximum intensity projection image of immunohistochemistry for VIP (green) and tdTomato using a primary antibody against mCherry (magenta), with Hoechst (cyan) from a VIP-Cre/Ai9 mouse cortex. Scale bar, 20 um. c. Quantification of cells expressing both Ai9 and VIP (n = 3 mice; data is presented as the mean ± s.e.m.). d. Example of VIP neuronal processes (red, VIP-Cre tdTomato) adjacent to arterial smooth muscle (cyan, labeled with SMA-22). Scale bar, 50 µm. e. Example brightfield (left) and fluorescent (right) images of the patched neuron expressing mCherry. A giga-ohm seal was achieved for recording. VIP-Cre/5XFAD mice were retro-orbitally injected with PHP.eB-AAV-DIO-hM4Di-mCherry. Virus was allowed to express for ~4 weeks. Scale bar, 50 um. f. Whole cell current clamp recording of VIP neurons expressing Gi-coupled DREADDs from prefrontal cortex. Represented sweep shows bath application of CNO (20 uM) following washout. g. Poewr density in the frontal EEG showing the effect of VIP chemogenetic inhibition on baseline state. VIP-Cre/5XFAD mice received PHPeb-AAV-DIO-hM4Di-mCherry, EEG implants were placed, then recordings were obtained such that mice received either CNO or saline prior to recording during multisensory 40 Hz stimulation (n = 5 6-month-old 5XFAD mice; data is present as the mean; shaded region represents the s.e.m.). h. Quantification of normalized 40 Hz power (n = 5 6-month old VIP-Cre/5XFAD mice; data is presented as mean ± s.e.m.; paired two-tailed t-test was used for analysis). i. Mean EEG power density measured in the visual cortex of VIP-cre during 1 h of multisensory 40 Hz stimulation performed after the injection of either saline or CNO (n = 5 6-month old VIP-Cre/5XFAD mice; mean across mice; shaded area = SEM). j. Normalized 40 Hz EEG power following saline or CNO in visual cortex (n = 5 6-month old VIP-Cre/5XFAD mice; data is presented as the mean ± s.e.m. paired two-tailed t-test was used for analysis). k. Mean EEG power density measured in the somatosensory cortex of VIP-cre during 1 h of multisensory 40 Hz stimulation performed after the injection of either saline or CNO. (Mean across mice; shaded area = SEM). l. Normalized 40 Hz EEG power following saline or CNO in somatosensory cortex (n = 5 6-month old VIP-Cre/5XFAD mice data is presented as the mean ± s.e.m.; paired two-tailed t-test was used for analysis). m. Mean EEG power density measured in the frontal cortex of VIP-cre during 1 h of multisensory 40 Hz stimulation performed after the injection of either saline or CNO (mean across mice; shaded area= SEM). n. Normalized 40 Hz EEG power following saline or CNO in frontal cortex (n = 5 6-month old VIP-Cre/5XFAD mice; data is presented as the mean ± s.e.m.; paired two-tailed t-test was used for analysis). Source Data

Comment in

References

    1. Xie L, et al. Sleep drives metabolite clearance from the adult brain. Science. 2013;342:373–377. doi: 10.1126/science.1241224. - DOI - PMC - PubMed
    1. Iliff JJ, et al. Cerebral arterial pulsation drives paravascular CSF-interstitial fluid exchange in the murine brain. J. Neurosci. 2013;33:18190–18199. doi: 10.1523/JNEUROSCI.1592-13.2013. - DOI - PMC - PubMed
    1. Iliff JJ, et al. A paravascular pathway facilitates CSF flow through the brain parenchyma and the clearance of interstitial solutes, including amyloid. Sci. Transl. Med. 2012;4:147ra111. doi: 10.1126/scitranslmed.3003748. - DOI - PMC - PubMed
    1. Da Mesquita S, et al. Meningeal lymphatics affect microglia responses and anti-Aβ immunotherapy. Nature. 2021;593:255–260. doi: 10.1038/s41586-021-03489-0. - DOI - PMC - PubMed
    1. Iaccarino HF, et al. Gamma frequency entrainment attenuates amyloid load and modifies microglia. Nature. 2016;540:230–235. doi: 10.1038/nature20587. - DOI - PMC - PubMed

MeSH terms