. 2024 Mar;627(8004):646-655.
doi: 10.1038/s41586-024-07121-9. Epub 2024 Feb 28.

Anti-TIGIT antibody improves PD-L1 blockade through myeloid and Treg cells

Affiliations

Anti-TIGIT antibody improves PD-L1 blockade through myeloid and Treg cells

Xiangnan Guan et al. Nature. 2024 Mar.

Erratum in

  • Publisher Correction: Anti-TIGIT antibody improves PD-L1 blockade through myeloid and Treg cells.
    Guan X, Hu R, Choi Y, Srivats S, Nabet BY, Silva J, McGinnis L, Hendricks R, Nutsch K, Banta KL, Duong E, Dunkle A, Chang PS, Han CJ, Mittman S, Molden N, Daggumati P, Connolly W, Johnson M, Abreu DR, Cho BC, Italiano A, Gil-Bazo I, Felip E, Mellman I, Mariathasan S, Shames DS, Meng R, Chiang EY, Johnston RJ, Patil NS. Guan X, et al. Nature. 2024 Mar;627(8005):E11. doi: 10.1038/s41586-024-07280-9. Nature. 2024. PMID: 38480897 No abstract available.
  • Publisher Correction: Anti-TIGIT antibody improves PD-L1 blockade through myeloid and Treg cells.
    Guan X, Hu R, Choi Y, Srivats S, Nabet BY, Silva J, McGinnis L, Hendricks R, Nutsch K, Banta KL, Duong E, Dunkle A, Chang PS, Han CJ, Mittman S, Molden N, Daggumati P, Connolly W, Johnson M, Abreu DR, Cho BC, Italiano A, Gil-Bazo I, Felip E, Mellman I, Mariathasan S, Shames DS, Meng R, Chiang EY, Johnston RJ, Patil NS. Guan X, et al. Nature. 2024 Jun;630(8016):E9. doi: 10.1038/s41586-024-07562-2. Nature. 2024. PMID: 38816613 Free PMC article. No abstract available.
  • Author Correction: Anti-TIGIT antibody improves PD-L1 blockade through myeloid and Treg cells.
    Guan X, Hu R, Choi Y, Srivats S, Nabet BY, Silva J, McGinnis L, Hendricks R, Nutsch K, Banta KL, Duong E, Dunkle A, Chang PS, Han CJ, Mittman S, Molden N, Daggumati P, Connolly W, Johnson M, Abreu DR, Cho BC, Italiano A, Gil-Bazo I, Felip E, Mellman I, Mariathasan S, Shames DS, Meng R, Chiang EY, Johnston RJ, Patil NS. Guan X, et al. Nature. 2024 Sep;633(8030):E1. doi: 10.1038/s41586-024-07956-2. Nature. 2024. PMID: 39164390 Free PMC article. No abstract available.

Abstract

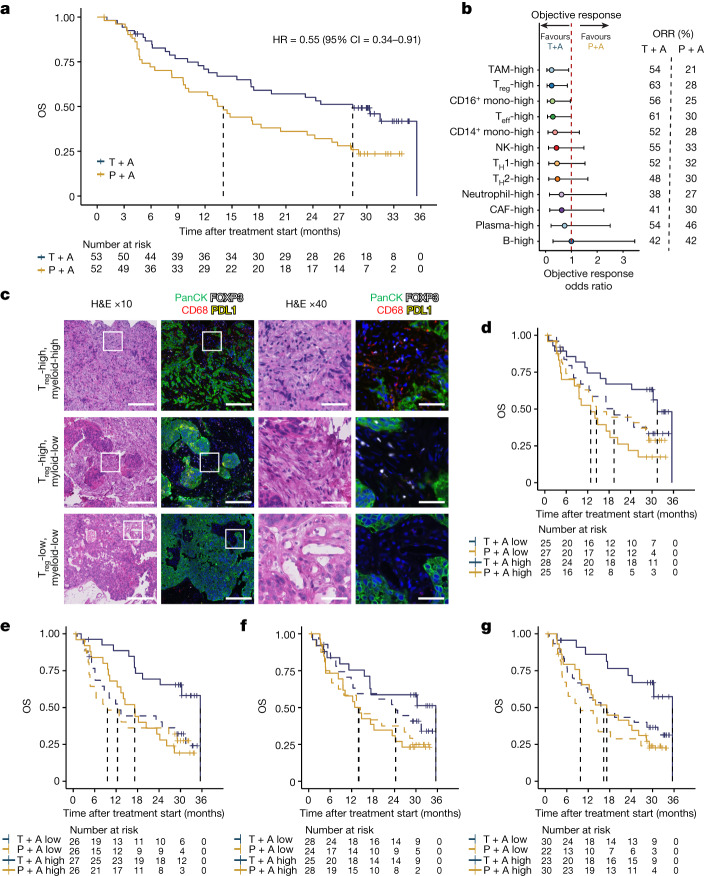
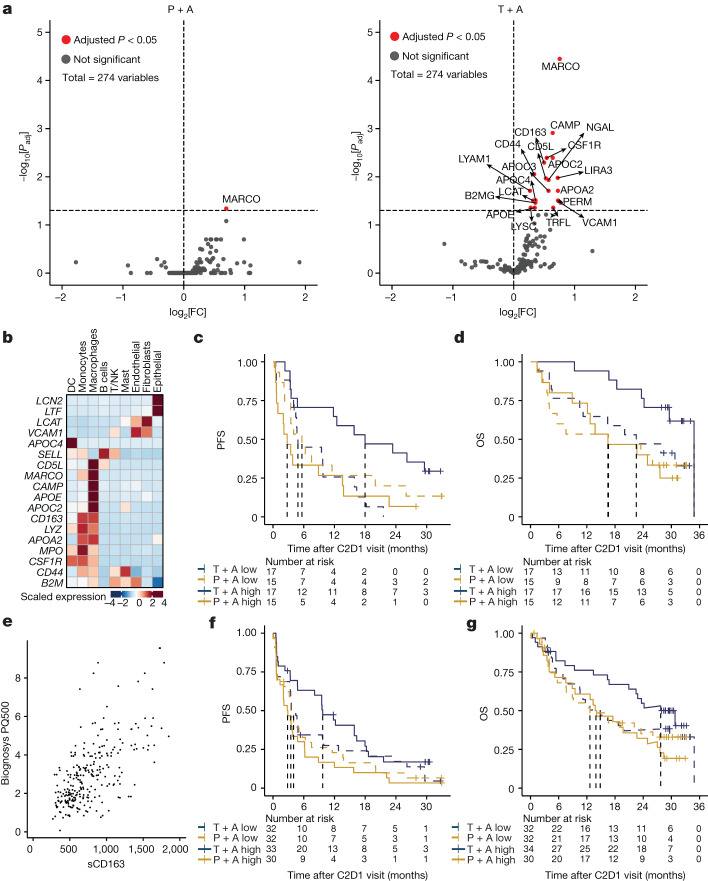
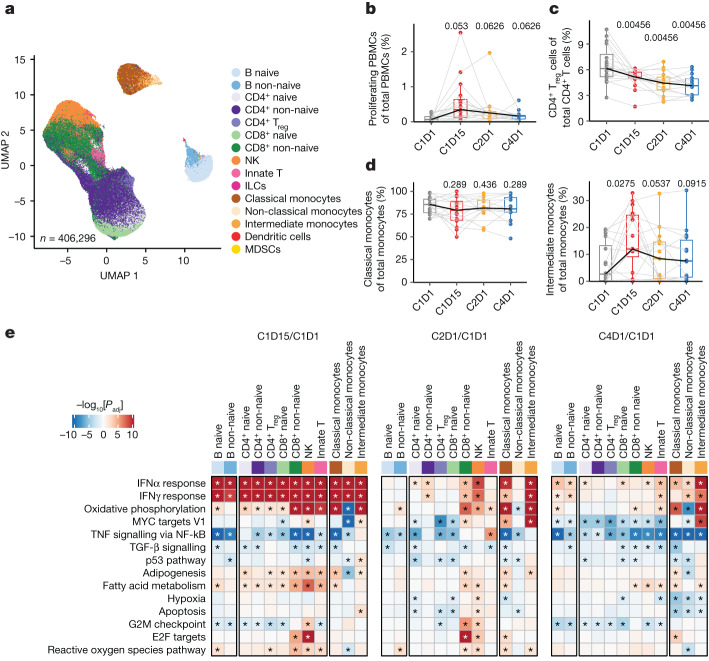
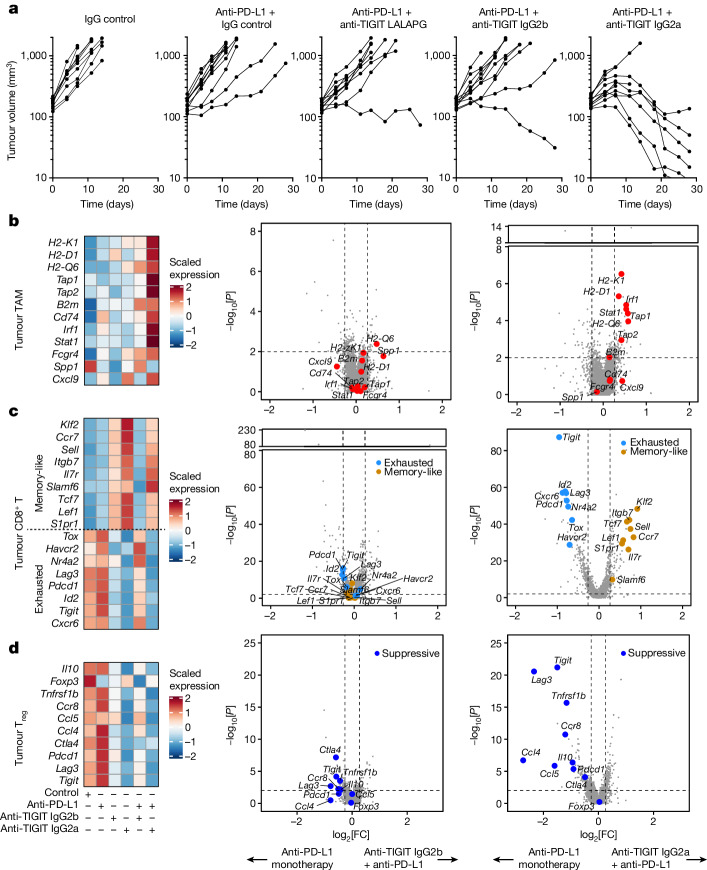
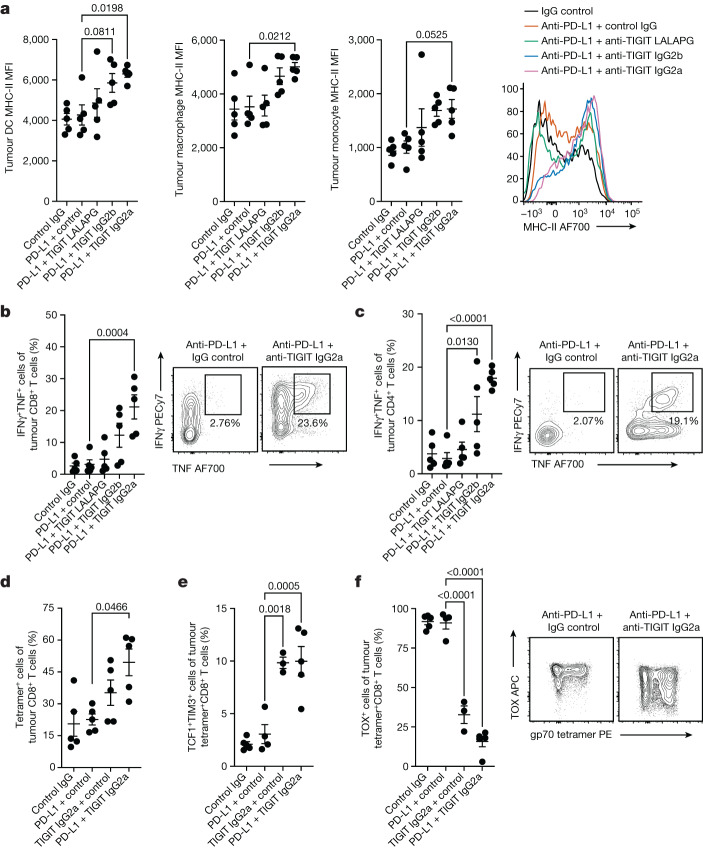
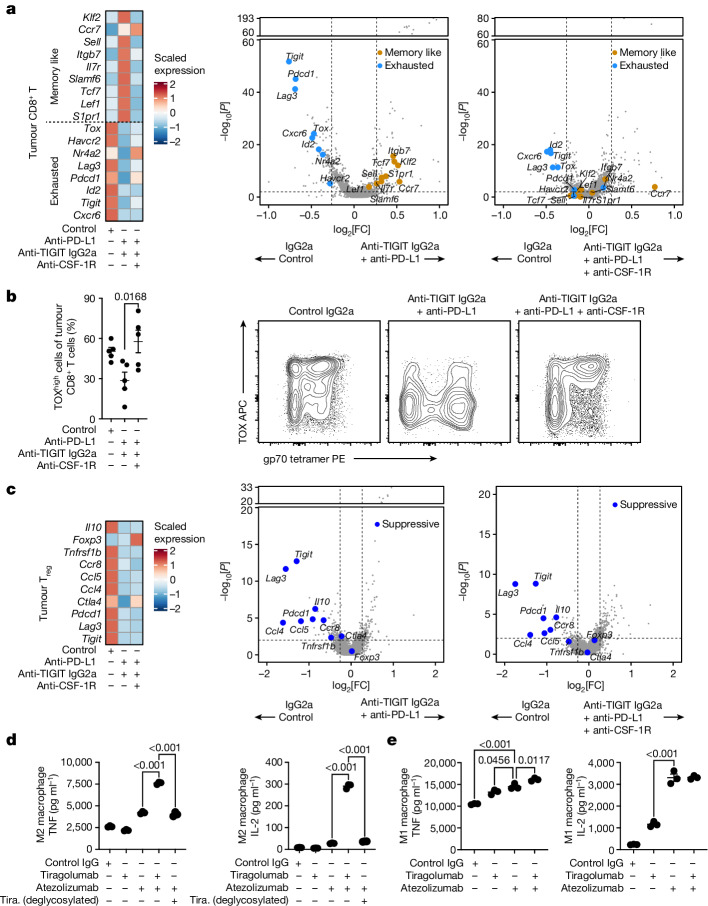
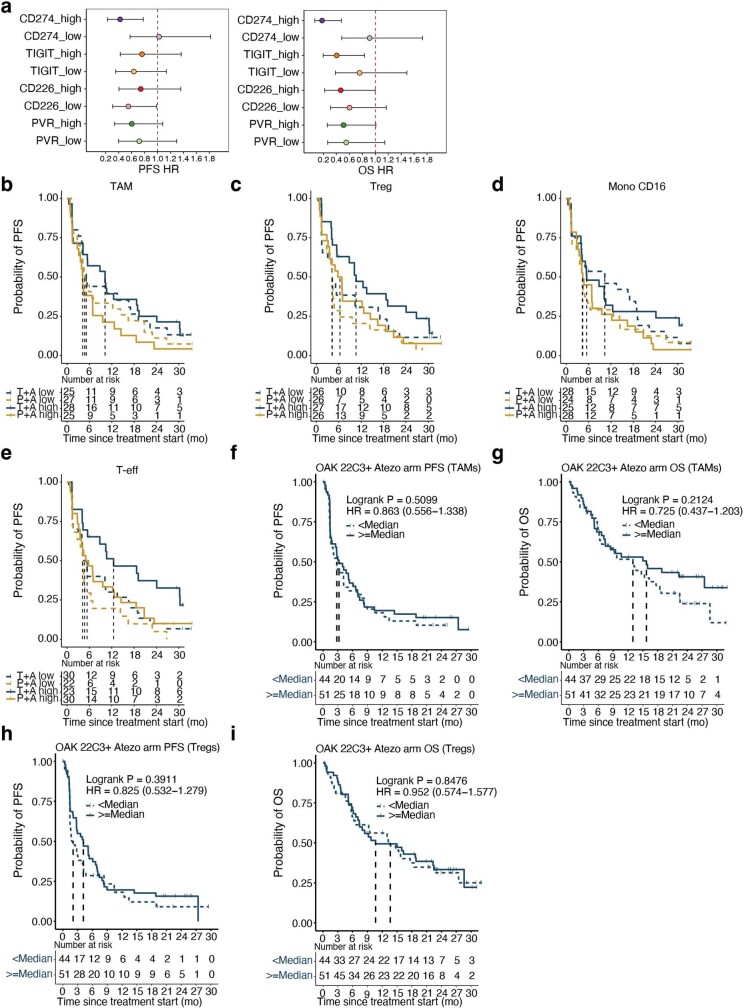
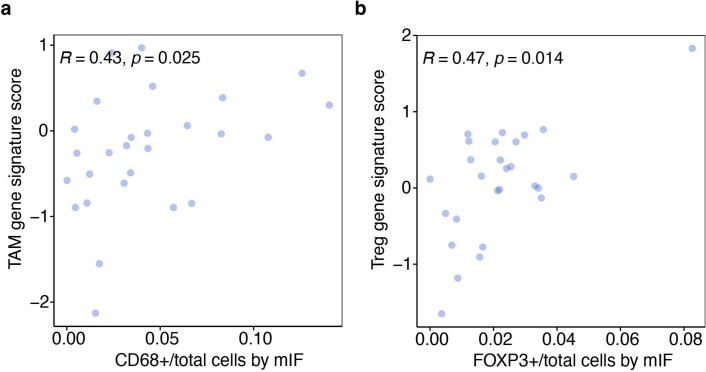
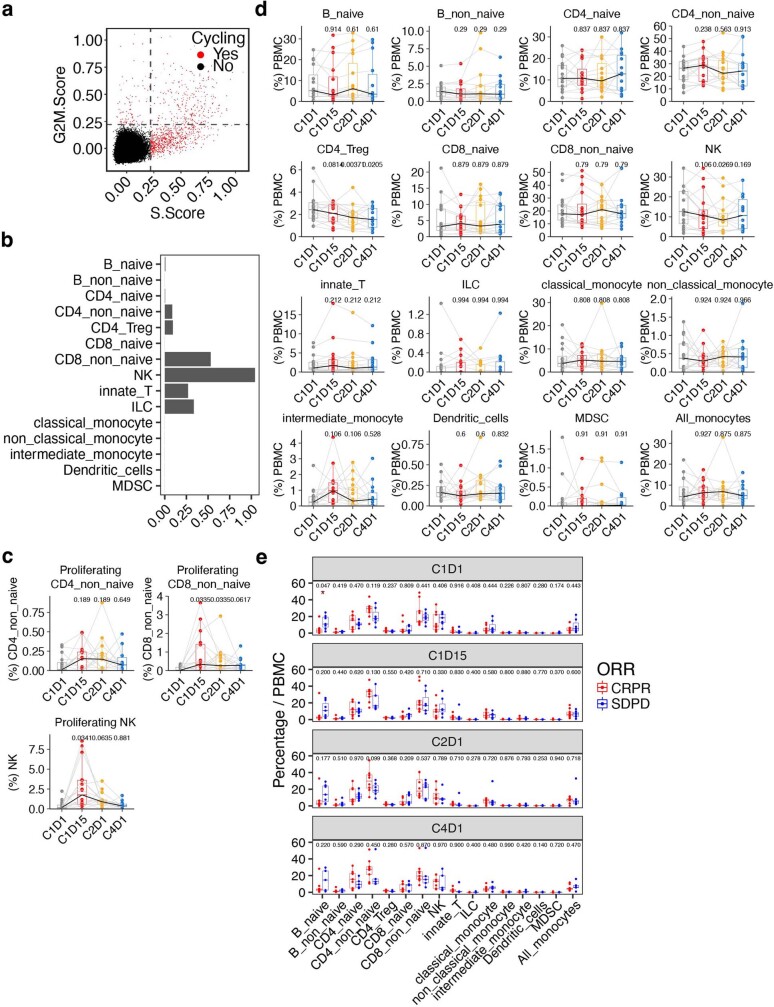
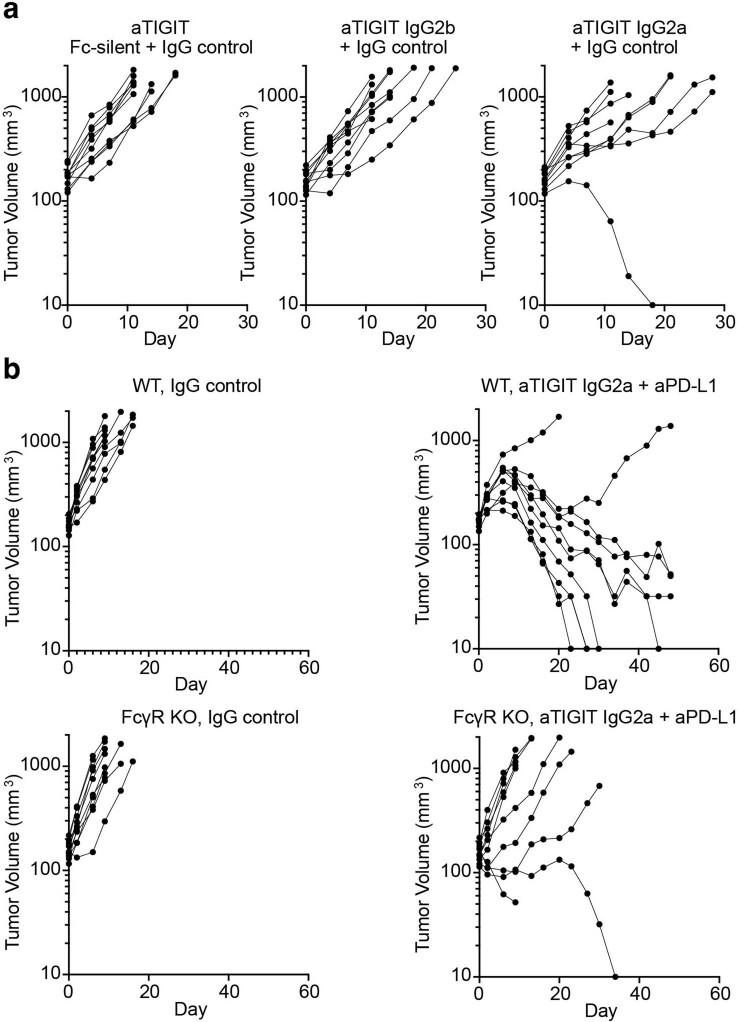
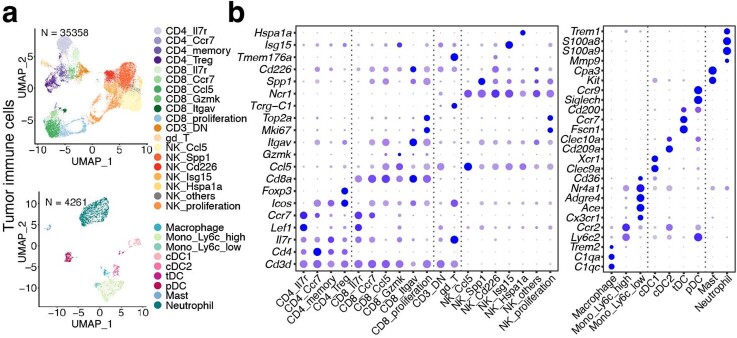
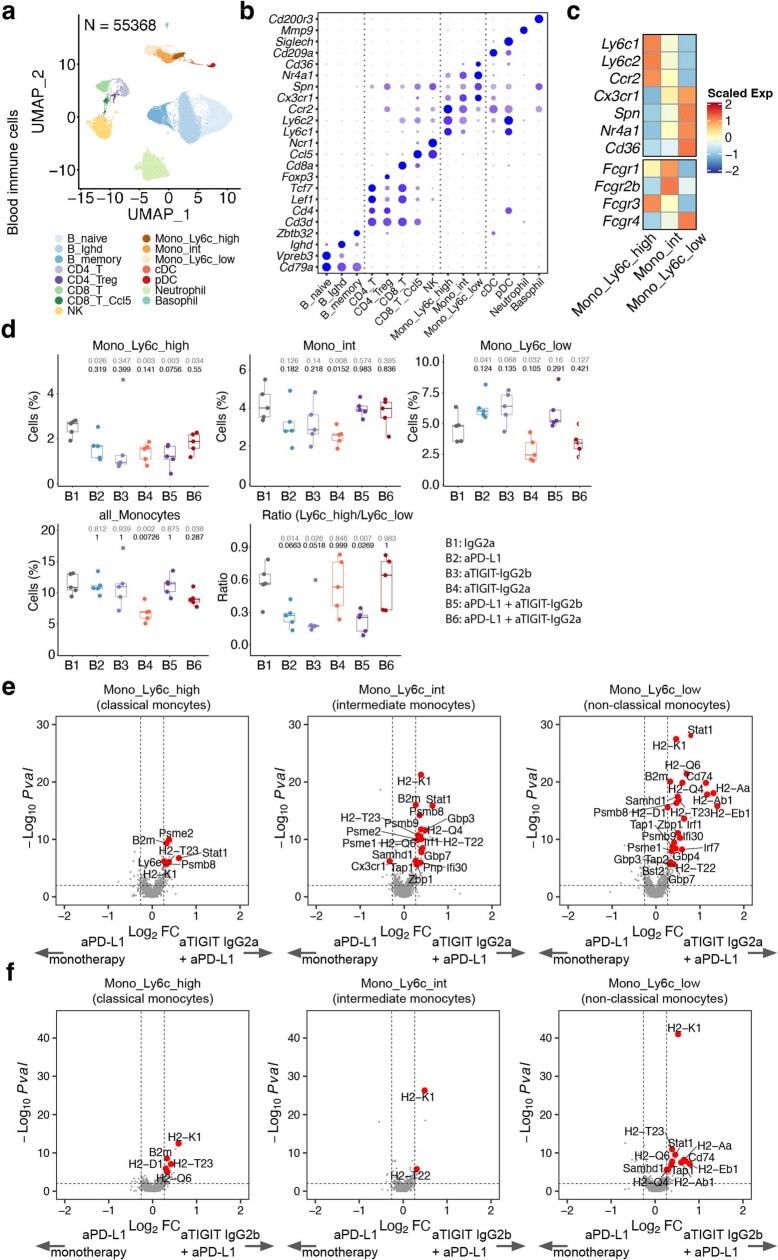
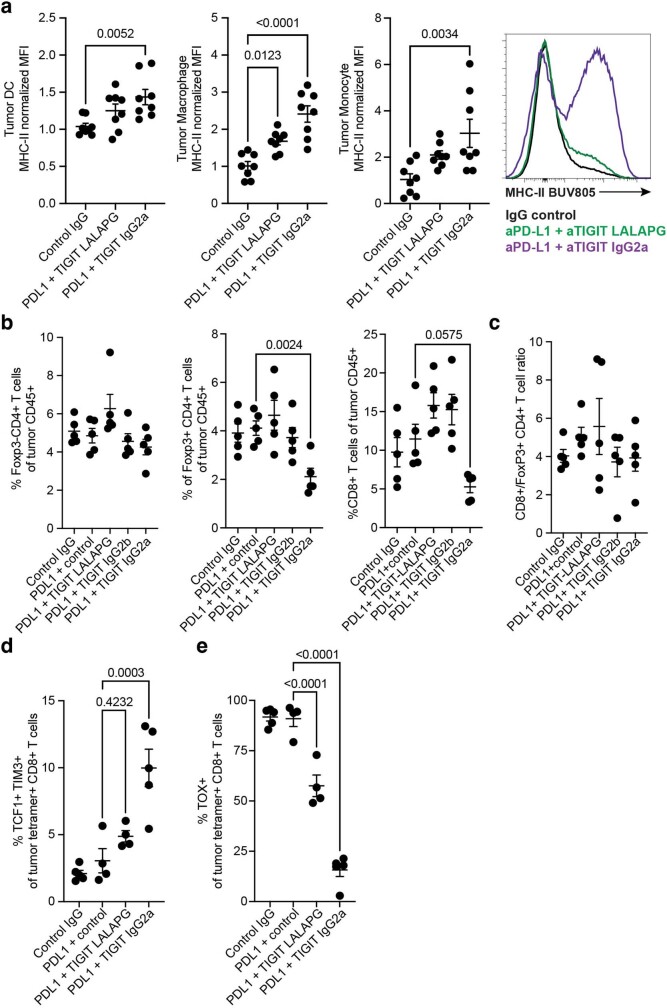
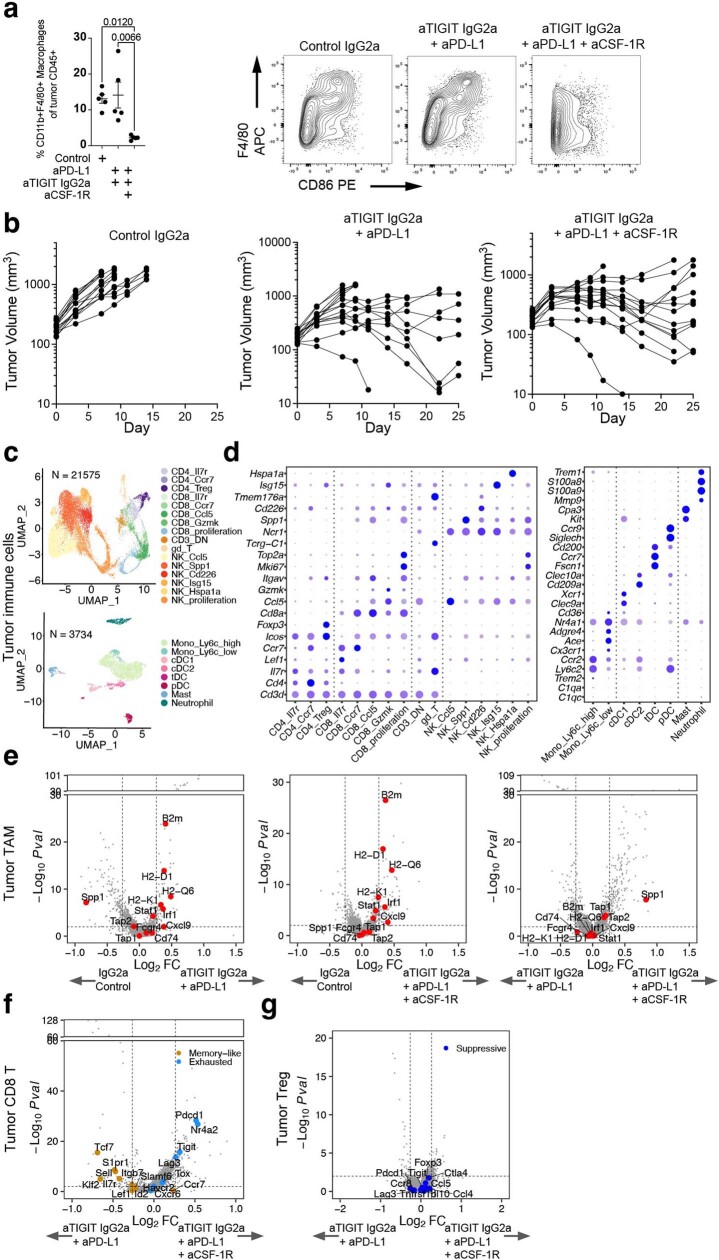
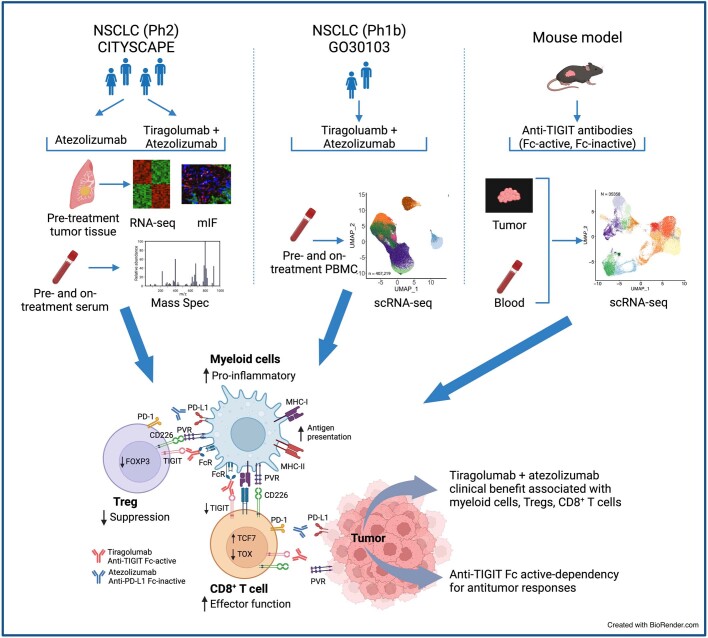
Tiragolumab, an anti-TIGIT antibody with an active IgG1κ Fc, demonstrated improved outcomes in the phase 2 CITYSCAPE trial (ClinicalTrials.gov: NCT03563716 ) when combined with atezolizumab (anti-PD-L1) versus atezolizumab alone1. However, there remains little consensus on the mechanism(s) of response with this combination2. Here we find that a high baseline of intratumoural macrophages and regulatory T cells is associated with better outcomes in patients treated with atezolizumab plus tiragolumab but not with atezolizumab alone. Serum sample analysis revealed that macrophage activation is associated with a clinical benefit in patients who received the combination treatment. In mouse tumour models, tiragolumab surrogate antibodies inflamed tumour-associated macrophages, monocytes and dendritic cells through Fcγ receptors (FcγR), in turn driving anti-tumour CD8+ T cells from an exhausted effector-like state to a more memory-like state. These results reveal a mechanism of action through which TIGIT checkpoint inhibitors can remodel immunosuppressive tumour microenvironments, and suggest that FcγR engagement is an important consideration in anti-TIGIT antibody development.


Conflict of interest statement

X.G., R. Hu, Y.C., S.S., B.Y.N., J.S., L.M., R. Hendricks, K.N., K.L.B., E.D., A.D., P.S.C., J.H., S. Mittman, N.M., P.D., W.C., I.M., S. Mariathasan, D.S.S., R.M., E.Y.C., R.J.J. and N.S.P. are employees and stockholders of Roche/Genentech. M.J. declares research funding (paid to institution) from AbbVie, Acerta, Adaptimmune, Amgen, Apexigen, Arcus Biosciences, Array BioPharma, ArriVent BioPharma, Artios Pharma, AstraZeneca, Atreca, BeiGene, BerGenBio, BioAtla, Black Diamond, Boehringer Ingelheim, Bristol-Myers Squibb, Calithera Biosciences, Carisma Therapeutics, Checkpoint Therapeutics, City of Hope National Medical Center, Corvus Pharmaceuticals, Curis, CytomX, Daiichi Sankyo, Dracen Pharmaceuticals, Dynavax, Lilly, Eikon Therapeutics, Elicio Therapeutics, EMD Serono, EQRx, Erasca, Exelixis, Fate Therapeutics, Genentech/Roche, Genmab, Genocea Biosciences, GlaxoSmithKline, Gritstone Oncology, Guardant Health, Harpoon, Helsinn Healthcare SA, Hengrui Therapeutics, Hutchison MediPharma, IDEAYA Biosciences, IGM Biosciences, Immunitas Therapeutics, Immunocore, Incyte, Janssen, Jounce Therapeutics, Kadmon Pharmaceuticals, Kartos Therapeutics, LockBody Therapeutics, Loxo Oncology, Lycera, Memorial Sloan-Kettering, Merck, Merus, Mirati Therapeutics, Mythic Therapeutics, NeoImmune Tech, Neovia Oncology, Novartis, Numab Therapeutics, Nuvalent, OncoMed Pharmaceuticals, Palleon Pharmaceuticals, Pfizer, PMV Pharmaceuticals, Rain Therapeutics, RasCal Therapeutics, Regeneron Pharmaceuticals, Relay Therapeutics, Revolution Medicines, Ribon Therapeutics, Rubius Therapeutics, Sanofi, Seven and Eight Biopharmaceuticals/Birdie Biopharmaceuticals, Shattuck Labs, Silicon Therapeutics, Stem CentRx, Syndax Pharmaceuticals, Taiho Oncology, Takeda Pharmaceuticals, Tarveda, TCR2 Therapeutics, Tempest Therapeutics, Tizona Therapeutics, TMUNITY Therapeutics, Turning Point Therapeutics, University of Michigan, Vyriad, WindMIL Therapeutics and Y-mAbs Therapeutics; and consulting/advisory roles (paid to institution) for AbbVie, Amgen, Arcus Biosciences, Arrivent, Astellas, AstraZeneca, Boehringer Ingelheim, Bristol-Myers Squibb, Calithera Biosciences, D3 Bio Limited, Daiichi Sankyo, Fate Therapeutics, Genentech/Roche, Genmab, Genocea Biosciences, Gilead Sciences, GlaxoSmithKline, Gritstone Oncology, Hookipa Biotech, Immunocore, Janssen, Jazz Pharmaceuticals, Lilly, Merck, Mirati Therapeutics, Molecular Axiom, Normunity, Novartis, Novocure, Pfizer, Pyramid Biosciences, Revolution Medicines, Sanofi-Aventis, SeaGen, Synthekine, Takeda Pharmaceuticals and VBL Therapeutics. D.R.A. reports personal payment/honoraria from Roche, AstraZeneca, Bristol-Myers Squibb, Merck Sharp & Dohme, Eli Lilly, Pfizer, and Novartis; and institutional support for attending meetings or travel from Roche, Bristol-Myers Squibb, Merck Sharp & Dohme and Novartis. BCC declares royalties from Champions Oncology, Crown Bioscience, Imagen and PearlRiver Bio; grants/research support/funding from MOGAM Institute, LG Chem, Oscotec, Interpark Bio Convergence Corp, GIInnovation, GI-Cell, Abion, Abbvie, AstraZeneca, Bayer, Blueprint Medicines, Boehringer Ingelheim, Champions Oncology, CJ Bioscience, CJ Blossom Park, Cyrus, Dizal Pharma, Genexine, Janssen, Lilly, MSD, Novartis, Nuvalent, Oncternal, Ono, Regeneron, Dong-A ST, Bridgebio Therapeutics, Yuhan, ImmuneOncia, Illumina, Kanaph Therapeutics, Therapex, JINTSbio, Hanmi, CHA Bundang Medical Center and Vertical Bio AG; consultancy roles for Abion, BeiGene, Novartis, AstraZeneca, Boehringer-Ingelheim, Roche, BMS, CJ, CureLogen, Cyrus Therapeutics, Ono, Onegene Biotechnology, Yuhan, Pfizer, Eli Lilly, GI-Cell, Guardant, HK Inno-N, Imnewrun Biosciences, Janssen, Takeda, MSD, Medpacto, Blueprint medicines, RandBio and Hanmi; employment from Yonsei University Health System; participation on an advisory board for KANAPH Therapeutic, Bridgebio Therapeutics, Cyrus Therapeutics, Guardant Health, Oscotec, J INTS Bio, Therapex, Gliead and Amgen; speaker roles for ASCO, AstraZeneca, Guardant, Roche, ESMO, IASLC, Korean Cancer Association, Korean Society of Medical Onoclogy, Korean Society of Thyroid-Head and Neck Surgery, Korean Cancer Study Group, Novartis, MSD, The Chinese Thoracic Oncology Society and Pfizer; stocks/shares in TheraCanVac, Gencurix, Bridgebio Therapeutics, KANAPH Therapeutic, Cyrus Therapeutics, Interpark Bio Convergence and J INTS BIO; founder for DAAN Biotherapeutics; and member of the board of directors for J INTS BIO. A.I. declares grants and/or consulting fees from BMS, MSD, Roche, Bayer and AstraZeneca. I.G.-B. declares clinical investigator, advisory board, speaker and director of scientific meeting roles for Roche/Genentech; and financial support from Roche/Genentech. E.F. declares advisory board/speaker roles for Abbvie, Amgen, Astra Zeneca, Bayer, Beigene, Boehringer Ingelheim, Bristol Myers Squibb, Daiichi Sankyo, Eli Lilly, F. Hoffmann-La Roche, Genentech, Gilead, Glaxo Smith Kline, Janssen, Medscape, Merck Serono, Merck Sharp & Dohme, Novartis, Peervoice, Peptomyc, Pfizer, Regeneron, Sanofi, Takeda, Touch Oncology and Turning Point Therapeutics; and independent member of the board for Grifols.

Figures

Fig. 1
Fig. 1. Intratumoural myeloid and Treg cell content is associated with patient benefit after combination treatment with tiragolumab plus atezolizumab in the CITYSCAPE trial.
a, Kaplan–Meier curve comparing the OS of patients in the BEP who received tiragolumab + atezolizumab (blue) or placebo + atezolizumab (gold). b, Comparison of the overall objective response odds ratio of tiragolumab + atezolizumab versus placebo + atezolizumab in patients whose tumours had high cell type abundance. Intratumoural cell types were determined as high or low on the basis of the median signature score cut-offs. Odds ratio calculations were performed using Fisher’s exact tests. The dots represent the objective response odds ratio and the horizontal bars show the 95% CI. c, Multiplex immunofluorescence staining of pan-cytokeratin (panCK; green), FOXP3 (white), CD68 (red), and PD-L1 (yellow) in CITYSCAPE patient tumour samples (n = 27). Representative images are shown for Treg-high/myeloid-high (top), Treg-high/myeloid-low (middle) and Treg-low/myeloid-low (bottom). Scale bars, 200 μm (columns 1 and 2) and 50 μm (columns 3 and 4). H&E, haematoxylin and eosin. dg, Kaplan–Meier curves comparing the OS in patients with tumours enriched (solid lines) or not enriched (dashed lines) for the top four cell types in b, including TAMs (d), Treg cells (e), CD16+ monocytes (f) and CD8+ T effector (Teff) cells (g), that were associated with response to tiragolumab + atezolizumab. Enrichment or not was determined by the median cell type signature score cut-offs. For a and dg, HRs and 95% CIs were determined using a univariate Cox model. CAFs, cancer-associated fibroblasts; mono, monocytes; P + A, placebo + atezolizumab; T + A, tiragolumab + atezolizumab; TH, T helper cells.
Fig. 2
Fig. 2. Treatment with tiragolumab plus atezolizumab leads to increased serum myeloid proteins.
a, Differential abundance analysis of serum proteins at C2D1 relative to the baseline in patients who were treated with placebo + atezolizumab (left) or tiragolumab + atezolizumab (right). Statistical analysis was performed using limma with Benjamini–Hochberg correction. FC, fold change; Padj, adjusted P. b, The gene expression profiles of the significantly increased proteins in a based on a public NSCLC scRNA-seq dataset, suggesting a myeloid cell origin for most of these proteins, including NGAL (LCN2), TRFL (LTF), LCAT, VCAM1, APOC4, LYAM1 (SELL), CD5L, MARCO, CAMP, APOE, APOC2, CD163, LYSC (LYZ), APOA2, PERM (MPO), CSF-1R, CD44, B2MG (B2M); for protein–gene pairs that have distinct names, the gene names are shown in parentheses in italics. c,d, Kaplan–Meier curves of PFS (c) and OS (d) in patients with low (dashed lines) or high (solid lines) levels of serum myeloid proteins at C2D1 relative to C1D1 using a composite of significantly increased myeloid proteins (MARCO, CAMP, CD163, CSF-1R, CD5L, NGAL (LCN2), GAPR1, APOC1, APOC2, APOC3 and APOC4), as determined by the median composite score cut-off. e, The correlation between sCD163 levels by ELISA and CD163 detected by mass spectrometry. n = 266. Statistical analysis was performed using two-tailed Pearson correlation; r = 0.657, P < 2.2 × 10−16. f,g, Kaplan–Meier curves of the PFS (f) and OS (g) in patients with a low (dashed lines) and high (solid lines) fold change in sCD163 at C2D1 relative to C1D1, as determined by the median fold-change cut-off. For c,d,f,g, HRs and 95% CIs were determined using a univariate Cox model. DCs, dendritic cells. Source Data
Fig. 3
Fig. 3. Tiragolumab plus atezolizumab leads to T, NK and myeloid cell activation in PBMCs.
a, Uniform manifold approximation and projection (UMAP) analysis of PBMC single cells coloured by cell types. n = 406,296. b, The proportion of proliferating cells in PBMCs over different timepoints. n = 16. c, The proportion of Treg cells out of total CD4+ T cells over different timepoints. n = 16. d, The proportion of classical monocytes (left) and intermediate monocytes (right) out of total monocytes over different timepoints. n = 16. e, Pathway enrichment in PBMC samples obtained on-treatment compared with those obtained at the baseline across multiple immune cell types from patients with NSCLC. n = 16. Enrichment in on-treatment (red) and baseline (blue) samples is indicated. P values were calculated using nonparametric permutation tests; the asterisks represent false-discovery rate < 0.05. For the box plots in bd, the centre line shows the median, the box limits show the interquartile range (IQR; the range between the 25th and 75th percentile) and the whiskers show 1.58 × IQR. Median values per timepoint are connected by solid black lines; samples from the same patient are connected by grey lines. P values were calculated using two-tailed paired Student’s t-tests and adjusted using the Benjamini–Hochberg procedure. ILCs, innate lymphoid cells; MDSCs, myeloid-derived suppressor cells. Source Data
Fig. 4
Fig. 4. Fc receptor engagement supports tiragolumab surrogate efficacy and ability to remodel the tumour microenvironment in mice.
a, Growth of CT26 tumours in syngeneic BALB/c mice under various treatments. Data are representative of two or more independent experiments with n = 10 mice in each group. bd, Heat maps of the expression of selected genes across different treatments in tumour macrophages and monocytes combined (b; left), tumour CD8+ T cells combined (c; left) and tumour CD4+ Treg cells (d; left). Volcano plots showing gene expression for anti-PD-L1 + anti-TIGIT IgG2b versus anti-PD-L1 (middle), and anti-PD-L1 + anti-TIGIT IgG2a versus anti-PD-L1 (right) in tumour macrophages and monocytes combined (b), tumour CD8+ T cells combined (c) and tumour CD4+ Treg cells (d). For the volcano plots in bd, the broken y axis was used to make the y-axis range comparable and for better comparison between treatments. P values were calculated using two-tailed Wilcoxon rank-sum tests. Source Data
Fig. 5
Fig. 5. Flow cytometry analysis of anti-TIGIT antibody activity on tumour myeloid cells and lymphocytes.
a, The mean fluorescence intensity (MFI) of cell surface MHC-II on tumour-infiltrating dendritic cells (left), macrophages (left middle) and monocytes (right middle). Right, histogram of representative surface MHC-II expression on tumour monocytes after various treatments. b, IFNγ and TNF co-expression in tumour-infiltrating CD8+ T cells after ex vivo stimulation (left). Right, representative fluorescence-activated cell sorting (FACS) analysis of tumour CD8+ T cell cytokine production after treatment with anti-PD-L1 monotherapy or anti-PD-L1 + anti-TIGIT IgG2a. c, IFNγ and TNF co-expression in tumour-infiltrating CD4+ T cells after ex vivo stimulation (left). Right, representative FACS analysis of CD4+ T cell cytokine production after treatment with anti-PD-L1 monotherapy or anti-PD-L1 + anti-TIGIT IgG2a. d, The frequency of gp70-tetramer-binding tumour CD8+ T cells. e, The frequencies of memory-like TCF1+TIM3+ gp70-tetramer-binding tumour CD8+ T cells. f, The frequencies of TOX+ gp70-tetramer-binding tumour CD8+ T cells (left). Right, representative FACS plots of tumour CD8+ T cell TOX expression and gp70 tetramer binding after treatment with anti-PD-L1 monotherapy or anti-PD-L1 + anti-TIGIT IgG2a. Intratumoural CD45+ cells were analysed using flow cytometry at day 3 after treatment (ac) and gp70-tetramer-positive T cells at day 7 after treatment (df). Data are representative of one (ac) or two (df) independent experiments with n = 5 mice in each group. For af, data are mean ± s.e.m. Statistical analysis was performed using one-way analysis of variance (ANOVA) with Dunnett’s multiple-comparison test, with the anti-PD-L1 monotherapy group designated as the control group. Source Data
Fig. 6
Fig. 6. Macrophages enable modulation of CD8+ T cells by Fc-active anti-TIGIT antibodies in vivo and in vitro.
a, Heat map showing the expression of selected genes across treatments in tumour CD8+ T cells (left). Volcano plots showing gene expression of tumour CD8+ T cells for anti-PD-L1 + anti-TIGIT IgG2a versus control IgG (middle) and anti-PD-L1 + anti-TIGIT IgG2a + anti-CSF-1R versus control IgG (right). b, The frequency of terminally differentiated TOXhigh gp70-tetramer-binding tumour CD8+ T cells as measured using flow cytometry (left). Data are mean ± s.e.m. Statistical analysis was performed using one-way ANOVA with Dunnett’s multiple-comparison test, with the anti-PD-L1 + anti-TIGIT IgG2a group designated as the control group. Right, representative FACS plots from day 7 after treatment from two independent experiments (n = 5 mice) per group. c, The expression of selected genes across treatments in tumour CD4+ Treg cells (left). Volcano plots showing gene expression of tumour CD4+ Treg cells for anti-PD-L1 + anti-TIGIT IgG2a versus control IgG (middle) and anti-PD-L1 + anti-TIGIT IgG2a + anti-CSF-1R versus control IgG (right). For a,c, scRNA-seq analysis of intratumoural CD45+ cells at day 3 after treatment was from one independent experiment (n = 5 mice per group). In the volcano plots, the broken y axis was used to make the y-axis range comparable between treatments. P values were calculated using two-tailed Wilcoxon rank-sum tests (a,c). d,e, The effects of atezolizumab and tiragolumab (tira.) on the co-cultures of CMV-responsive PBMC T cells and M2-polarized (d) or M1-polarized (e) monocyte-derived macrophages as measured by TNF and IL-2 in the supernatant. Data are mean ± s.e.m., representative of two independent experiments with three PBMC donors per experiment. P values were calculated using one-way ANOVA with Tukey’s multiple-comparison test. Source Data
Extended Data Fig. 1
Extended Data Fig. 1. Intratumoural myeloid and Treg cell content correlates with tiragolumab plus atezolizumab outcome but not placebo plus atezolizumab.
a, Forest plot comparing tiragolumab plus atezolizumab versus placebo plus atezolizumab in patients with tumours expressing high or low gene levels (cutoff by median expression) of CD274, TIGIT, CD226, and PVR in CITYSCAPE. Hazard ratio and 95% confidence interval were determined using univariate Cox model. The dots represent the hazard ratio and the horizontal bars the 95% confidence interval. b–e, Kaplan–Meier curves comparing PFS in patients with tumours enriched (solid lines) or not enriched (dashed lines) for TAMs (b), Tregs (c), CD16-high monocytes (d), and CD8 + T effector cells (T-eff) (e). Enrichment or not was determined by the median cell type signature score cutoffs. f, g, Kaplan–Meier curves comparing the PFS (f) and OS (g) in PD-L1-positive patients from the phase 3 NSCLC OAK study who received atezolizumab monotherapy and had tumours enriched for TAMs. h, i, Kaplan–Meier curves comparing the PFS (h) and OS (i) in PD-L1-positive patients from the phase 3 NSCLC OAK study who received atezolizumab monotherapy and had tumours enriched for Tregs. f-i, Hazard ratio and 95% confidence interval were determined using univariate Cox model, and P values were estimated using the log-rank test.
Extended Data Fig. 2
Extended Data Fig. 2. Correlation of bulk RNA-seq-based cell type signature scores with multiplex immunofluorescence.
a, b, Correlation of TAM signature with CD68+ cells by mIF (a) and Treg signature with FoxP3+ cells by mIF (b). Two-tailed Pearson correlation; n = 27. mIF, multiplex immunofluorescence.
Extended Data Fig. 3
Extended Data Fig. 3. The proportion of proliferation cells and major cell types in PBMC.
a, Scatter plot showing the S and G2M cell cycle phase scores, coloured by cells in proliferating (red) or non-proliferating states (black). b, Bar plot showing the proportion of proliferating cells in each major cell type. c, Box plots showing the proportion of proliferating cells in CD4_non_naive, CD8_non_naive, and NK cells, across each timepoint. d, Box plots comparing the proportions of each cell type at on-treatment (C1D15, C2D1, and C4D1) versus baseline (C1D1). e, Box plots comparing the proportions of each cell type between responders and non-responders at baseline (C1D1) and on-treatment (C1D15, C2D1, and C4D1). c-e, Boxplot center line, median; box, interquartile range (IQR; the range between the 25th and 75th percentile); whiskers, 1.58 × IQR. c,d, Median values per time point are connected by solid black lines; samples from the same patient at different time points are connected by grey lines. c-d, P values shown were calculated by two-tailed paired Student’s t-test and BH-adjusted. e, Nominal P values derived from two-tailed unpaired Student t-test are shown and red asterisk represents significance levels where * P < 0.05. c-e, n = 16 patients. Source Data
Extended Data Fig. 4
Extended Data Fig. 4. Efficient tumour rejection by anti-PD-L1 and anti-TIGIT mAbs treatment depends on functional Fc-FcɣR interaction axis.
a, Plots depicting tumour volumes in each mouse over time; data are representative of one independent experiment. Wildtype BALB/c mice were implanted with CT26 tumours and then treated as described in the method. b, Plots depicting tumour volumes in each mouse over time; data are representative of one independent experiment. Wildtype (top) and FcɣR knockout (bottom) BALB/c mice were implanted with CT26 tumours and then treated as described in the method. Source Data
Extended Data Fig. 5
Extended Data Fig. 5. anti-TIGIT treatment modulation of tumour infiltrating immune cells and peripheral blood monocytes depends on the Fc region.
a, UMAP of single cells from tumour infiltrating T and NK cells (top, n = 21,407) and myeloid cells (bottom, n = 5,352) coloured by cell types. b, Bubble plots showing marker gene expression for T and NK cells (left) and myeloid cells (right) as shown in (a).c-e, Heatmaps showing the expression of selected genes across different treatments in tumour macrophages and monocytes combined (c), tumour CD8 + T cells combined (d), and tumour CD4+ Tregs (e). f, UMAP of single cells from the peripheral blood (n = 26,174) coloured by cell types. g, Bubble plots showing the marker gene expression of cell types as in (f). h, Heatmap displaying the scaled gene expression of marker genes distinguishing classical, non-classical, and intermediate monocytes, and the expression patterns of FcɣR. i, Heatmap showing the scaled gene expression of MHC and interferon response in non-classical monocytes across different treatments. a-i, Single cell RNA-seq was performed on intratumoural (a-e) and peripheral (f-i) CD45+ cells isolated at day 3 after treatment, and data are from one independent experiment with n = 5 mice in each group. Source Data
Extended Data Fig. 6
Extended Data Fig. 6. Annotation of single cells collected from mouse tumours.
Single cell RNA-seq was performed on intratumoural CD45+ cells isolated from tumours at day 3 after treatment, and data are from one independent experiment with n = 5 mice in each group. This is related to Fig. 4b–d. a, UMAP of tumour-infiltrating lymphocytes (top, n = 35,358) and myeloid (bottom, n = 4,261) cells coloured by cell types. b, Bubble plots showing marker gene expression for T and NK cells (left) and myeloid cells (right) as shown in (a). Source Data
Extended Data Fig. 7
Extended Data Fig. 7. The modulation effects of anti-PD-L1 + anti-TIGIT on peripheral blood monocytes depends on the anti-TIGIT mAb Fc region.
a, UMAP of single cells from the peripheral blood cells (n = 55,368) coloured by cell types. b, Bubble plot showing the marker gene expression of cell types as in (a). c, Heatmap displaying the scaled gene expression of marker genes distinguishing classical, non-classical, and intermediate monocytes, and the expression patterns of FcɣR. d, Box plots comparing cell proportions of different treatments versus IgG2a isotype control (B1). B2, aPD-L1; B3, aTIGIT-IgG2b; B4, aTIGIT-IgG2a; B5, aPD-L1 + aTIGIT-IgG2b; B6, aPD-L1 + aTIGIT-IgG2a. Boxplot center line, median; box, interquartile range (IQR; the range between the 25th and 75th percentile); whiskers, 1.58 × IQR. Normal P values by two-tailed unpaired Student’s t-test are shown in grey colour; adjusted P values by Dunnett’s multiple comparison were shown in black colour. e, f, Volcano plots showing the gene expression of anti-PD-L1 + anti-TIGIT IgG2a versus anti-PD-L1 (e), and anti-PD-L1 + anti-TIGIT-IgG2b versus anti-PD-L1 (f) in peripheral blood classical (left), intermediate (middle), and non-classical (right) monocytes. P values were calculated by two-tailed Wilcoxon rank-sum test. a-f, Single cell RNA-seq was performed on peripheral CD45+ cells isolated at day 3 after treatment, and data are from one independent experiment with n = 5 mice in each group. Source Data
Extended Data Fig. 8
Extended Data Fig. 8. Flow cytometry analysis of anti-TIGIT activity in tumour myeloid cells of E0771 model, and T cells of CT26 model.
a, Mean fluorescence intensity (MFI) of cell surface MHC-II on tumour-infiltrating dendritic cells (DC, left), macrophages (middle), and monocytes (right), normalized to their respective median MFI value following control treatment. Far right, histogram of representative surface MHC-II expression on tumour monocytes following various treatments. E0771-bearing C57BL/6 J mice were treated as indicated and data were collected at day 7 after treatment. Data are a composite of two independent experiments with n = 4 mice in each group; shown are mean +/− SEM with one-way ANOVA with Dunnett’s multiple comparisons, with the Control IgG group designated as the control group. b, Frequencies of tumour-infiltrating FoxP3- non-Treg CD4 + T cells (left), FoxP3+ Treg CD4 + T cells (middle), and CD8 + T cells (right) out of total CD45+ cells. c, Ratio of tumour CD8 + T cells to FoxP3+ Treg CD4 + T cells. d, e, Additional data related to Fig. 5e,f. Frequencies of TCF1 + TIM3+ memory-like T cells (d) and TOX+ terminally differentiated effector T cells (e) in CT26-tumour bearing mice treated with control and anti-PD-L1 plus anti-TIGIT mIgG2a-LALAPG or mIgG2a antibodies. b-e, Intratumoural CD45+ cells were analysed by flow cytometry at day 3 after treatment (b, c) and gp70 tetramer positive T cells at day 7 after treatment (d, e). Data are representative of one (b, c) or two (d, e) independent experiments with n = 5 mice in each group. b-e, Data in the dot plots are mean +/− SEM with one-way ANOVA with Dunnett’s multiple comparisons, with the anti-PD-L1 monotherapy group designated as the control group. Source Data
Extended Data Fig. 9
Extended Data Fig. 9. Tumour infiltrating leukocyte FACS and scRNA-seq analysis following treatment with anti-PD-L1, anti-TIGIT, and anti-CSF-1R.
a, Percentage of tumour macrophages (left) and representative FACS plots of tumour CD11b+ cell expression of F4/80 and CD86 following treatment (right). Data were collected at day 7 after treatment, and are representative of two independent experiments with n = 5 mice in each group. Left, data are mean +/ − SEM with one-way ANOVA with Tukey’s multiple comparisons. b, Growth of CT26 tumours in syngeneic BALB/c mice treated with anti-gp120 (left), anti-PD-L1 + anti-TIGIT IgG2a (middle), and anti-PD-L1 + anti-TIGIT mIgG2a + anti-CSF-1R (right). Data are representative of two experiments with n = 10 mice in each group. c, UMAP of tumour-infiltrating lymphocytes (top, n = 21, 575) and myeloid (bottom, n = 3, 734) cells coloured by cell types. d, Bubble plots showing marker gene expression for T and NK cells (left) and myeloid cells (right) as shown in (c). e, Volcano plots showing the gene expression of anti-PD-L1 + anti-TIGIT IgG2a versus control IgG2a (left), anti-PD-L1 + anti-TIGIT IgG2a + anti-CSF-1R versus control IgG2a (middle), and anti-PD-L1 + anti-TIGIT IgG2a + anti-CSF-1R versus anti-PD-L1 + anti-TIGIT IgG2a (right) in tumour macrophage and monocytes combined. f, g, Volcano plots showing the gene expression of anti-PD-L1 + anti-TIGIT IgG2a + anti-CSF-1R versus anti-PD-L1 + anti-TIGIT IgG2a in tumour CD8 + T cells combined (f) and CD4 Tregs (g). c-g, Single cell RNA-seq was performed on intratumoural CD45+ cells isolated from tumours at day 3 after treatment, and data are from one independent experiment with n = 5 mice in each group. In volcano plots, the broken y-axis was used to make the y-axis range comparable and for better comparison between treatments; P values were calculated by two-tailed Wilcoxon rank-sum test. Source Data
Extended Data Fig. 10
Extended Data Fig. 10. Graphic illustration showing the design of the current study.
Top, To understand the mechanism(s) of response with tiragolumab in combination with atezolizumab, we leveraged samples collected from CITYSCAPE (left; NSCLC, Ph2) including tumour pretreatment samples for bulk RNA-seq and multiplex immunofluorescence (mIF), and pretreatment and on-treatment serum samples for Mass Spec, GO30103 (middle; NSCLC, Ph1b) including pretreatment and on-treatment peripheral blood mononuclear cells (PMBC) for single cell RNA-seq, and preclinical models (right). Bottom, Anti-TIGIT antibody, in a Fc dependent manner, remodels immunosuppressive tumour microenvironments by leveraging myeloid cells and Tregs, which was further enhanced with the addition of anti-PD-(L)1 antibody. Created with BioRender.com.

References

    1. Cho, B. C. et al. Tiragolumab plus atezolizumab versus placebo plus atezolizumab as a first-line treatment for PD-L1-selected non-small-cell lung cancer (CITYSCAPE): primary and follow-up analyses of a randomised, double-blind, phase 2 study. Lancet Oncol.23, 781–792 (2022). - PubMed
    1. Dolgin, E. Antibody engineers seek optimal drug targeting TIGIT checkpoint. Nat. Biotechnol.38, 1007–1009 (2020). - PubMed
    1. Sharma, P., Hu-Lieskovan, S., Wargo, J. A. & Ribas, A. Primary, adaptive, and acquired resistance to cancer immunotherapy. Cell168, 707–723 (2017). - PMC - PubMed
    1. Gong, J., Le, T. Q., Massarelli, E., Hendifar, A. E. & Tuli, R. Radiation therapy and PD-1/PD-L1 blockade: the clinical development of an evolving anticancer combination. J. Immunother. Cancer6, 46 (2018). - PMC - PubMed
    1. Wang, M., Herbst, R. S. & Boshoff, C. Toward personalized treatment approaches for non-small-cell lung cancer. Nat. Med.27, 1345–1356 (2021). - PubMed

MeSH terms

Associated data