. 2024 Mar;627(8004):656-663.
doi: 10.1038/s41586-024-07113-9. Epub 2024 Feb 28.

An atlas of epithelial cell states and plasticity in lung adenocarcinoma

Affiliations

An atlas of epithelial cell states and plasticity in lung adenocarcinoma

Guangchun Han et al. Nature. 2024 Mar.

Erratum in

  • Author Correction: An atlas of epithelial cell states and plasticity in lung adenocarcinoma.
    Han G, Sinjab A, Rahal Z, Lynch AM, Treekitkarnmongkol W, Liu Y, Serrano AG, Feng J, Liang K, Khan K, Lu W, Hernandez SD, Liu Y, Cao X, Dai E, Pei G, Hu J, Abaya C, Gomez-Bolanos LI, Peng F, Chen M, Parra ER, Cascone T, Sepesi B, Moghaddam SJ, Scheet P, Negrao MV, Heymach JV, Li M, Dubinett SM, Stevenson CS, Spira AE, Fujimoto J, Solis LM, Wistuba II, Chen J, Wang L, Kadara H. Han G, et al. Nature. 2024 Apr;628(8006):E1. doi: 10.1038/s41586-024-07277-4. Nature. 2024. PMID: 38499683 Free PMC article. No abstract available.

Abstract

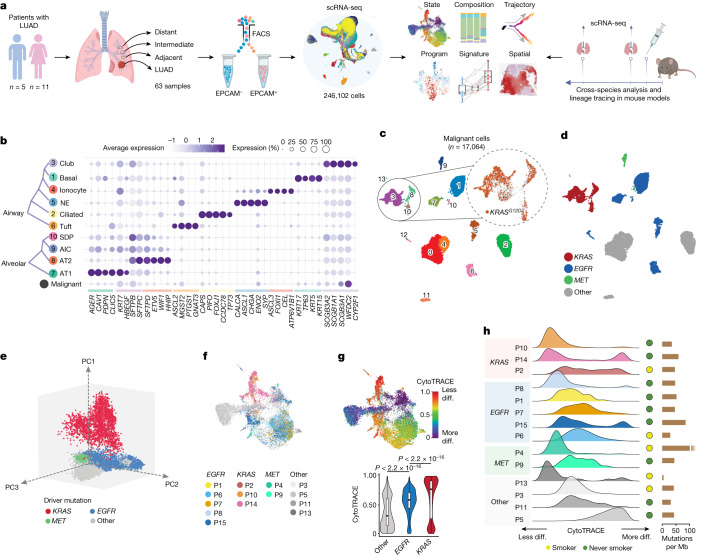
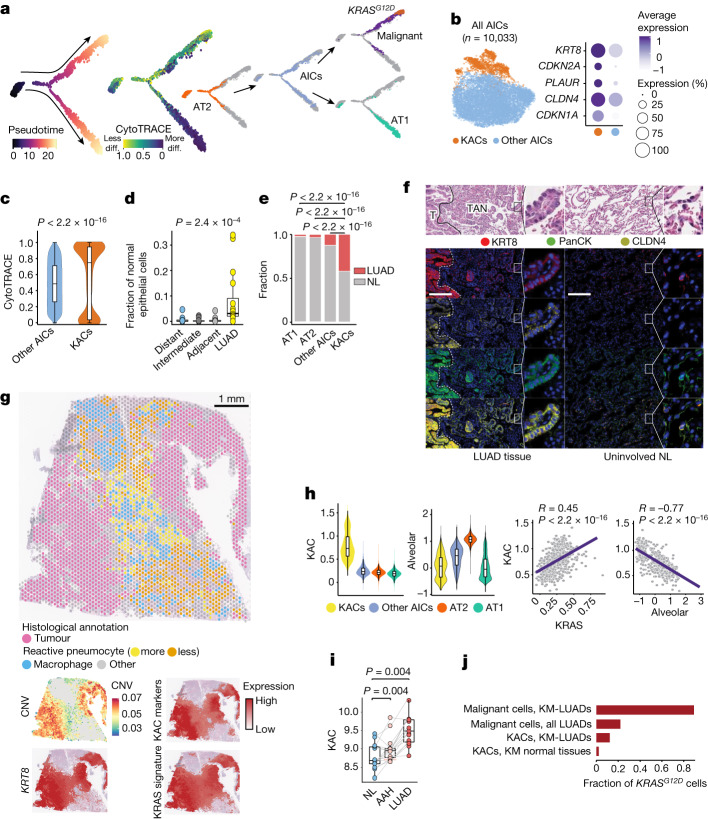
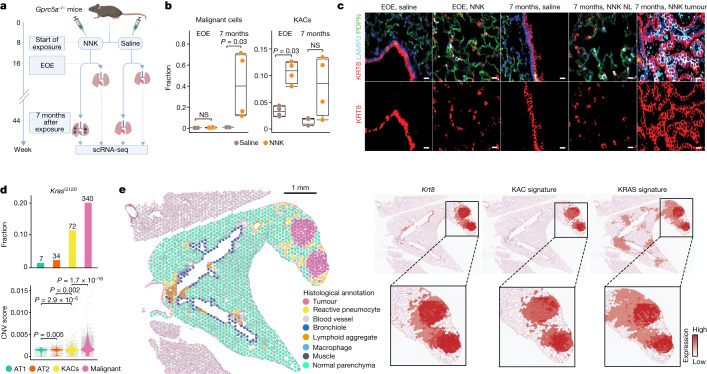
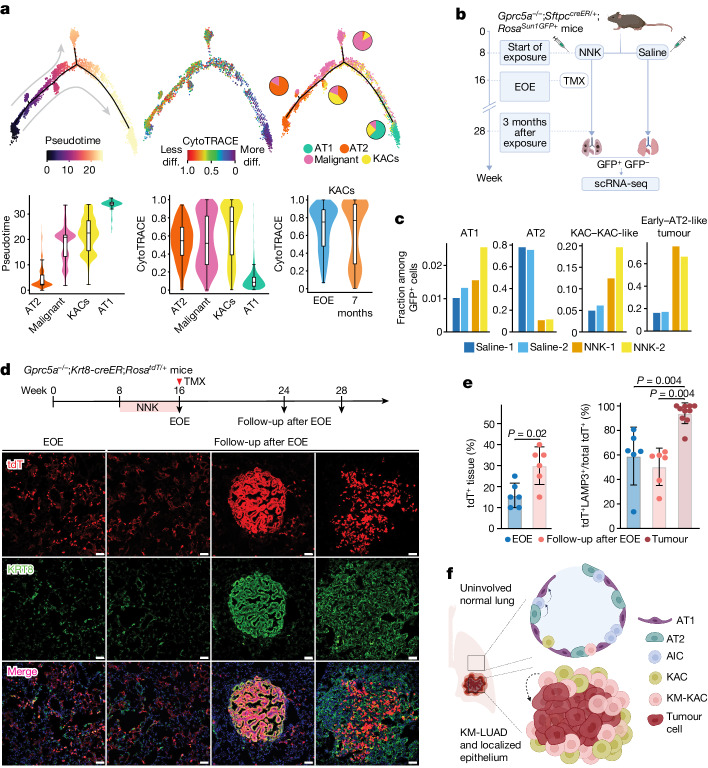
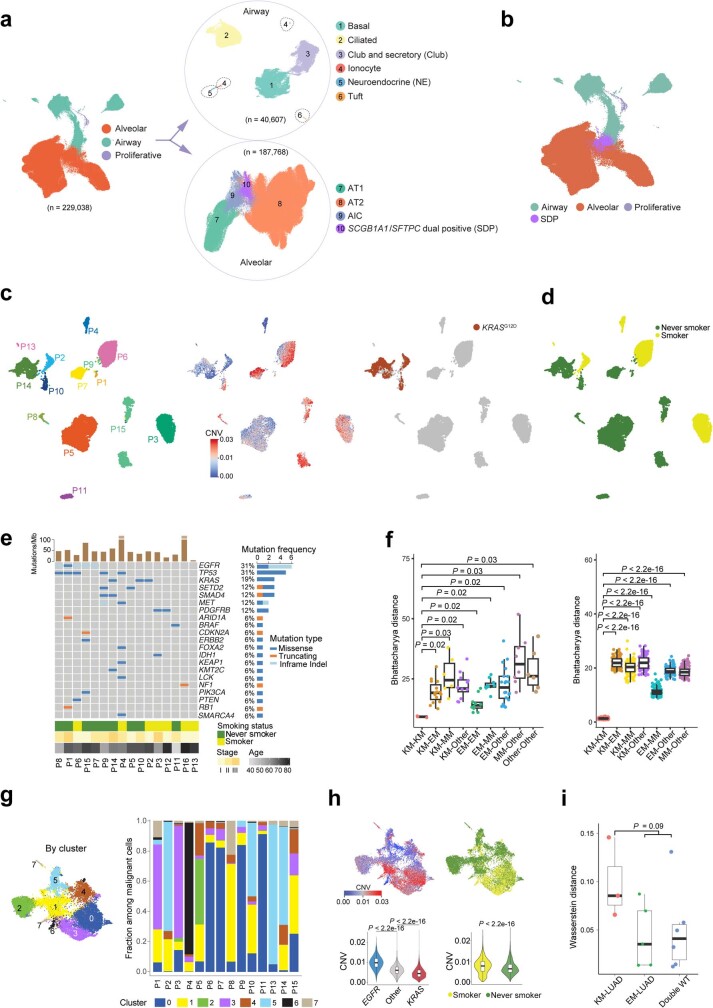
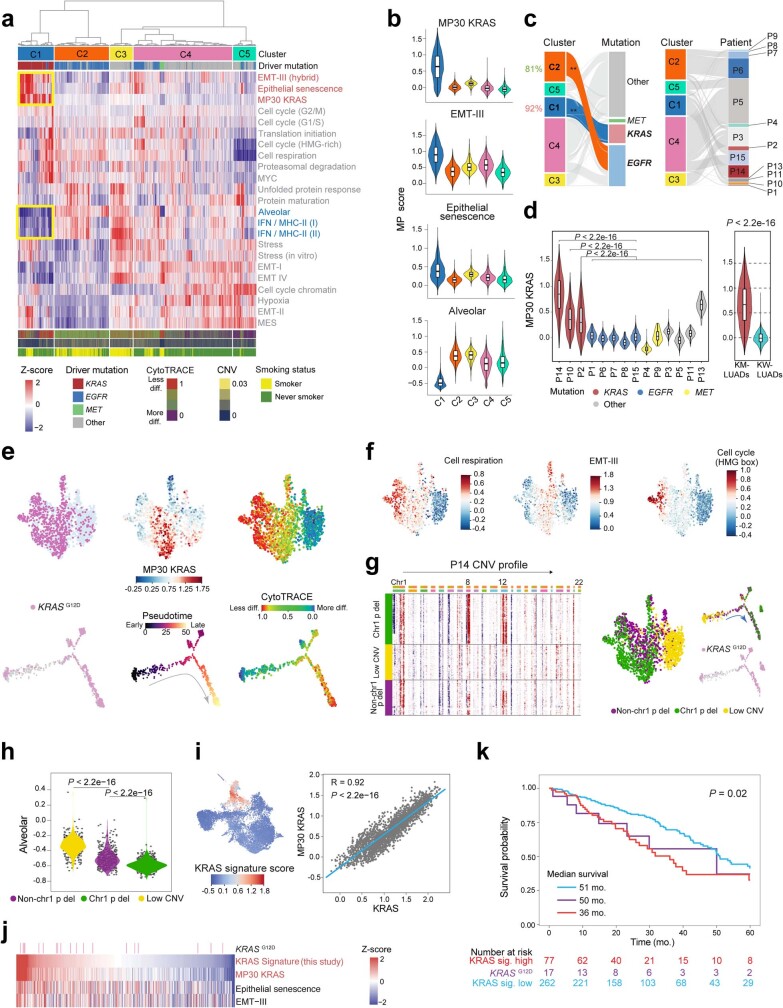
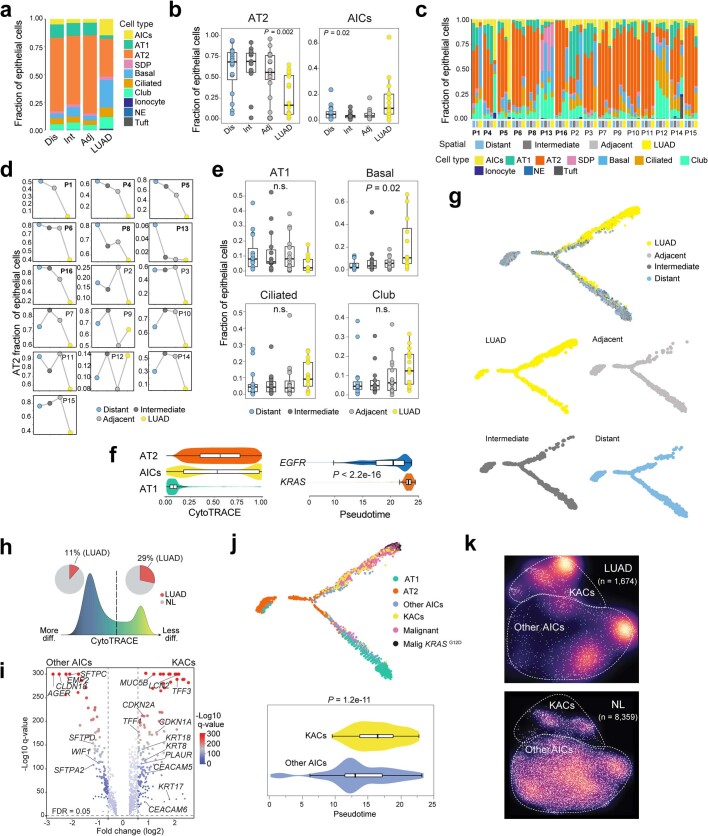
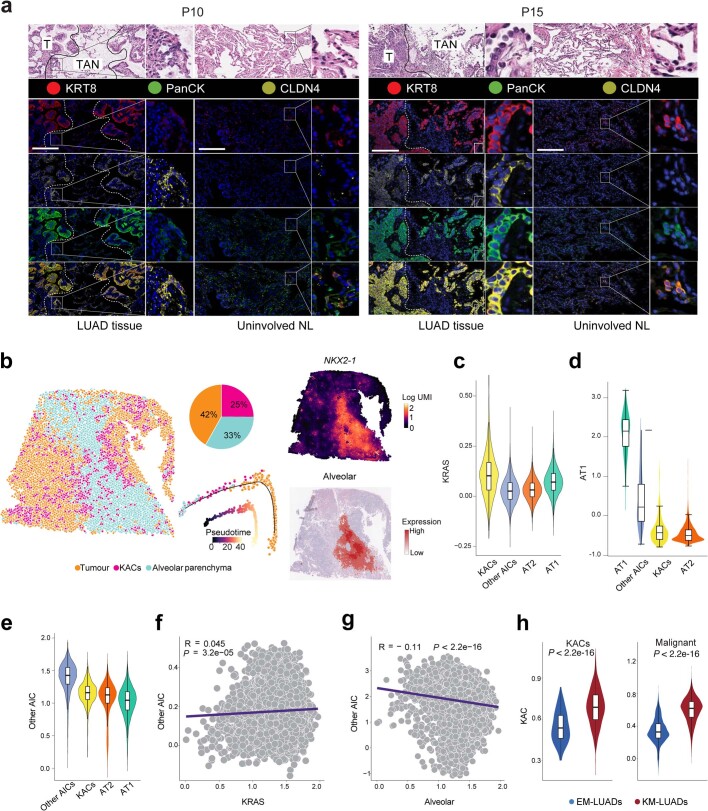
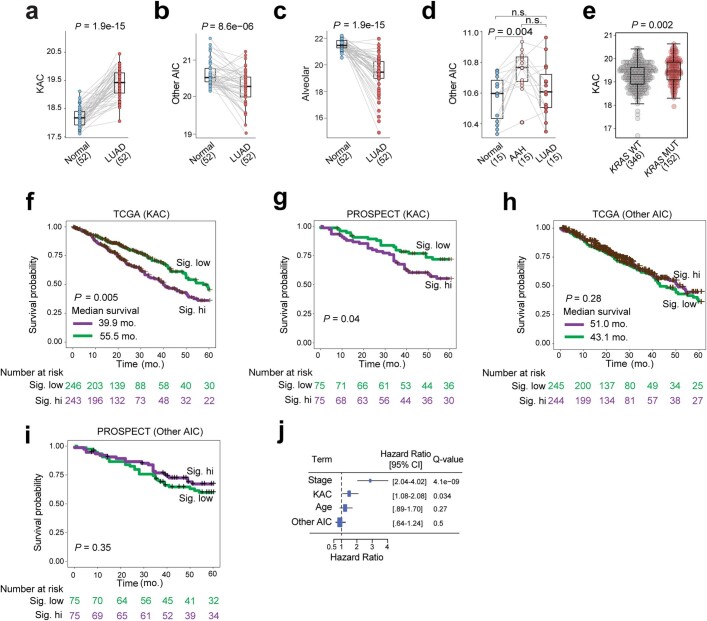
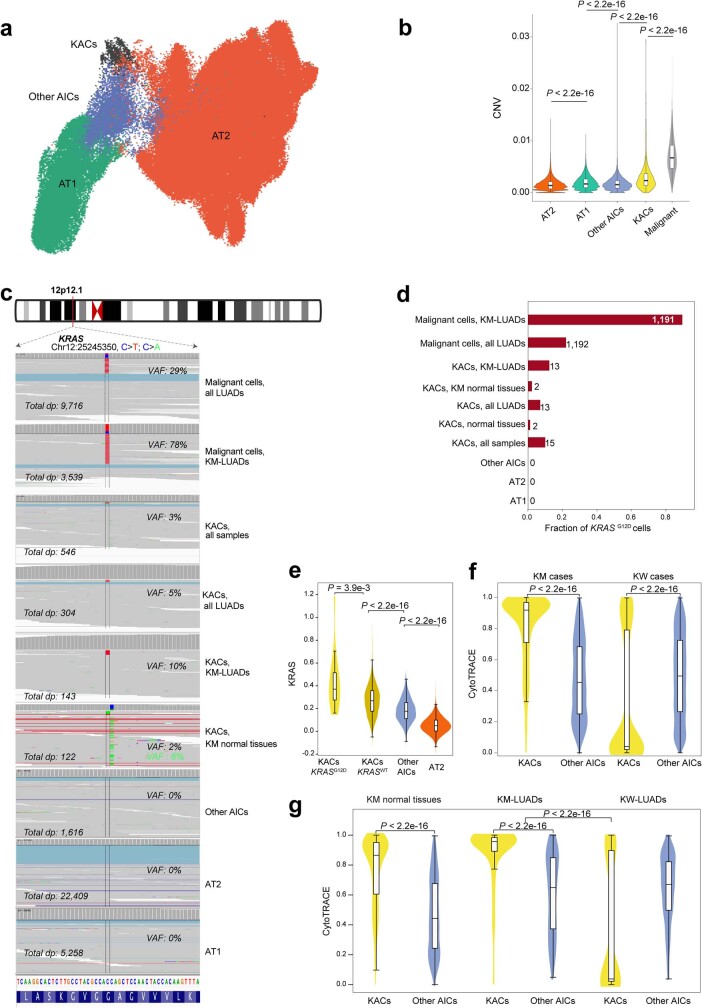
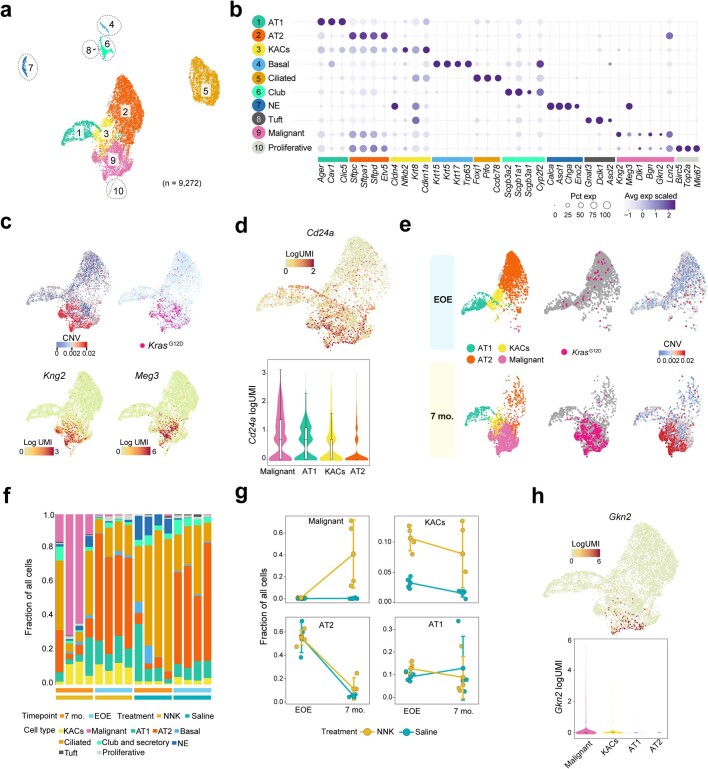
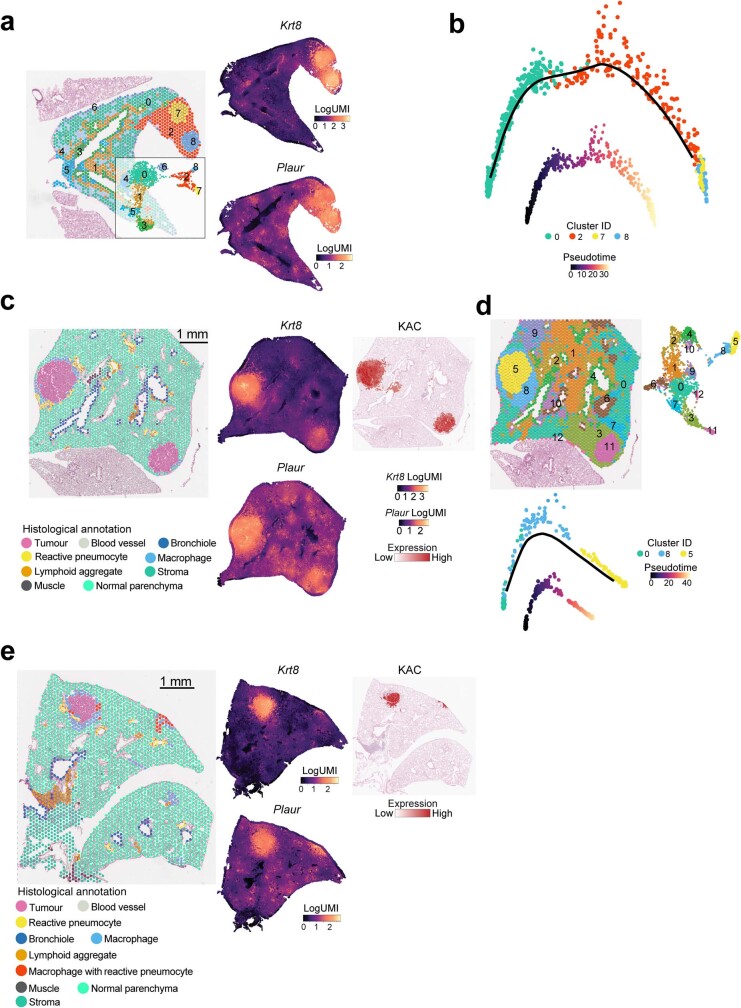
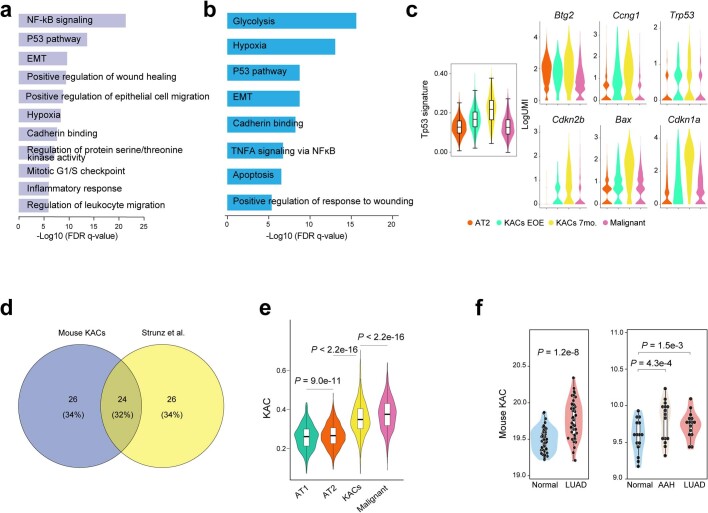
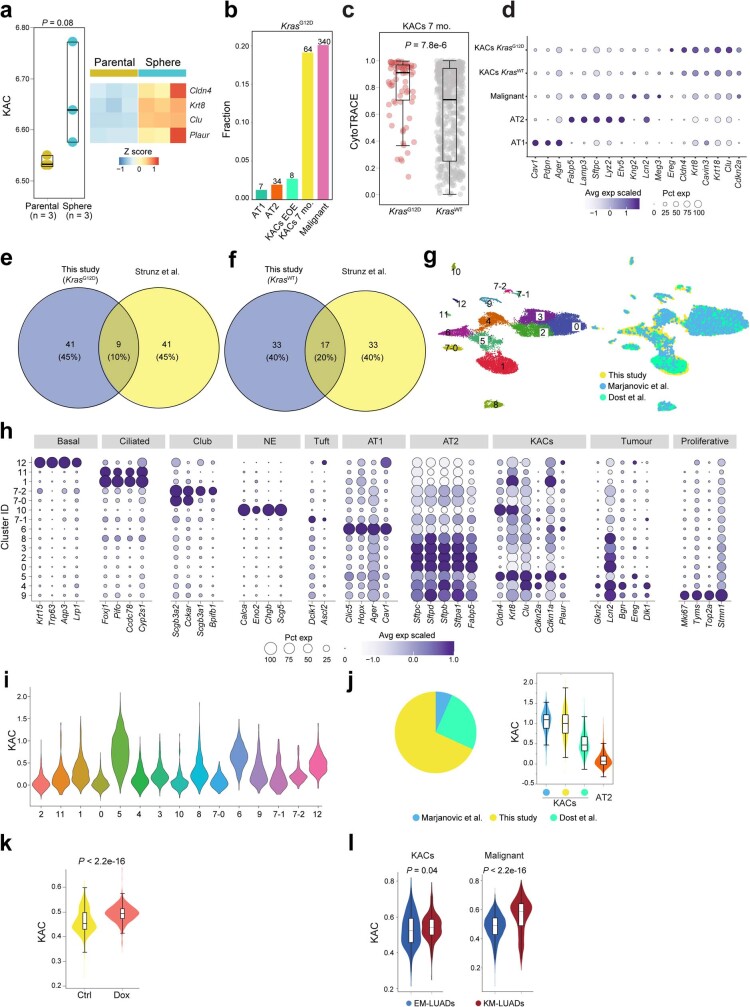
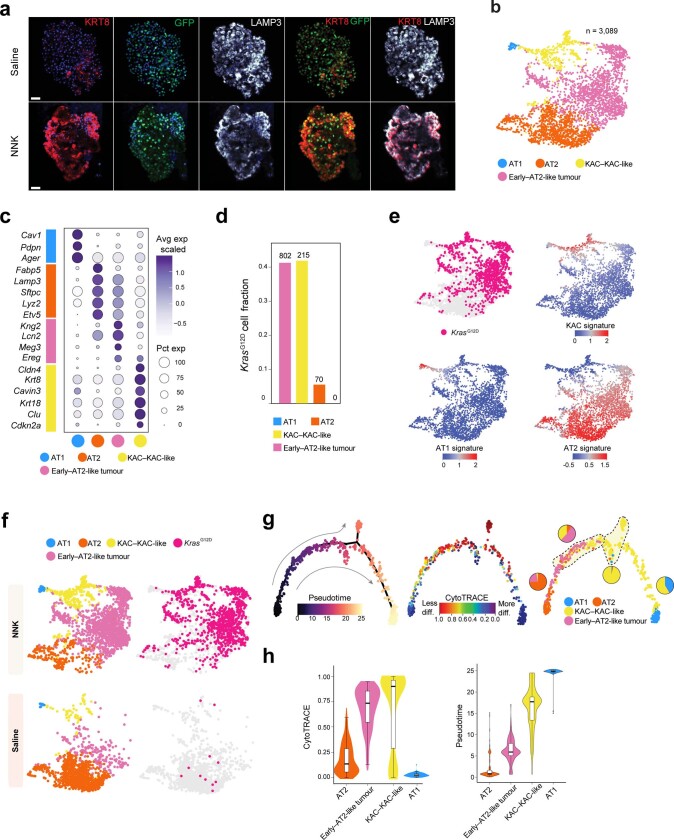
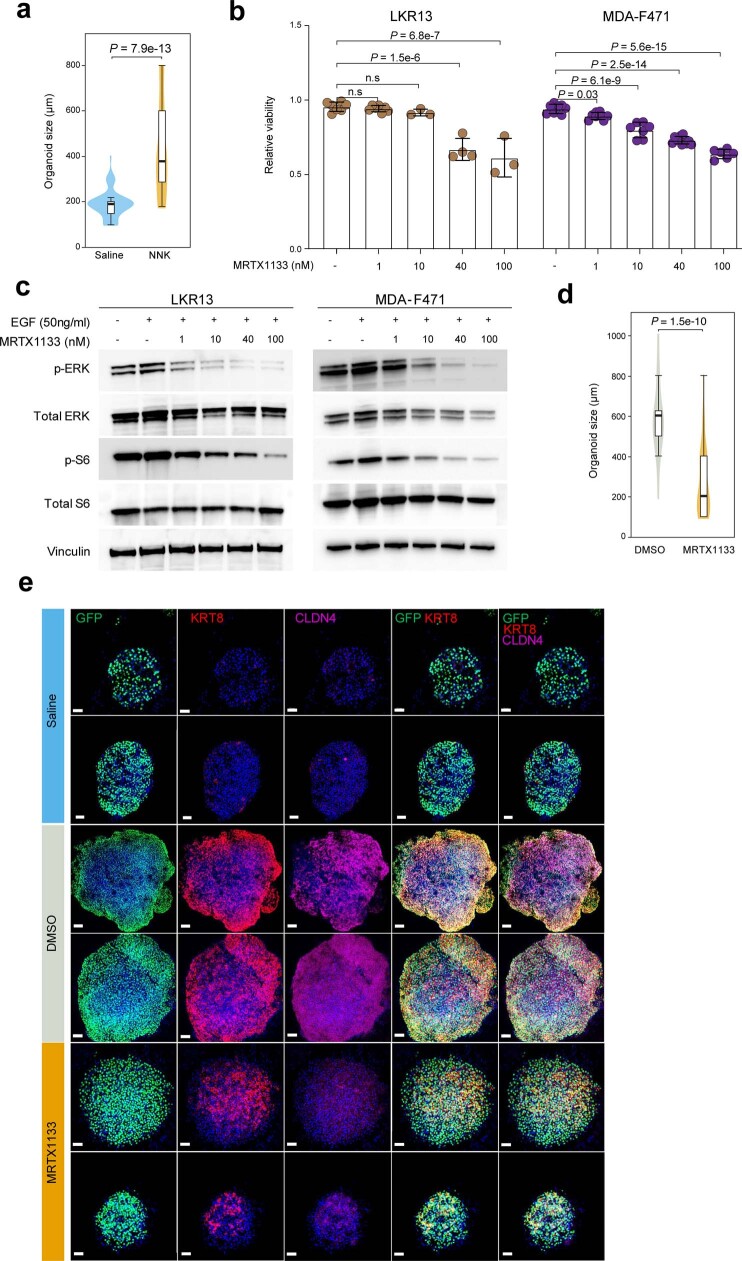
Understanding the cellular processes that underlie early lung adenocarcinoma (LUAD) development is needed to devise intervention strategies1. Here we studied 246,102 single epithelial cells from 16 early-stage LUADs and 47 matched normal lung samples. Epithelial cells comprised diverse normal and cancer cell states, and diversity among cancer cells was strongly linked to LUAD-specific oncogenic drivers. KRAS mutant cancer cells showed distinct transcriptional features, reduced differentiation and low levels of aneuploidy. Non-malignant areas surrounding human LUAD samples were enriched with alveolar intermediate cells that displayed elevated KRT8 expression (termed KRT8+ alveolar intermediate cells (KACs) here), reduced differentiation, increased plasticity and driver KRAS mutations. Expression profiles of KACs were enriched in lung precancer cells and in LUAD cells and signified poor survival. In mice exposed to tobacco carcinogen, KACs emerged before lung tumours and persisted for months after cessation of carcinogen exposure. Moreover, they acquired Kras mutations and conveyed sensitivity to targeted KRAS inhibition in KAC-enriched organoids derived from alveolar type 2 (AT2) cells. Last, lineage-labelling of AT2 cells or KRT8+ cells following carcinogen exposure showed that KACs are possible intermediates in AT2-to-tumour cell transformation. This study provides new insights into epithelial cell states at the root of LUAD development, and such states could harbour potential targets for prevention or intervention.


Conflict of interest statement

C.S.S. and A.E.S. are employees of Johnson & Johnson. H.K. reports research funding from Johnson & Johnson. M.V.N. receives research funding to institution from Mirati, Novartis, Checkmate, Alaunos/Ziopharm, AstraZeneca, Pfizer and Genentech, and consultant/advisory board fees from Mirati, Merck/MSD and Genentech. T.C. reports speaker fees/honoraria from The Society for Immunotherapy of Cancer, Bristol Myers Squibb, Roche, Medscape and PeerView; travel, food and beverage expenses from Dava Oncology and Bristol Myers Squibb; advisory role/consulting fees from MedImmune/AstraZeneca, Bristol Myers Squibb, EMD Serono, Merck & Co., Genentech, Arrowhead Pharmaceuticals and Regeneron; and institutional research funding from MedImmune/AstraZeneca, Bristol Myers Squibb, Boehringer Ingelheim and EMD Serono. S.J.M. reports funding from Arrowhead Pharma and Boehringer Ingelheim outside the scopes of submitted work. B.S. reports consulting and speaker fees from PeerView, AstraZeneca and Medscape, and institutional research funding from Bristol Myers Squibb. J.V.H. reports fees for advisory committees/consulting from AstraZeneca, EMD Serono, Boehringer-Ingelheim, Catalyst, Genentech, GlaxoSmithKline, Hengrui Therapeutics, Eli Lilly, Spectrum, Sanofi, Takeda, Mirati Therapeutics, BMS, BrightPath Biotherapeutics, Janssen Global Services, Nexus Health Systems, Pneuma Respiratory, Kairos Venture Investments, Roche, Leads Biolabs, RefleXion, Chugai Pharmaceuticals; research support from AstraZeneca, Bristol-Myers Squibb, Spectrum and Takeda, and royalties and licensing fees from Spectrum. I.I.W. reports grants and personal fees from Genentech/Roche, grants and personal fees from Bayer, grants and personal fees from Bristol-Myers Squibb, grants and personal fees from AstraZeneca, grants and personal fees from Pfizer, grants and personal fees from HTG Molecular, personal fees from Asuragen, grants and personal fees from Merck, grants and personal fees from GlaxoSmithKline, grants and personal fees from Guardant Health, personal fees from Flame, grants and personal fees from Novartis, grants and personal fees from Sanofi, personal fees from Daiichi Sankyo, grants and personal fees from Amgen, personal fees from Oncocyte, personal fees from MSD, personal fees from Platform Health, grants from Adaptive, grants from Adaptimmune, grants from EMD Serono, grants from Takeda, grants from Karus, grants from Johnson & Johnson, grants from 4D, from Iovance and from Akoya, outside the submitted work. All other authors declare no competing interests.

Figures

Fig. 1
Fig. 1. Transcriptional landscape of lung epithelial and malignant cells in early-stage LUAD.
a, Schematic overview of the experimental design and analysis workflow. Composition, composition of cell subsets; Program, transcriptional programs in malignant cells; Spatial, in situ spatial transcriptome and protein analyses; State, cellular transcriptional state. b, Proportions and average expression levels (scaled) of selected marker genes for ten normal epithelial and one malignant cell subset. NE, neuroendocrine. c, Unsupervised clustering of 17,064 malignant cells coloured by cluster identity. Top right inset shows malignant cells coloured by KRASG12D mutation status identified by scRNA-seq. d, Uniform manifold approximation and projection (UMAP) of malignant cells shown in c and coloured by driver mutations identified in each tumour sample using WES. e, Principal component analysis (PCA) plot of malignant cells coloured by driver mutations identified in each tumour sample by WES. f, UMAP plots of malignant cells coloured by patient identifier and grouped by driver mutation status. g, Top, UMAP of malignant cells by differentiation state inferred by CytoTRACE. Bottom, comparison of CytoTRACE scores between malignant cells from samples with different driver mutations. Boxes indicate the median ± interquartile range; whiskers, 1.5× the interquartile range; centre line, median. n cells in each box-and-whisker (left to right): 9,135, 5,457 and 2,472. P values were calculated using two-sided Wilcoxon rank-sum test with Benjamini–Hochberg correction. diff., differentiated. h, Per sample distribution of malignant cell CytoTRACE scores. The schematic in a was created using BioRender (https://www.biorender.com).
Fig. 2
Fig. 2. Identification and characterization of KACs in human LUAD.
a, Pseudotime analysis of alveolar and malignant cells. b, Left, subclustering analysis of AICs. Right, proportions and average expression levels (scaled) of representative KAC marker genes. c, CytoTRACE score in KACs versus other AICs. n cells (left to right): 8,591 and 1,440. P value was calculated using two-sided Wilcoxon rank-sum test. d, Proportion of KACs among non-malignant epithelial cells. n samples (left to right): 16, 15, 16 and 16. P value was calculated using Kruskal–Wallis test. e, Fraction of alveolar cell subsets coloured by sample type. P values were calculated using two-sided Fisher’s exact tests with Benjamini–Hochberg correction. f, Top, haematoxylin and eosin (H&E) staining of LUAD tumour (T), TAN displaying reactive hyperplasia of AT2 cells and uninvolved NL tissue. Bottom, digital spatial profiling showing KRT8, PanCK, CLDN4, Syto13 blue nuclear stain and composite image. Magnification, ×20. Scale bar, 200 μm. Staining was repeated four times with similar results. Dashed white lines represent the margins separating tumours and TAN regions. g, ST analysis of LUAD from patient P14 showing histologically annotated H&E-stained Visium slide (left) and spatial heatmaps (right) depicting CNV score and scaled expression of KRT8, KAC markers (b) and KRAS signature. h, Expression (top) and correlation (bottom) analyses of KAC, KRAS and alveolar signatures. n = 1,440 (KACs), 8,593 (other AICs), 146,776 (AT2) and 25,561 (AT1). R, Spearman’s correlation coefficient. P values were calculated using Spearman’s correlation test. i, KAC signature expression in premalignancy cohort (15 samples each). P values were calculated using two-sided Wilcoxon signed-rank test with Benjamini–Hochberg correction. j, Fraction of KRASG12D cells in different subsets. For c,d,h and i, box-and-whisker definitions are the same as Fig. 1g.
Fig. 3
Fig. 3. KACs evolve early and before tumour onset during tobacco-associated KM-LUAD pathogenesis.
a, Schematic view of the in vivo experimental design. b, Fraction of malignant cells (left) and KACs (right) across treatment groups and time points. Box-and-whisker definitions are same as in Fig. 1g. n = 4 biologically independent samples per condition. P values were calculated using two-sided Mann–Whitney U-test. NS, not significant. c, IF analysis of KRT8, LAMP3 and PDPN in mouse lung tissues. Scale bar, 10 μm. Results are representative of two independent biological replicates per treatment and timepoint. Staining was repeated three times with similar results. d, Top, distribution of CNV scores among alveolar and malignant cells. n on top of each bar denotes the numbers of KrasG12D mutant cells in each cell group. Bottom, fraction of KrasG12D mutant cells in KACs, malignant, AT1 and AT2 subsets. n = 496 (AT1), 1,320 (AT2), 512 (KACs) and 1,503 (malignant) cells. P values were calculated using two-sided Mann–Whitney U-test with Benjamini–Hochberg correction. e, ST analysis of lung tissue at 7 months after exposure to NNK and showing histological annotation of H&E-stained Visium slide (left) and spatial heatmaps showing scaled expression of KRT8 as well as KAC and KRAS signatures. ST analysis was done on three different tumour-bearing mouse lung tissues from two mice at 7 months following NNK. The schematic in a was created using BioRender (https://www.biorender.com). Source Data
Fig. 4
Fig. 4. KACs are implicated in the transition of AT2 to Kras mutant tumour cells.
a, Trajectories of alveolar and malignant cells coloured by inferred pseudotime, cell differentiation status and cell type (top left to right). Distribution of inferred pseudotime (bottom left) and CytoTRACE (bottom middle) scores across the indicated cell subsets. Bottom right panel shows CytoTRACE score distribution in KACs at the two time points. Box-and-whisker definitions are the same as in Fig. 1g. n cells (left to right): 1,791, 1,693, 636, 580, 1,791, 1,693, 636, 580, 301 and 335. b, Schematic overview showing analysis of Gprc5a−/− mice with reporter-labelled AT2 cells (Gprc5a−/−;SftpccreER/+;RosaSun1GFP/+). TMX, tamoxifen. c, Fractions of AT1, AT2, KACs and KAC-like cells (KAC–KAC-like) and early tumour and AT2-like tumour cells (early–AT2-like tumour) within GFP+ cells from lungs of two NNK-treated and two saline-treated mice analysed at 3 months after exposure. d, IF analysis of tdT and KRT8 expression at EOE to NNK (first column; EOE) and at 8–12 weeks following NNK (follow-up after EOE) in normal-appearing regions (second column) and tumours (last two columns) of Gprc5a−/−;Krt8-creER;RosatdT/+ mice. Tamoxifen (1 mg per dose) was delivered immediately after EOE to NNK for six continuous days. Results are representative of three biological replicates per condition. Staining was performed two times with similar results. Magnification, ×20. Scale bar, 10 μm. e, Left, percentage of lung tissue areas containing tdT+ cells. Right, percentage of tdT+LAMP3+ cells among total tdT+ cells in normal-appearing regions at different time points. Error bars show the mean ± s.d. of n biologically independent samples (left to right): 6, 6, 6, 6 and 10. P values were calculated using Mann–Whitney U-test. f, Proposed model for alveolar plasticity, whereby a subset of AICs in the intermediate AT2-to-AT1 differentiation state are KACs and, later, acquire KRASG12D mutations and are implicated in KM-LUAD development from a particular region in the lung. The schematics in b and f were created using BioRender (https://www.biorender.com). Source Data
Extended Data Fig. 1
Extended Data Fig. 1. Analysis of normal lung epithelial and malignant subsets in early-stage LUADs.
a,b, UMAP plots of 229,038 normal epithelial cells from 63 samples. Each dot represents a single cell coloured by major cell lineage (a, left), airway sub-lineage (a, top right) and alveolar sub-lineages (a, bottom right). SCGB1A1/SFTPC dual positive cells (SDP) cells were separately coloured to show their position on the UMAP (b). c,d UMAP plots of 17,064 malignant cells coloured by patient ID (c, left), CNV score (c, middle), presence of KRASG12D mutation (c, right) and smoking status (d). e, Analysis of recurrent driver mutations identified by WES. f, Transcriptomic variances quantified by Bhattacharyya distances at the sample (left) and cell (right) levels among LUADs with driver mutations in KRAS (KM), EGFR (EM), and MET (MM), or LUADs that are wild type (WT) for these genes. Box, median ± interquartile range; whiskers, 1.5× interquartile range; centre line: median. n cells in each box-and-whisker in the left panel: KM-KM = 3; KM-EM = 15; KM-MM = 6; KM-Other = 12; EM-EM = 10; EM-MM = 10; EM-Other = 20; MM-Other = 8; Other-Other = 6. n cells in each box-and-whisker in the right panel: 100. P values were calculated by two-sided Wilcoxon Rank-Sum test with a Benjamini–Hochberg correction. g, Harmony-corrected UMAP plot of malignant cells coloured by cluster ID (left) and cluster distribution by sample (right). h, UMAP plots of malignant cells coloured by CNV scores (top left), smoking status (top right). Comparison of CNV scores between malignant cells from samples carrying different driver mutations (bottom left) or between smokers and never smokers (bottom right). Box-and-whisker definitions are similar to panel f. n cells in each box-and-whisker: EGFR = 5,457; Other = 9,135; KRAS = 2,472; Smoker = 5,999; Never smoker = 11,065. P values were calculated by two-sided Wilcoxon Rank-Sum test with a Benjamini–Hochberg correction. i, Analysis of Wasserstein distances among KM-LUADs, EM-LUADs, and LUADs with WT KRAS and EGFR (Double WT). Box-and-whisker definitions are similar to panel f. n samples in each box-and-whisker: 3; 5; 6. P value was calculated by a two-sided Wilcoxon Rank-Sum test.
Extended Data Fig. 2
Extended Data Fig. 2. Characterization of inter- and intra-tumour heterogeneity of LUAD malignant cells.
a, Unsupervised clustering of malignant cells based on expression of 23 previously defined consensus cancer cell meta-programs (MPs). b, Distribution of signature scores of 4 representative MPs across clusters from a. Box-and-whisker definitions similar to Extended Data Fig. 1f. n cells in each box-and-whisker: C1 = 2,600; C2 = 3,968; C3 = 1,647; C4 = 7,182; C5 = 1,667. c, Enrichment of clusters (C1-C5) in cells colour coded by recurrent driver mutation status (left) and patients (right). **: P < 2.2 × 10⁻¹⁶. P value was calculated using two-sided Fisher’s exact test with a Benjamini–Hochberg correction. d, MP30 was computed in malignant cells in each patient (left) and in KM-LUADs versus KRAS WT LUADs (KW-LUADs, right). n cells in each box-and-whisker: P14 = 1,614; P10 = 326; P2 = 532; P1 = 64; P6 = 2,604; P7 = 823; P8 = 147; P15 = 1,819; P4 = 404; P9 = 25; P3 = 2,419; P5 = 5,872; P11 = 375; P13 = 40; KM-LUADs = 2,472; KW-LUADs = 14,592. Box-and-whisker definitions are similar to Extended Data Fig. 1f. P values were calculated using two-sided Wilcoxon Rank-Sum test with a Benjamini–Hochberg correction. e, Profiling of ITH in malignant cells from P14 LUAD. UMAP plots show malignant cells coloured by (top left to top right) KRASG12D mutation status, KRAS signature expression, and cell differentiation status (CytoTRACE). Trajectories of P14 malignant cells coloured by (bottom left to bottom right) the presence of KRASG12D mutation, inferred pseudotime, and differentiation status. f, UMAP plots showing P14 malignant cells coloured by expression of the 3 indicated MPs. g, Unsupervised clustering analysis of P14 malignant cells based on inferred CNV profiles (left). UMAP of P14 malignant cells (middle) and inferred trajectory (top right) coloured by CNV clusters, as well as KRASG12D mutation expression status along pseudotime trajectory (bottom right). h, Alveolar MP expression across the CNV clusters shown in panel g. n cells in each group: 477; 464; 673. P values were calculated using two-sided Wilcoxon Rank-Sum test with a Benjamini–Hochberg correction. i, Harmony-corrected UMAP plot of malignant cells coloured by KRAS signature score (left). Correlation between MP30 expression and KRAS signature score in malignant cells of KM-LUADs (right). P value was calculated with Spearman correlation test. R denotes the Spearman correlation coefficient. j, Heatmap showing score distribution of the indicated MPs and signatures in TCGA LUAD samples. k, Kaplan-Meier plot showing differences in the survival probability between samples with high and low levels of KRAS signature (KRAS sig.), and those with KRASG12D mutation. OS: overall survival. KRAS sig. high: samples within top quartile of KRAS signature score. KRAS sig. low: samples below the third quartile of KRAS signature score. mo.: months. P value was calculated with logrank test.
Extended Data Fig. 3
Extended Data Fig. 3. Phenotypic diversity and states of human normal lung epithelial cells.
a, Composition of normal epithelial lineages across spatial regions as defined in Fig. 1a. Dis: distant normal. Int: intermediate normal. Adj: adjacent normal. NE: neuroendocrine. b, Changes in cellular fractions of AT2 cells (left) and AICs (right) across the spatial samples. Box-and-whisker definitions are similar to Extended Data Fig. 1f. n samples in each box-and-whisker (left to right): 16; 15; 16; 16. P values were calculated with Kruskal-Wallis test. c, Composition of normal epithelial lineages across the spatial regions at the sample level. d, Fractional changes of AT2 cells among all epithelial cells across the spatial regions at the patient level. c and d: Cases showing gradually reduced AT2 fractions with increasing tumour proximity (7 of the 16 patients; P = 0.004 by ordinal regression analysis in d). e, Fractions of AT1, basal, ciliated, and club and secretory cells along the continuum of the spatial samples. Box-and-whisker definitions are similar to Extended Data Fig. 1f. n samples in each box-and-whisker (left to right): 16; 16; 15; 16. P values were calculated with Kruskal-Wallis test. f, Distribution of CytoTRACE scores in AICs, AT1 and AT2 cells (left). Distribution of pseudotime scores in malignant cells from EGFR- or KRAS-mutant tumours (right). P value was calculated with two-sided Wilcoxon Rank-Sum test. Box-and-whisker definitions are similar to Extended Data Fig. 1f with n cells: AT2 = 14,649; AICs = 974; AT1 = 2,529; EGFR = 1,711; KRAS = 1,326. g, Pseudotime trajectory analysis of alveolar and malignant subsets coloured by tissue location. h, Distribution and composition of AICs with low (left) or high (right) CytoTRACE score. i, DEGs between KACs and other AICs. j, Pseudotime trajectory analysis of malignant and alveolar subsets colour-coded by cell lineage and presence of KRASG12D mutation (top). Pseudotime score in KACs versus other AICs (bottom). Box-and-whisker definitions are similar to Extended Data Fig. 1f. n cells in each box-and-whisker: KACs = 157; Other AICs = 817. P value was calculated by two-sided Wilcoxon Rank-Sum test. k, Differences in cell densities between LUAD (top) and NL tissues (bottom).
Extended Data Fig. 4
Extended Data Fig. 4. Spatial and molecular attributes of human KACs.
a, Microphotographs of P10 (left) and P15 (right) LUAD and paired uninvolved NL tissues. Top panels: H&E staining showing LUAD T and TAN (left columns) regions, and uninvolved NL (right columns). DSP analysis of KRT8 (red), CLDN4 (yellow), and pan-cytokeratin (PanCK; green) in LUAD, TAN, and NL regions. Blue nuclear staining was done using Syto13. Magnification, ×20. Scale bar = 200 μm. Staining was repeated four times with similar results. b, CytoSPACE deconvolution and trajectory analysis of P14 LUAD ST data. The left spatial map is coloured by deconvoluted cell types. Top middle panel shows the neighbouring cell composition of KACs, and the bottom middle panel depicts inferred trajectory and pseudotime prediction using Monocle 2. Scaled expression of NKX2-1 and alveolar signature are shown in the rightmost top and bottom panels, respectively. ce, Expression of KRAS (c), AT1 (d), and other AIC (e) signatures across AT1, AT2, KACs and other AICs. Box-and-whisker definitions are similar to Extended Data Fig. 1f. n cells in each group: KACs = 1,440; Other AICs = 8,593; AT2 = 146,776; AT1 = 25,561. f, g, Correlation analysis between Other AIC and KRAS (f) or alveolar (g) signature scores. P values were calculated with Spearman correlation test. R denotes the Spearman correlation coefficients. h, Enrichment of KAC signature among KACs (left) and malignant cells (right) from KM- or EM-LUAD samples. Box-and-whisker definitions are similar to Extended Data Fig. 1f. n cells in each box-and-whisker (left to right): KACs, EM-LUADs = 135; KACs, KM-LUADs = 719; Malignant, EM-LUADs = 5,457; Malignant, KM-LUADs = 2,472. P values were calculated by two-sided Wilcoxon Rank-Sum test.
Extended Data Fig. 5
Extended Data Fig. 5. Enrichment and clinical relevance of KAC, Other AIC, and alveolar signatures in LUAD.
ae, Expression of KAC (a), other AIC (b) and alveolar (c) signatures in TCGA LUAD samples and matched NL tissues, of other AIC signature in a lung preneoplasia cohort (d), as well as of KAC signature in TCGA LUAD samples grouped by KRAS mutation status (e). Box-and-whisker definitions are similar to Extended Data Fig. 1f. n samples in each group: TCGA Normal = 52; TCGA LUAD = 52; preneoplasia Normal, AAH, and LUAD: 15 each; TCGA LUAD KRAS WT = 346; TCGA LUAD KRAS MUT = 152. P values were calculated by two-sided Wilcoxon Rank-Sum test. Benjamini–Hochberg method was used for multiple testing correction. n.s.: non-significant (P > 0.05). fi, Kaplan-Meier plots showing differences in overall survival probability across TCGA (f) and PROSPECT (g) samples with high versus low KAC signature scores, or with high versus low scores for other AIC signature (h: TCGA; i: PROSPECT). Sig. low: LUAD samples with signature scores lower than the group median value. Sig. hi: LUAD samples with signature scores higher than the group median value. P values were calculated with the logrank test. j, Multivariate Cox proportional hazard regression analysis including pathologic stage, age, as well as KAC and other AIC signatures. Center: estimated Hazard Ratio; error bars: 95% CI. q values were calculated by Cox proportional hazards regression model and adjusted with Benjamini–Hochberg method.
Extended Data Fig. 6
Extended Data Fig. 6. Prevalence of KRASG12D mutant KACs in LUAD.
a, UMAP clustering of alveolar subsets. b, Quantification of CNV scores across AT1, AT2, KACs and other AICs. Box-and-whisker definitions are similar to Extended Data Fig. 1f. n cells in each group: AT2 = 146,776; AT1 = 25,561, Other AICs =8,593; KACs = 1,440; Malignant = 17,064. P values were calculated using two-sided Wilcoxon Rank-Sum test with a Benjamini–Hochberg correction. KRASG12D variant allele frequencies (c) and fractions of KRASG12D mutant cells (d) in alveolar and malignant cells from LUAD and normal samples and analysed by scRNA-seq. VAF for KRASG12C variant in KACs from KM normal tissues is shown in green (c). n on top of each bar in d: number of KRASG12D mutant cells. e, KRAS activation signature was statistically compared across KRASG12D mutant KACs, KRASwt KACs, AICs, and AT2 cells. Box-and-whisker definitions are similar to Extended Data Fig. 1f. n cells in each box-and-whisker: KACs KRASG12D = 15; KACs KRASwt = 1,425; Other AICs =8,593; AT2 = 146,776. P values were calculated using the two-sided Wilcoxon Rank-Sum test with a Benjamini–Hochberg correction. f, g, CytoTRACE scores in KACs versus other AICs from all cells of KM (f, left) and KW cases (f, right), in cells from normal lung tissues of patients with KM-LUAD (g, left), and cells from KM-LUAD (g, middle) and KW-LUAD (g, right) tissues. Box-and-whisker definitions are similar to Extended Data Fig. 1f. n cells in each box-and-whisker: KM cases, KACs = 719; KM cases, Other AICs = 2,414; KW cases, KACs = 721; KM cases, Other AICs = 6,179; KM normal tissues, KACs = 408; KM normal tissues, Other AICs = 2,286; KM-LUADs, KACs = 311; KM-LUADs, Other AICs = 128; KW-LUADs, KACs = 295; KW-LUADs, Other AICs = 940. P values were calculated using two-sided Wilcoxon Rank-Sum tests with Benjamini–Hochberg adjustment for multiple testing correction.
Extended Data Fig. 7
Extended Data Fig. 7. scRNA-seq analysis of epithelial subsets in a tobacco carcinogenesis mouse model of KM-LUAD.
a, UMAP distribution of mouse epithelial cell subsets. b, Proportions and average expression levels of select marker genes for mouse normal epithelial cell lineages and malignant cell clusters as defined in panel a. c, UMAP plots of alveolar and malignant cells coloured by CNV score, presence of KrasG12D mutation, or expression levels of Kng2 and Meg3. d, UMAP (top) and violin (bottom) plots showing expression level of Cd24a in malignant and alveolar subsets. Box-and-whisker definitions are similar to Extended Data Fig. 1f. n cells in each group: Malignant = 1,693; AT1 = 580; KACs = 636; AT2 = 1,791. e, UMAP distribution of alveolar and malignant cells coloured by cell lineage, KrasG12D mutation status, and CNV score at EOE or 7 months following NNK. f, Proportions of normal epithelial cell lineages and malignant cells in each sample. g, Fractional changes of malignant cells, KACs, AT2 and AT1 cells between EOE and 7 months post treatment with NNK or saline; n = 4 biologically independent samples in each group. Whiskers, 1.5× interquartile range; Center dot: median. h, UMAP (top) and violin (bottom) plots showing expression levels of Gkn2 in malignant and alveolar cell subsets. n cells in each group: Malignant = 1,693; AT1 = 580; KACs = 636; AT2 = 1,791. Source Data
Extended Data Fig. 8
Extended Data Fig. 8. ST analysis of KACs in tobacco-associated development of KM-LUAD.
a, ST analysis of the same tumour-bearing mouse lung in Fig. 3e with cell clusters identified by Seurat (inlet) and mapped spatially (left). Spatial maps with scaled expression of Krt8 and Plaur are shown on the right. b, Pseudotime trajectory analysis of C0 (alveolar parenchyma), C2 (reactive area with KACs nearby tumours), and clusters C7 and C8 (representing two tumours) from the same tumour-bearing mouse lung in a. c, ST analysis of another tumour-bearing lung region from the same NNK-exposed mouse as in panel a, and showing histological spot-level annotation of H&E-stained images (left) followed by spatial maps with scaled expression of Krt8, Plaur, and KAC signature (right). d, Cell clusters identified by Seurat (top left) and mapped spatially (top right) from the same mouse tumour-bearing lung in c. bottom of panel k: Pseudotime trajectory analysis of C0 (alveolar parenchyma), C8 (reactive area with KACs nearby the tumour), and C5 (representing one tumour) from the mouse tumour-bearing lung in c. e, ST analysis of a tumour-bearing lung from an additional mouse at 7 months following NNK showing histological spot-level annotation of H&E-stained images (left) followed by spatial maps with scaled expression of Krt8 (middle, top), Plaur (middle, bottom), and KAC signature (right).
Extended Data Fig. 9
Extended Data Fig. 9. Mouse KAC signatures and pathways are relevant to both injury models and human KM-LUAD.
a,b, Pathway enrichment analysis of KACs relative to other alveolar cell subsets and malignant cells in tumour-bearing mice at 7 months following NNK (a) and in the human LUAD scRNA-seq dataset from this study (b). c, Enrichment of Tp53 signature derived from mouse KACs, and expression of Btg2, Ccng1, Cdkn2b, Bax, Cdkn1a, as well as Trp53 itself, across AT2 cells, malignant cells, and KACs at EOE or at 7 months following NNK or saline. n cells in each group: AT2 = 1,791; KACs EOE = 301; KACs 7mo. = 335; Malignant =1,693. d, Pie chart showing percentages of unique and overlapping DEG sets between mouse KACs from this study and Krt8+ transitional cells identified by Strunz and colleagues. e,f, Expression of the mouse KAC signature across alveolar and malignant cell subsets from this study (e), in normal lung (Normal) and LUAD tissues from the TCGA cohort (f, left), as well as in normal lung (Normal), AAH, and LUAD tissues of our premalignancy cohort (f, right). n cells in each group of panel e: AT2 = 1,791; KACs EOE = 301; KACs 7mo. = 335; Malignant = 1,693. n samples in each group of panel f left: Normal = 52; LUAD = 52. n samples in each group of panel f right: Normal = 15; AAH = 15; LUAD = 15. Box-and-whisker definitions are similar to Extended Data Fig. 1f. P values were calculated using two-sided Wilcoxon Rank-Sum test with a Benjamini–Hochberg correction. Source Data
Extended Data Fig. 10
Extended Data Fig. 10. Mouse KACs exist in a continuum, bear strong resemblance to human KACs, and are present in independent KRASG12D-driven mouse models of LUAD.
a, Mouse KAC signature score (left) and heatmap showing expression of select KAC marker genes (right) in bulk transcriptomes of MDA-F471-derived 3D spheres versus parental MDA-F471 cells grown in 2D. P value was calculated using two-sided Wilcoxon Rank-Sum test. Box-and-whisker definitions are similar to Extended Data Fig. 1f. b, Fraction of KrasG12D mutant cells in different mouse alveolar cell subsets including when separating KACs into early KACs at EOE and late KACs at 7 months following NNK. Numbers of KrasG12D mutant cells are indicated on top of each bar. c, CytoTRACE scores in late KACs with KrasG12D mutation and in those with wild type KRAS (Kraswt). P value was calculated using two-sided Wilcoxon Rank-Sum test. Box-and-whisker definitions are similar to Extended Data Fig. 1f. n cells in each box-and-whisker: KrasG12D = 72; Kraswt = 564. d, Proportions and average expression levels of select marker genes for the different subsets indicated. Pie charts showing percentages of unique and overlapping DEG sets between Krt8+ transitional cells identified by Strunz and colleagues and either KrasG12D (e) or Kraswt (f) KACs from this study. g, UMAP clustering of cells integrated from our mouse cohort with cells in the scRNA-seq datasets from studies by Marjanovic et al. and Dost et al. h, Proportions and average expression levels of select marker genes for diverse alveolar and tumour cell subsets and across clusters defined in panel g with cluster 5 (C5) shown to be enriched with KAC markers. i, KAC signature expression across clusters defined in panel g. n cells in each cluster: 2 = 2,463; 11 = 154; 1 = 3,480; 0 = 4,396; 5 = 1,362; 4 = 1,513; 3 = 2,392; 10 = 219; 8 = 577; 7-0 = 382; 6 = 1,042; 9 = 285; 7-1 = 141; 7-2 = 115; 12 = 119. j, Distribution of cells from C5 across the three indicated cohorts (left). KAC signature enrichment across KACs from the three cohorts and relative to pooled AT2 cells (right). Box-and-whisker definitions are similar to Extended Data Fig. 1f. n cells in each box-and-whisker: KACs, Marjanovic et al = 90; This study = 485; Dost et al = 343; AT2 = 3,762. k, KAC signature score in human AT2 cells with induced expression of KRASG12D (Dox) relative to KRASwt cells (Ctrl) from the Dost et al. study. Dox: Doxycycline. Box-and-whisker definitions are similar to Extended Data Fig. 1f. n cells in each box-and-whisker: Ctrl = 802; Dox = 1,341. P value was calculated using two-sided Wilcoxon Rank-Sum test. l, Mouse KAC signature expression in KACs (left) and malignant cells (Malignant, right) from KM-LUADs relative to EM-LUADs in our human scRNA-seq dataset. Box-and-whisker definitions are similar to Extended Data Fig. 1f. n cells in each box-and-whisker: KACs, EM-LUADs = 135; KACs, KM-LUADs = 719; Malignant, EM-LUADs = 5,457; Malignant, KM-LUADs = 2,472. P values were calculated using two-sided Wilcoxon Rank-Sum test. Source Data
Extended Data Fig. 11
Extended Data Fig. 11. KACs are enriched in lungs and they precede the formation of KrasG12D tumours in an AT2 lineage reporter tobacco carcinogenesis mouse model.
a, Representative IF analysis of KRT8, GFP, and LAMP3 in GFP-labelled AT2-derived mouse lung organoids (n = 3 wells per condition) derived from tamoxifen-exposed AT2 reporter mice at EOE to saline (n = 4 mice) or NNK (n = 5 mice). Scale bar: 10 μm. b, UMAP distribution of GFP+ cells at 3 months following NNK exposure or saline and coloured by alveolar or tumour subsets. c, Proportions and average expression levels of select marker genes for mouse normal alveolar cell lineages and tumour cells defined in b. d, Fraction of KrasG12D cells across alveolar and early tumour subsets. Absolute numbers of KrasG12D cells are indicated on top of each bar. e, UMAPs of GFP+ cells from tumour-bearing AT2 reporter mice at 3 months following NNK or saline and coloured by presence of KrasG12D mutation or expression of KAC, AT1, and AT2 signatures. f, UMAPs showing distribution of alveolar and tumour cell subsets (left) as well as cells with KrasG12D mutation (right) by treatment (saline or NNK). g, Trajectories of GFP+ cells from tumour-bearing reporter mice at 3 months following NNK or saline coloured by inferred pseudotime (left), differentiation (middle), and cell lineage and showing subset composition (right). h, CytoTRACE (left) and pseudotime (right) scores across GFP+ subsets. Box-and-whisker definitions are similar to Extended Data Fig. 1f. n cells in each box-and-whisker: AT2 = 144; Early–AT2-like tumour = 144; KAC–KAC-like = 288; AT1 = 72.
Extended Data Fig. 12
Extended Data Fig. 12. KAC-rich organoids are sensitive to targeted inhibition of KRAS.
a, Size quantification of organoids derived from GFP+ lungs cells of mice treated with saline (derived from 10 mice and plated into 4 wells) or NNK (derived from 13 mice and plated into 12 wells) at 3 months post-exposure. Box-and-whisker definitions are similar to Extended Data Fig. 1f. n organoids in each group: Saline = 63; NNK = 66. P value was calculated using two-sided Wilcoxon Rank-Sum test. b, Analysis of relative viability 4 days post treatment of LKR13 and MDA-F471 cells following treatment with increasing concentrations of MRTX1133. n samples in each group of LKR13 cells: - = 7; 1 = 7; 10 = 3; 40 = 4; 100 = 3. n samples in each group of MDA-F471 cells: - = 8; 1 = 8; 10 = 7; 40 = 11; 100 = 6. n.s: non-significant (P > 0.05). Error-bars: standard deviations of means. P values were calculated using an ordinary one-way ANOVA with Dunnett’s post-test. Results are representative of two independent experiments. c, Western blot analysis for the indicated proteins and phosphorylated proteins at 3 h post-treatment to EGF without or with increasing concentrations of the KRASG12D inhibitor MRTX1133 (from Mirati Therapeutics, Inc.). Proteins were run on additional gels (4 per cell line) to separately blot with antibodies against phosphorylated and total forms of each of the indicated proteins (Supplementary Fig. 9). Vinculin protein levels were analysed as loading control for each gel whereby four LKR13 and four MDA-F471 blots are shown in Supplementary Fig. 9. For lysates from each of the two cell lines, vinculin blots from Gel 1 (Supplementary Fig. 9) are selected and shown in this figure panel. Uncropped images of western blots with molecular weight ladder are also shown in Supplementary Fig. 9. Results are representative of three independent experiments. EGF: epidermal growth factor. d, Size quantification of organoids derived from GFP+ lungs cells of NNK-treated AT2 reporter mice and treated with 200 nM MRTX1133 or control DMSO in vitro (n = 6 wells per condition). Box-and-whisker definitions are similar to Extended Data Fig. 1f. n samples (organoids) in each group: DMSO = 38; MRTX1133 = 53. P value was calculated using two-sided Wilcoxon Rank-Sum test. e, IF analysis showing representative organoids derived from sorted GFP+ cells from AT2 reporter mice that were exposed to saline (top two rows; n = 4 wells) or exposed to NNK and then treated ex vivo with DMSO (middle two rows; n = 6 wells) or 200 nM MRTX1133 (bottom two rows; n = 6 wells). Scale bars = 50 μm except for the first DMSO-treated organoid (third row) whereby scale bar = 100 μm. Staining was repeated three times with similar results. Source Data
Extended Data Fig. 13
Extended Data Fig. 13. Analysis of labelled Krt8+ cells following tobacco carcinogen exposure.
a, Representative images of IF analysis of tdT, LAMP3, and NKX2-1 in lung tissues of control saline-treated mice (upper row; n = 2), in non-tumour (normal) lung regions of mice at end of an 8-week NNK exposure (middle row; n = 3), as well as in non-tumour (normal) lung regions of mice at 8–12 weeks following EOE to NNK (lower row; n = 3), and in Gprc5a−/−;Krt8-creER;RosatdT/+ mice. IF analysis of tdT and LAMP3 in tumours detected in Gprc5a−/−;Krt8-creER;RosatdT/+ mice and showing strong (b, n = 10) and negative/low (c, n = 7) tdT labelling in tumour cells. Scale bars = 10 μm.

References

    1. Kadara H, Scheet P, Wistuba II, Spira AE. Early events in the molecular pathogenesis of lung cancer. Cancer Prev. Res. 2016;9:518–527. doi: 10.1158/1940-6207.CAPR-15-0400. - DOI - PubMed
    1. Cardarella S, Johnson BE. The impact of genomic changes on treatment of lung cancer. Am. J. Respir. Crit. Care Med. 2013;188:770–775. doi: 10.1164/rccm.201305-0843PP. - DOI - PMC - PubMed
    1. Timar J. The clinical relevance of KRAS gene mutation in non-small-cell lung cancer. Curr. Opin. Oncol. 2014;26:138–144. doi: 10.1097/CCO.0000000000000051. - DOI - PubMed
    1. Tomasini P, Walia P, Labbe C, Jao K, Leighl NB. Targeting the KRAS pathway in non-small cell lung cancer. Oncologist. 2016;21:1450–1460. doi: 10.1634/theoncologist.2015-0084. - DOI - PMC - PubMed
    1. Kadara H, et al. Transcriptomic architecture of the adjacent airway field cancerization in non-small cell lung cancer. J. Natl Cancer Inst. 2014;106:dju004. doi: 10.1093/jnci/dju004. - DOI - PMC - PubMed

MeSH terms