. 2024 Mar;627(8003):358-366.
doi: 10.1038/s41586-024-07138-0. Epub 2024 Feb 28.

Crym-positive striatal astrocytes gate perseverative behaviour

Affiliations

Crym-positive striatal astrocytes gate perseverative behaviour

Matthias Ollivier et al. Nature. 2024 Mar.

Abstract

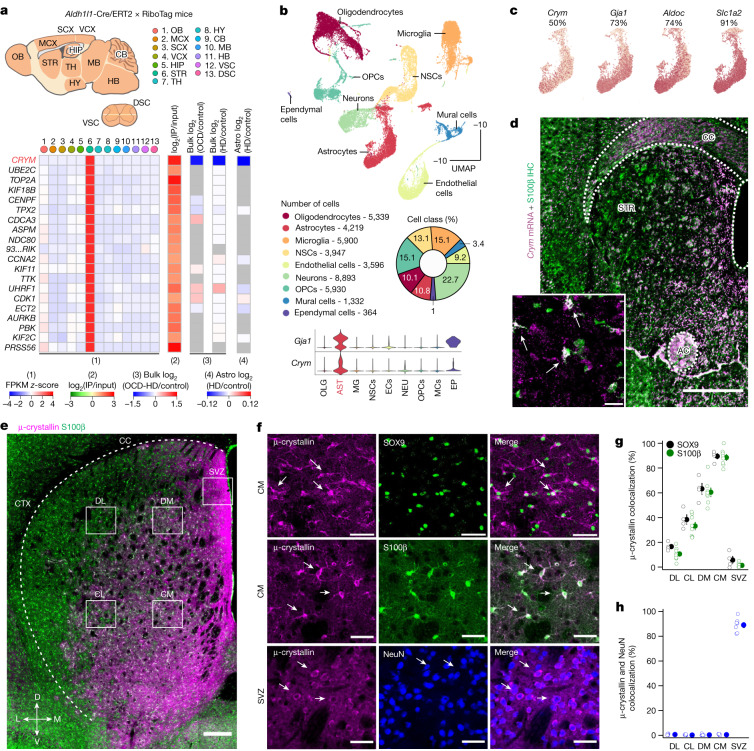
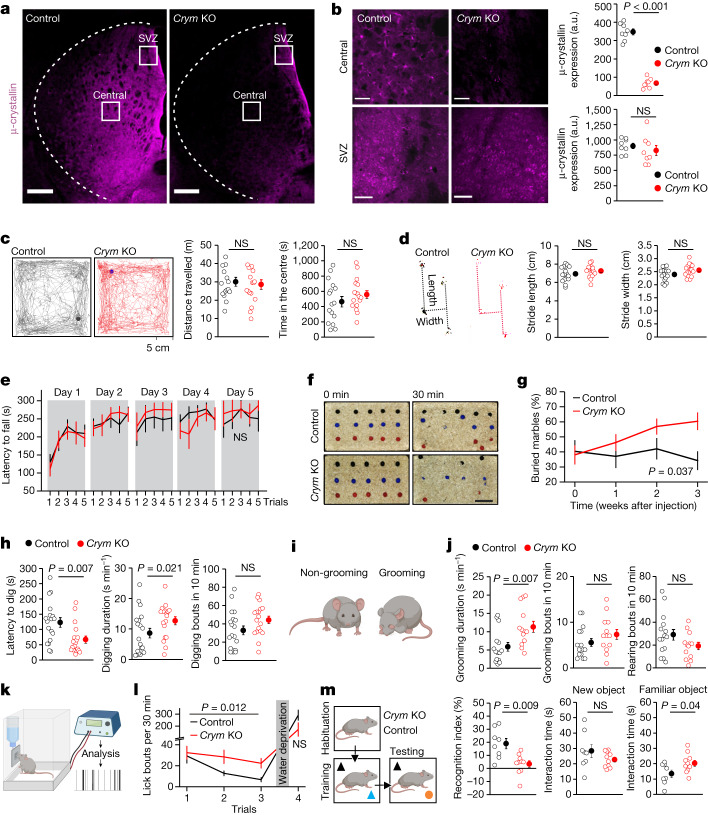
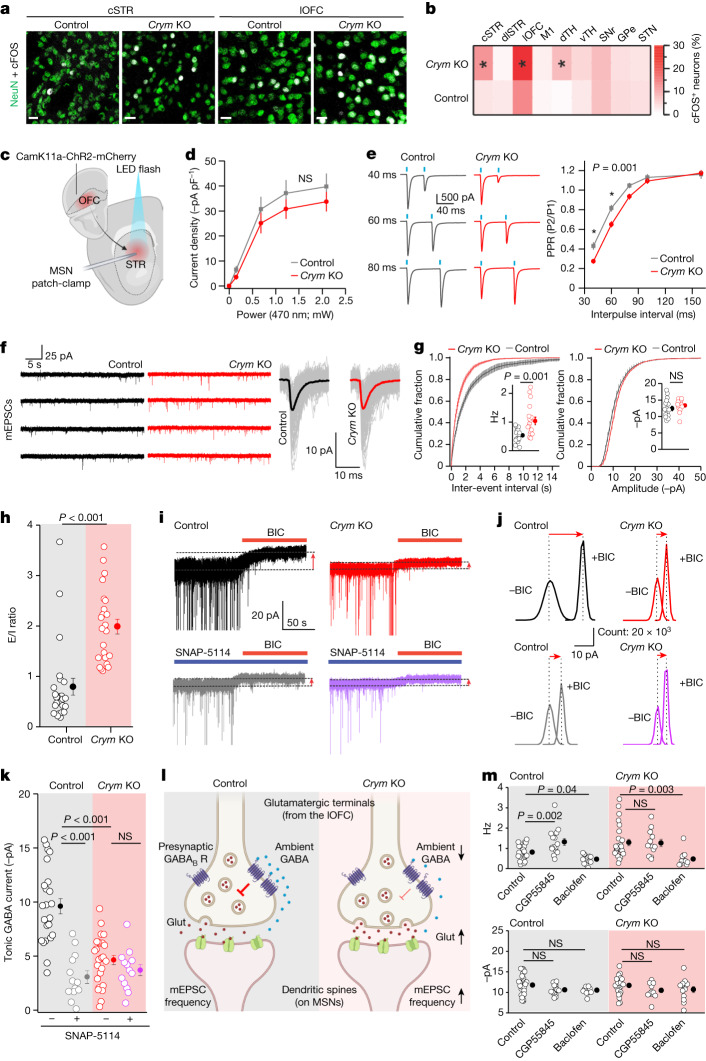
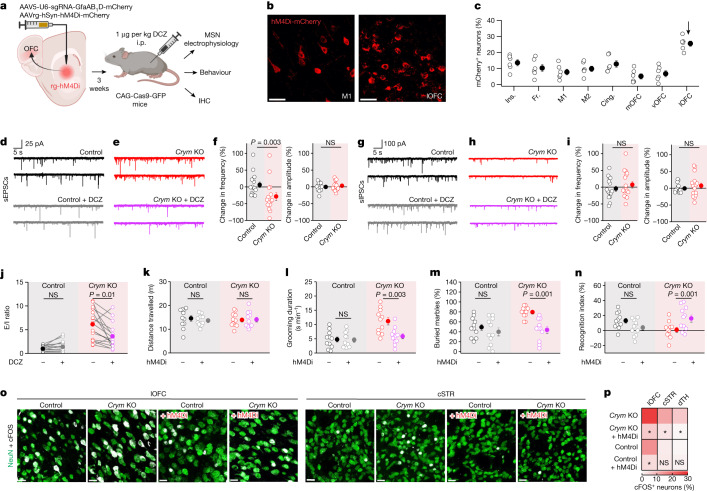
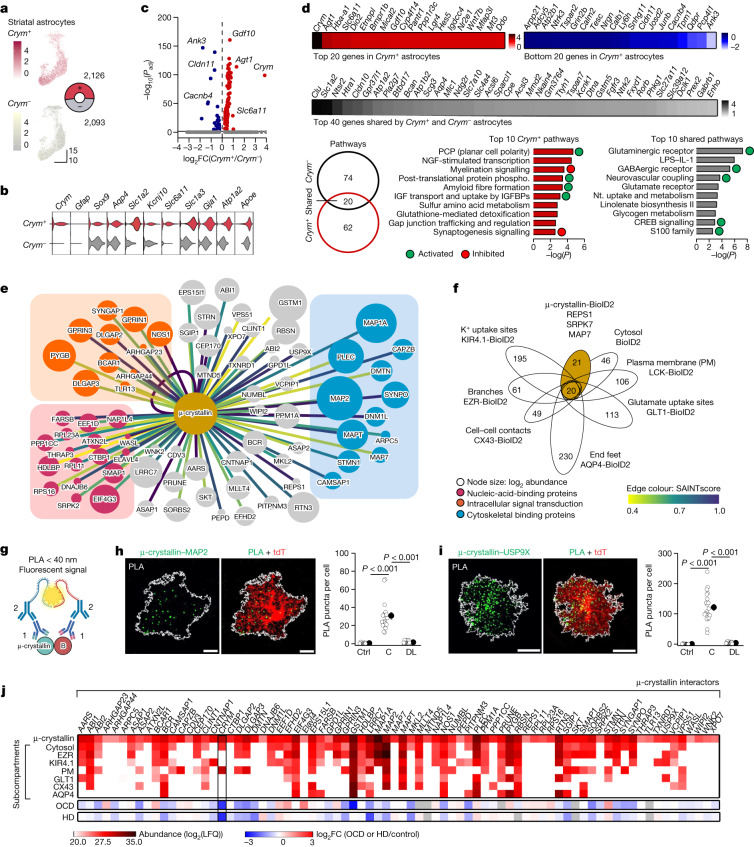
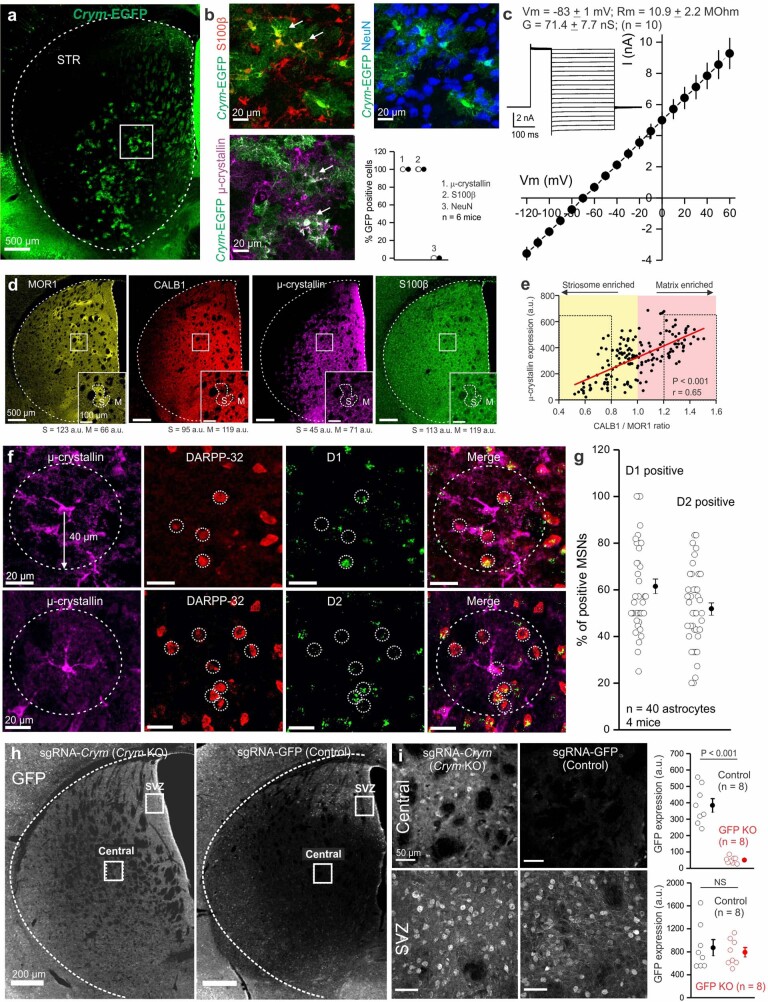
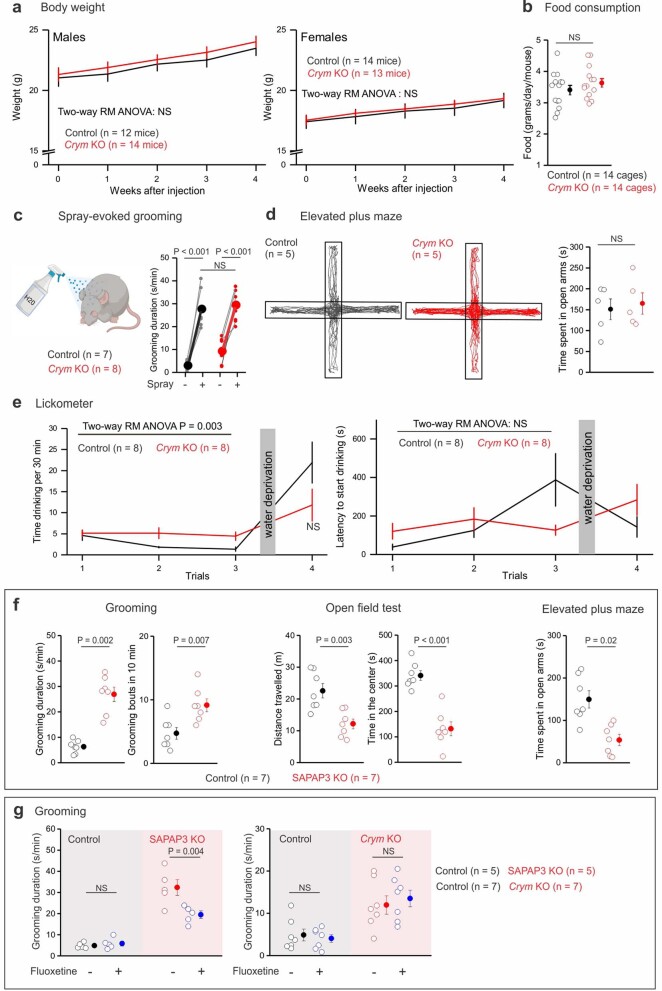
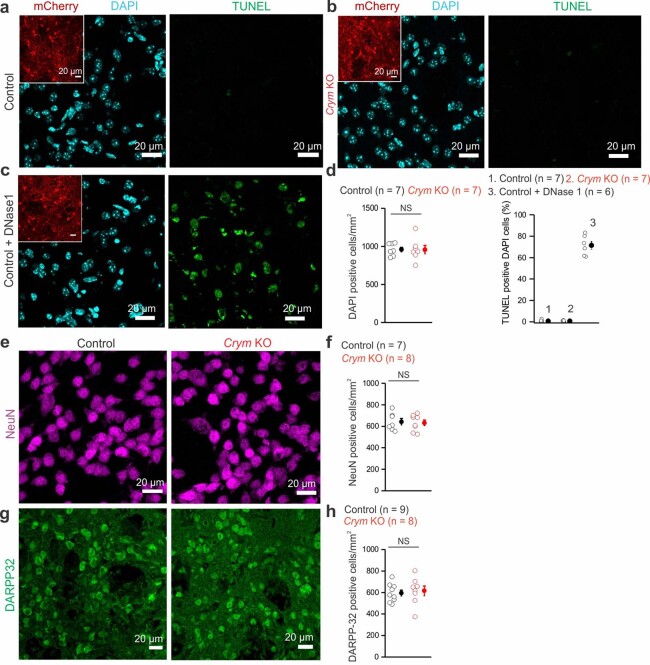
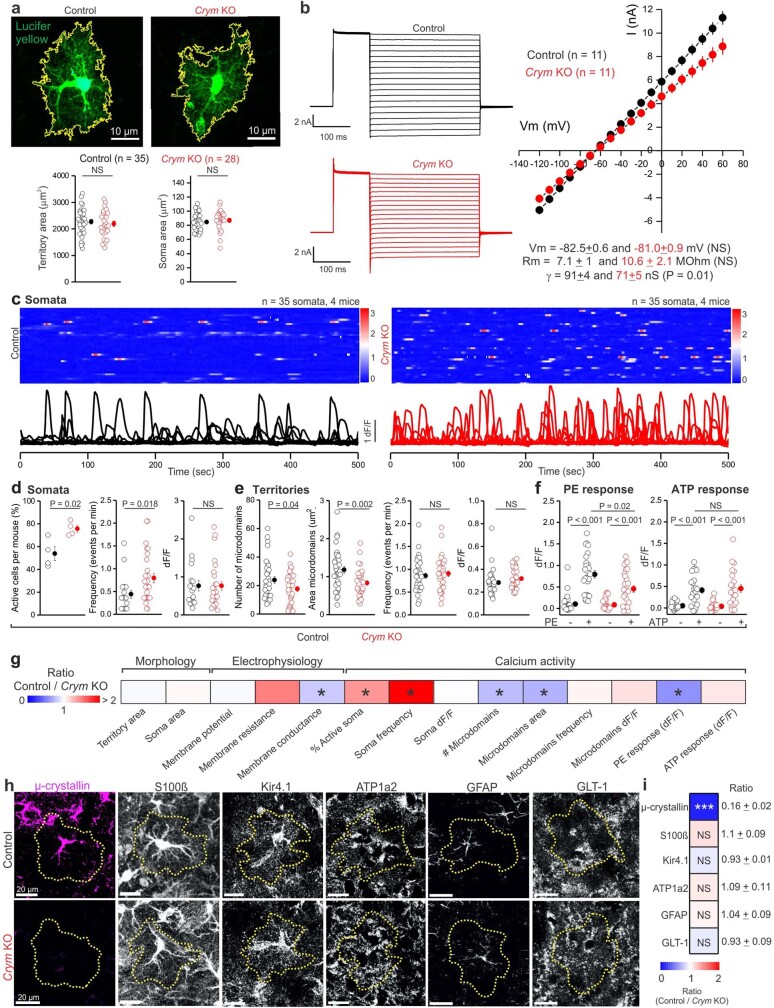
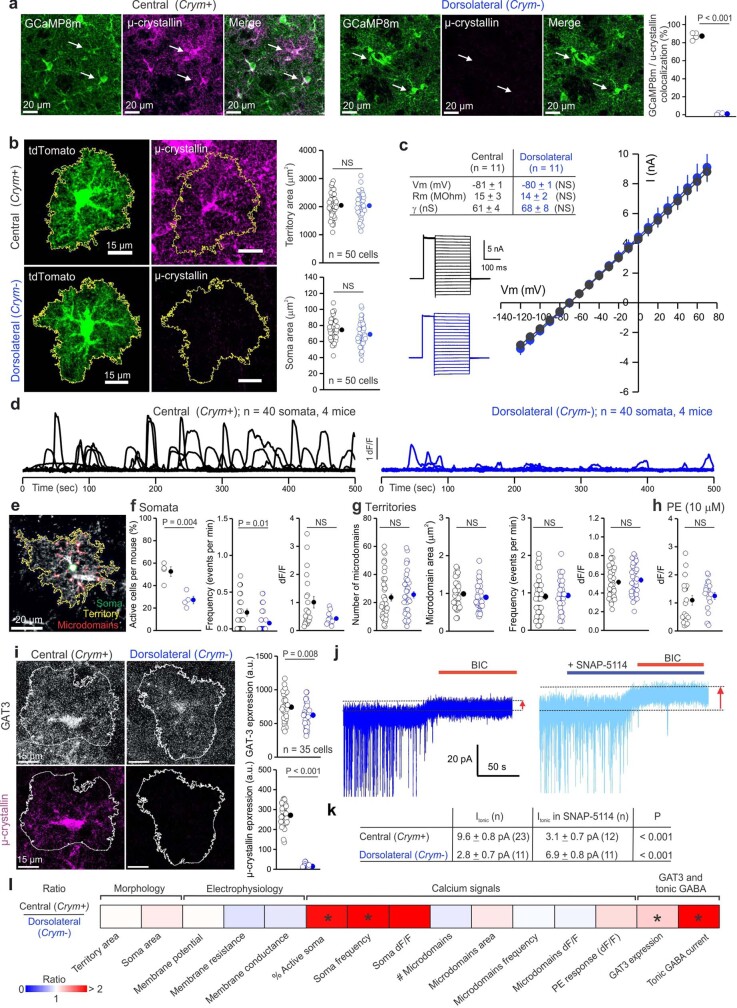
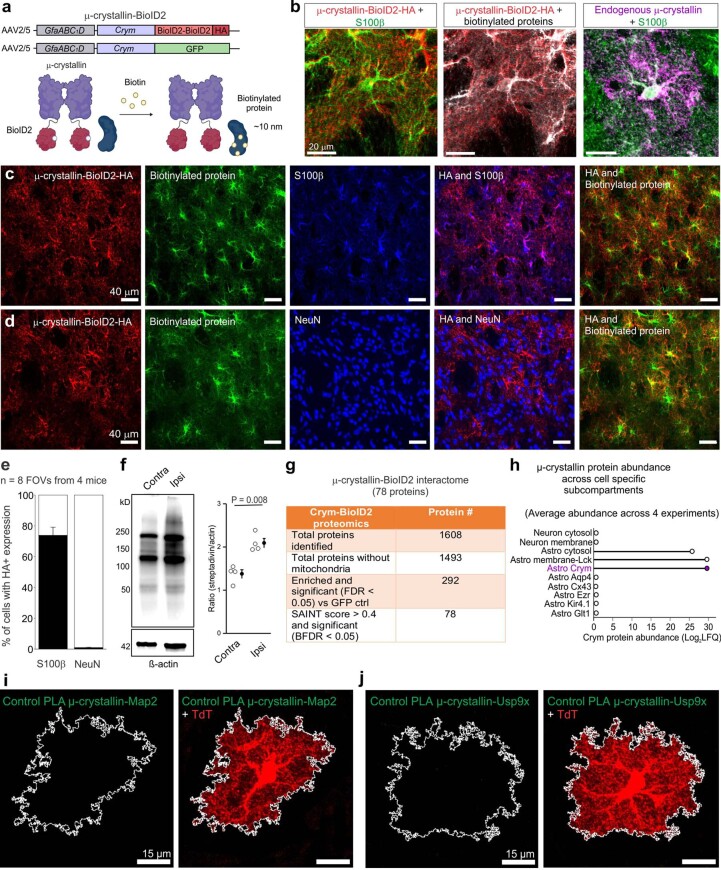
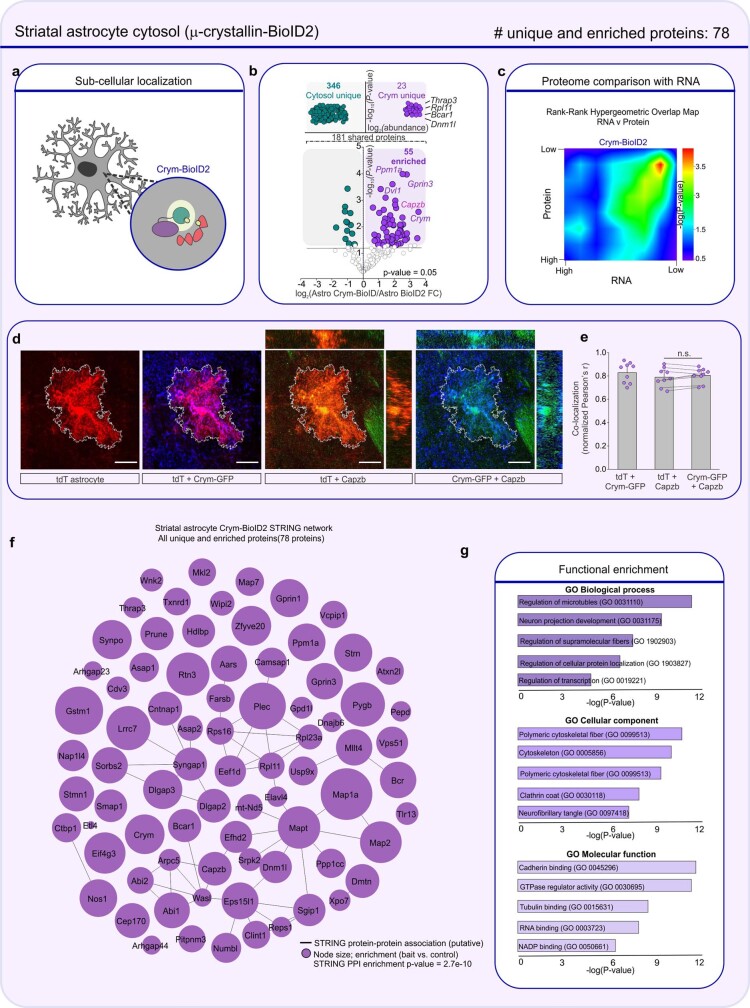
Astrocytes are heterogeneous glial cells of the central nervous system1-3. However, the physiological relevance of astrocyte diversity for neural circuits and behaviour remains unclear. Here we show that a specific population of astrocytes in the central striatum expresses μ-crystallin (encoded by Crym in mice and CRYM in humans) that is associated with several human diseases, including neuropsychiatric disorders4-7. In adult mice, reducing the levels of μ-crystallin in striatal astrocytes through CRISPR-Cas9-mediated knockout of Crym resulted in perseverative behaviours, increased fast synaptic excitation in medium spiny neurons and dysfunctional excitatory-inhibitory synaptic balance. Increased perseveration stemmed from the loss of astrocyte-gated control of neurotransmitter release from presynaptic terminals of orbitofrontal cortex-striatum projections. We found that perseveration could be remedied using presynaptic inhibitory chemogenetics8, and that this treatment also corrected the synaptic deficits. Together, our findings reveal converging molecular, synaptic, circuit and behavioural mechanisms by which a molecularly defined and allocated population of striatal astrocytes gates perseveration phenotypes that accompany neuropsychiatric disorders9-12. Our data show that Crym-positive striatal astrocytes have key biological functions within the central nervous system, and uncover astrocyte-neuron interaction mechanisms that could be targeted in treatments for perseveration.


Conflict of interest statement

The authors declare no competing interests.

Figures

Fig. 1
Fig. 1. A molecularly defined and allocated Crym+ population of striatal astrocytes.
a, Top 20 striatal-astrocyte-enriched genes from RNA-seq of 13 brain areas: OB, olfactory bulb; MCX, motor cortex; SCX, somatosensory cortex; VCX, visual cortex; HIP, hippocampus; STR, striatum; TH, thalamus; HY, hypothalamus; CB, cerebellum; MB, midbrain; HB, hindbrain; DSC, dorsal spinal cord; VSC, ventral spinal cord. The fragments per kilobase per million mapped fragments (FPKM) z-score shows the 20 striatal-astrocyte-enriched genes as compared with other areas and their enrichment (log2 immunoprecipitated (IP)/input). The orphan gene 9330182L06RiK has been abbreviated as 93...RiK in a. The other heat maps show the genes plotted from bulk RNA-seq data from human OCD and HD and in astrocytes from individuals with HD relative to control individuals. b, scRNA-seq of two-month-old striatum optimized for cellular diversity, as seen in cell-class percentages. Uniform manifold approximation and projection (UMAP) of 39,156 cells from the striatum shows cell classes, including astrocytes. Violin plots show astrocyte enrichment of Gja1 and Crym (n = 4 mice). OLG, oligodendrocytes; AST, astrocytes; MG, microglia; NSCs, neural stem cells; ECs, endothelial cells; NEU, neurons; OPCs, oligodendrocyte precursor cells; MCs, mural cells; EP, ependymal cells. c, Crym was expressed in around 50% of astrocytes; astrocytic markers were found in more. d, Crym mRNA expression along with S100β IHC; inset higher magnification (representative of n = 16 sections from 4 mice). Scale bars, 500 μm (main); 20 μm (inset). CC, corpus callosum. AC, anterior commissure. e, Images of µ-crystallin (magenta) and astrocytic S100β (green) IHC. µ-crystallin shows a dorsoventral and lateromedial spatial gradient (CTX, cortex; SVZ, subventricular zone; DL, dorsolateral striatum; DM, dorsomedial striatum; CL, centrolateral striatum; CM, centromedial striatum). Scale bar, 200 μm. f, Magnified images of µ-crystallin (magenta) and SOX9 (green), and μ-crystallin and S100β (green) IHC in the centromedial striatum (CM). μ-crystallin and NeuN IHC in the SVZ are also shown. Scale bars, 40 μm. g,h, Percentage of astrocytes (g; S100β+ and SOX9+) and neurons (h; NeuN+) expressing µ-crystallin (n = 4, 8 and 7 mice for SOX9, S100β and NeuN, respectively). The white arrows in panels d and f point to instances of co-localization in the images. Average data shown as mean ± s.e.m. and all statistics reported in Supplementary Table 5. Source Data
Fig. 2
Fig. 2. Deletion of astrocytic Crym in the central striatum induces perseveration.
a, Striatal expression of µ-crystallin in mice injected with control sgRNA-GFP or Crym KO sgRNA-Crym AAVs. Scale bars, 200 μm. b, µ-Crystallin was reduced in the central striatum but not in the SVZ in Crym KO mice (n = 8 mice; two-tailed two-sample t-test; P = 5.3 × 10−10 for µ-crystallin). a.u., arbitrary units. NS, not significant. Scale bars, 50 μm. c, Traces of 30-min open-field recordings for control and Crym KO mice. Graphs of travel distance and time spent in the centre (n = 16 control and n = 17 Crym KO; two-tailed two-sample t-test). d, Footprint tests for control and Crym KO mice (n = 16 control and n = 17 Crym KO; two-tailed two-sample t-test). e, Time on the rotarod (n = 8 mice; two-way repeated-measures ANOVA followed by Tukey’s post-hoc test). f, Marble-burying tests in control and Crym KO mice. Scale bar, 10 cm. g, Buried marbles before and after AAV injection (n = 16 mice; two-way repeated-measures ANOVA followed by Tukey’s post-hoc test). h, Latency to start, total duration and digging bouts over 10 min in control (n = 19) and Crym KO (n = 18) mice (two-tailed Mann–Whitney and two-tailed two-sample t-test). i, Cartoons of self-grooming behaviour: mice disengaged and engaged in self-grooming. j, Self-grooming duration, grooming bouts and rearing bouts in control (n = 15) and Crym KO (n = 13) mice (two-tailed Mann–Whitney and two-tailed two-sample t-test). k, Schematic of the lickometer. l, Lick bouts and the total drinking time over 30 min for each trial (n = 8; two-way ANOVA). m, Evaluations of novel object recognition. Graphs show recognition index (%) and the interaction time with the new and familiar object (n = 8 control and n = 10 Crym KO; two-tailed Mann–Whitney and two-tailed two-sample t-test). Average data shown as mean ± s.e.m. and all statistics reported in Supplementary Table 5. Source Data
Fig. 3
Fig. 3. Astrocytic loss of μ-crystallin alters lOFC–striatum synapses.
a, cFOS and NeuN in the central striatum (cSTR) and lateral orbitofrontal cortex (lOFC). Scale bars, 20 μm. b, Heat map: percentage of cFOS+ neurons. * indicates P < 0.05 (dlSTR, dorsolateral striatum; M1, motor cortex 1; dTH, dorsal thalamus; vTH, ventral thalamus; SNr, substantia nigra reticulate; GPe, globus pallidus external; STN, subthalamic nucleus. SNr and STN, n = 5 mice both groups; lateral and dorsal thalamus and GPe, n = 6 mice both groups; M1 and striatum n = 8 mice both groups, lOFC n = 7 control mice and 8 Crym KO mice; two-sample t-tests and Mann–Whitney test). c, Injection of AAV2-CamK11a-ChR2-mCherry into the lOFC with recordings from the central striatum. d, EPSCs after 2-ms light pulses (n = 18 cells (control) and n = 17 cells (Crym KO) from 5 mice; two-way repeated-measures ANOVA). e, Representative data for evoked EPSCs (n = 17 cells (control) and n = 18 cells (Crym KO) from 5 mice; two-way ANOVA, *P < 0.05). f, mEPSC traces and averages from one representative MSN. g, Cumulative probability graphs for inter-event interval and amplitude; inset shows pooled data (n = 18 cells from 5 mice for both control and Crym KO; two-tailed Mann–Whitney test). h, Excitatory/inhibitory (E/I) ratios (n = 24 cells from 5 mice; two-tailed Mann–Whitney test; P = 1.5 × 10−6). i,j, Representative data (i) and histograms (j) used to measure tonic GABA currents before and after GAT3 inhibition by SNAP-5114. BIC, bicuculline. k, Tonic GABA currents from experiments such as those in i (control and Crym KO: n = 26 cells from 8 mice; control and Crym KO treated with SNAP-5114: n = 13 cells from 4 mice; two-way ANOVA with Tukey’s post-hoc test, overall ANOVA P = 2 × 10−11). l, In control mice, ambient GABA inhibits the release of glutamate (Glut) through the activation of presynaptic GABAB receptors (GABAB R). Crym KO mice show decreased ambient GABA-induced presynaptic inhibition and increased glutamate release. m, mEPSC frequency (top) and amplitude (bottom) before and after treatment with a GABAB antagonist (CGP55845) or agonist (R-baclofen) (n = 12–29 cells from 4 mice; one-way ANOVA with Tukey’s post-hoc test). Average data shown as mean ± s.e.m. Source Data
Fig. 4
Fig. 4. Presynaptic chemogenetics corrects lOFC–striatum synaptic communication in Crym KO mice.
a, Approach for the co-expression of retrograde (rg) hM4Di-mCherry (or mCherry as control) and sgRNAs against Crym (or against GFP as control). b, Retrograde labelling of neurons in M1 and the lOFC using rg-hM4Di-mCherry. Scale bars, 20 μm. c, hM4Di-mCherry-positive neurons in various parts of the cortex (n = 6 mice). Ins, insular cortex. Fr, frontal cortex. M1, motor cortex 1. M2, motor cortex 2. Cing, cingulate cortex. mOFC, medial orbitofrontal cortex. vOFC, vental orbitofrontal cortex. lOFC, lateral orbitofrontal cortex. d, sEPSC current waveforms from a representative MSN in control mice before (top) and during (bottom) treatment with DCZ (200 nM). e, As in d, but for Crym KO. f, Per cent change in sEPSC frequency (left) or amplitude (right) after DCZ applications for control and Crym KO (n = 16 cells from 4 mice; two-tailed Mann–Whitney or two-tailed 2-sample t-tests). gi, As in df, but for sIPSCs (n = 16 cells from 4 mice; two-tailed Mann–Whitney or two-tailed two-sample t-tests). j, Excitatory/inhibitory (E/I) ratio in control and Crym KO mice before and after DCZ applications (n = 16 paired cells from 4 mice; two-tailed paired-sample t-test; P = 6.6 × 10−3 for Crym KO). kn, Distance travelled in open-field test (k), grooming (l), marble burying (m) and novel object recognition (n) behaviours of control and Crym KO mice without or with rg-hM4Di after treatment with DCZ (n = 11 mice per group; two-way ANOVA followed by Tukey’s post-hoc test). o, cFOS (white) and NeuN (green) expression in the lOFC (left) and the central striatum (right) in control and Crym KO mice without or with rg-hM4Di activation in vivo. Scale bars, 20 μm. p, Percentage of cFOS+ neurons in the four conditions for the lOFC, cSTR and dTH. *P < 0.05 (n = 6 mice; two-way ANOVA followed by Tukey’s post-hoc test, and one-way ANOVA per brain area). Average data shown as mean ± s.e.m. and all statistics reported in Supplementary Table 5. Source Data
Fig. 5
Fig. 5. Properties and mechanisms of Crym+ and Crym astrocytes.
a, UMAP of striatal astrocytes segregated by Crym expression. b, Violin plot of 10 astrocyte markers in Crym+ and Crym astrocytes. c, Volcano plot of differentially expressed genes between Crym+ and Crym astrocytes. d, The top 20 most (FDR < 0.05) enriched genes and the 20 most depleted 20 genes in Crym+ astrocytes (scale bar, log2FC). Top 40 shared genes (of 2,520) in grey (scale bar, log2FC). Ingenuity pathway analysis (IPA) based top ten shared pathways for Crym+ and Crym astrocytes and the top ten unique pathways for Crym+ astrocytes. NGF, nerve growth factor. IGF, insulin like growth factor. IGFBP, insulin like growth factor binding protein. Nt, neurotransmitter. LPS, lipopolysaccharide. e, Interaction map of 78 µ-crystallin interacting proteins. Node sizes represent enrichment compared to GFP. Edge colours represent the SAINT protein–protein interaction probability score. All proteins had a SAINT Bonferroni-corrected false discovery rate (BFDR) less than 0.05. f, Clustergram of common and unique proteins (78 proteins) detected in Crym-BioID2 relative to astrocyte-specific subcompartments. Proteins represent those that were significant after normalization (log2FC > 1 and FDR < 0.05 versus GFP controls). g, Schematic of the PLA. h, Images of PLA puncta for µ-crystallin and MAP2 in tdTomato (tdT)-positive astrocytes. Graph: puncta per tdT+ astrocyte in control experiments (ctrl), central (C) and dorsolateral (DL) striatum. Scale bars, 15 μm. i, As in h, but for and µ-crystallin and USP9X (n  =  18 and 21 tdTomato+ astrocytes from 4 mice per group, one-way ANOVA followed by Tukey’s post-hoc test). Scale bars, 15 μm. j, Abundance of µ-crystallin interactors in different astrocyte subcompartments from f. The bottom heat map shows log2FC of the μ-crystallin interactors from human OCD and HD post-mortem RNA-seq. Average data shown as mean ± s.e.m. and all statistics reported in Supplementary Table 5. Source Data
Extended Data Fig. 1
Extended Data Fig. 1. μ-crystallin immunostaining.
a,b, μ-crystallin is not expressed in Olig2+ oligodendrocytes on the basis of representative images (a) and average data across mice and across regions of the striatum (b; n = 4 mice) where μ-crystallin was expressed in astrocytes (see also main text of manuscript and Fig. 1). c, Sagittal (left) and coronal (right) whole brain images show µ-crystallin (magenta) and NeuN (blue) expression. (V, ventricle; HIP, hippocampus; CTX, cortex; STR, striatum; OA, olfactory area; VP: ventral pallidum; NAc, nucleus accumbens; SNC, substance nigra compact; ns, nigrostriatal bundle; MTu, medial tuberal nucleus; OT, olfactory tubercule). d, µ-crystallin (magenta), S100β (green) and NeuN (blue) striatal expression during postnatal development from P0 to P180 (from left to right). Scale bars = 500 µm. e, Quantification of µ-crystallin, S100β, and NeuN expression in the central striatum (n = 4 mice for P0, P15, P30, P60 and n = 5 mice for P7, P180). fi, μ-crystallin expression in different ages (2, 12, and 22 months in f,g) as well as in male and female mice at 2 months (h,i). There was no significant change in μ-crystallin expression at 12 and 22 months of age in relation to 2-month-old mice, which are approximately the age used in most of our work (n = 5 mice; One-way ANOVA tests followed by Tukey’s post-hoc test, overall ANOVA P = 0.57 for µ-crystallin, 0.0021 for S100ß and 0.0018 for NeuN at 22 months old). There was also no difference in the expression of μ-crystallin between male and female mice (n = 5 mice; two-way ANOVA tests followed by Tukey’s post-hoc test). Average data are shown as mean ± s.e.m. and all statistics are reported in Supplementary Table 5. Source Data
Extended Data Fig. 2
Extended Data Fig. 2. µ-crystallin expression in the central striatum during postnatal development.
Images of µ-crystallin (magenta), S100β (green) and NeuN (blue) protein expression in the central striatum (CM) during postnatal development from P0 to P180. White arrowheads show µ-crystallin-positive astrocytes. Scale bars, 20 µm. Source Data
Extended Data Fig. 3
Extended Data Fig. 3. µ-crystallin expression in the SVZ during postnatal development.
Images of µ-crystallin (magenta), S100β (green) and NeuN (blue) protein expression in the SVZ during postnatal development from P0 to P180 (V, Ventricle). White arrowheads show µ-crystallin-positive cells. Scale bars, 20 µm. Source Data
Extended Data Fig. 4
Extended Data Fig. 4. Further characterization of μ-crystallin-positive astrocytes.
a, Whole striatal image of Crym-EGFP BAC transgenic mice show bushy GFP positive cells in the central and ventral striatum. b, Merged images of GFP positive cells (green) with S100β (red), µ-crystallin (magenta), and NeuN (blue). Scatter graph shows the percent of GFP positive cells who are S100β, µ-crystallin or NeuN positive (n = 6 mice). c, Whole-cell voltage clamp performed on GFP positive cells in the central striatum. The waveforms, the current-voltage curve and the membrane properties correspond to astrocyte membrane properties (n = 10 cells from 4 mice). d, Striatal expression of the striosome marker MOR1 (yellow), matrix enriched protein CALB1 (red), µ-crystallin (magenta), and S100β (green). Inset panels show zoomed in images and corresponding intensity values (a.u.) for striosome (S) and Matrix (M) compartments. e, Correlation of µ-crystallin expression and CALB1/MOR1 ratio. A ratio <1 reflects striosome compartment and a ratio > 1 reflects matrix compartment enrichment, respectively. The Pearson correlation coefficient shows a positive correlation (two-tailed Pearson correlation test, r = 0.65; P = 7.6 ×10⁻²¹) with matrix enrichment (161 ROIs from n = 4 mice). μ-crystallin expression levels were 173 ± 22 and 458 ± 15 a.u. in striosome and matrix, respectively (n = 4 mice). f, Representative images of µ-crystallin-positive astrocytes and DARPP-32, D1 (top) or D2 (bottom) mRNA positive MSNs (green). g, D1 and D2 positive MSNs were counted in an area of 80 µm diameter surrounding each µ-crystallin-positive astrocyte. Scatter graph shows the percent of D1 or D2 positive MSNs within a Crym positive astrocyte territory (n = 40 astrocytes from 4 mice). h,i, CRISPR–Cas9-mediated deletion of GFP in the central striatum. h, Whole striatal images show GFP expression in mice injected with control AAV (sgRNA-GFP) or a Crym KO AAV (sgRNA-Crym). i, Images of GFP expression in the central striatum and SVZ. Scatter graphs show that GFP expression was strongly reduced in the central striatum but not changed in the SVZ in GFP KO mice (n = 8 mice, two-tailed Mann–Whitney, P = 9.4 × 10−4, and two-tailed two-sample t-test). Average data are shown as mean ± s.e.m. and all statistics are reported in Supplementary Table 5. Source Data
Extended Data Fig. 5
Extended Data Fig. 5. Additional behaviours and comparison with SAPAP3−/− mice.
a, Body weight of males (left) and females (right) before and after AAV injection for 4 weeks (two-way repeated-measures ANOVA followed by Tukey’s post-hoc test). b, Scatter graph shows the home cage food consumption in control and Crym KO mice (n = 14 cages with more than 2 mice per cage; two-sample t-test). c, Schematic and graph show grooming duration evoked by spraying the mice with water for control and Crym KO mice (n = 7 control mice and n = 8 Crym KO mice; two-way repeated-measures ANOVA followed by Tukey’s post-hoc test, P = 8.9 x 10⁻⁸). d, Representative 20 min elevated plus maze recording for control and Crym KO mice. Scatter graph shows the time spent in open arms for control and Crym KO mice (n = 5 mice; two-tailed two-sample t-test). e, Scatter graphs show the time drinking and the latency to start drinking over 30 minutes for each trial completed for 4 days (n = 8 mice; two-way repeated-measures ANOVA followed by Tukey’s post-hoc test). f, Scatter graphs show self-grooming duration, grooming bouts, distance travelled, time spent in the centre, and time spent in the open arms in control and SAPAP3 KO mice (n = 7 mice; two-tailed Mann–Whitney test or two-tailed two-sample t-test, P = 4 x 10⁻⁵ for the time in the centre). g, Scatter graphs show self-grooming duration after fluoxetine treatment (blue) in control and SAPAP3 KO mice (left; n = 5 mice; two-way repeated-measures ANOVA followed by Tukey’s post-hoc test) and in control and Crym KO mice (right; n = 7 mice; two-way repeated-measures ANOVA followed by Tukey’s post-hoc test). Average data are shown as mean ± s.e.m.and all statistics are reported in Supplementary Table 5. Source Data
Extended Data Fig. 6
Extended Data Fig. 6. No change in apoptosis and neuronal markers in control and Crym KO astrocytes.
ac, Representative images of TUNEL (green), mCherry (red), and DAPI (blue) in control (a), Crym KO (b), and control + DNase1 (c) mice. d, Scatter graphs show the number of DAPI positive cells (left) and TUNEL positive cells (right) (n = 7 mice for control and Crym KO and n = 6 mice for control + DNase 1, two-tailed two-sample t-test). There were no differences in the number of DAPI+ cells between controls and Crym KO mice and no TUNEL staining was observed, except for the positive control. e,f, Representative images (e) and scatter graphs (f) of the number of NeuN positive cells in 7 control mice and 8 Crym KO mice (two-tailed two-sample t-test). g,h, Representative images (g) and scatter graphs (h) of the number of DARPP-32 positive cells in 9 control mice and 8 Crym KO mice (two-tailed two-sample t-test). Average data are shown as mean ± s.e.m. and all statistics are reported in Supplementary Table 5. Source Data
Extended Data Fig. 7
Extended Data Fig. 7. Functional characterization of control and Crym KO astrocytes.
a, Representative images for control and Crym KO striatal astrocytes filled with Lucifer yellow by iontophoresis. Bottom scatter graphs show the territory area (left) and soma area (right) (n = 35 cells for control and n = 28 cells for Crym KO from 4 mice, two-tailed Mann–Whitney test or two-tailed two-sample t-test). b, Whole-cell voltage clamp performed in control and Crym KO striatal astrocytes. Representative currents waveforms, average current-voltage relationships, membrane potential (mV), membrane resistance (MOhm) and slope conductance (nS) are shown (n = 11 cells from 4 mice, two-tailed two-sample t-test and two tailed Mann-Whitney test). c, Kymographs and traces representing the ΔF/F of Ca2+ signals in astrocyte somata. d, Scatter graphs show the percent of active cells per mouse (n = 4 mice, two-tailed two-sample t-test), frequency, and ΔF/F in somata (n = 35 cells from 4 mice, two-tailed Mann–Whitney tests). e, Scatter graphs show the number, area, frequency, and ΔF/F of calcium signals in the astrocyte territories (n = 35 cells from 4 mice, two-tailed Mann–Whitney test or two-tailed two-sample t-test). f, Scatter graphs of Ca2+ signals, represented by ΔF/F, evoked by 10 µm phenylephrine (PE; n = 26 cells from 4 mice) (left) or by 100 µm ATP (right; n = 23 cells from 4 mice) in control and Crym KO astrocytes (Two-way ANOVAs followed by Tukey’s post-hoc test, ANOVA p-value overall genotype = 7.6 ×10⁻³ for PE and 8.4 x 10⁻¹ for ATP). g, Heat map summarizes the ratio of metrics from control vs Crym KO of all parameters assessed (* = P < 0.05). Statistical tests and P values for the heat map are from the corresponding data reported in the earlier panels in the figure. h,i, Marker expression in control and Crym KO astrocytes. Representative images (h) and ratios (i) for the expression of the various canonical astrocyte markers indicated. μ-crystallin was significantly reduced, but the other markers were not. The heat map shows the ratio of control vs Crym KO (n = 30 cells from 5 mice for µ-crystallin, S100ß, Kir4.1, GLT1 and n = 24 cells from 5 mice for ATP1a2, GFAP; Mann–Whitney test or two-sample t-test, *** P = 3 × 10−11, NS = non-significant). Average data are shown as mean ± s.e.m. and all statistics are reported in Supplementary Table 5. Source Data
Extended Data Fig. 8
Extended Data Fig. 8. Retrograde and anterograde evaluations of major cortical projections to the central striatum, in which Crym+ astrocytes are abundant.
a, Representative images show retrograde labelling using Alexa 647-conjugated cholera toxin subunit B (CTB-647). Left image shows the CTB-647 injection site in the central striatum (white arrow). Central image shows CTB-647 labelled neurons in different part of the cortex (M1, motor cortex 1; M2, motor cortex 2; Cing., cingulate cortex; Fr., frontal cortex; Ins., insular cortex; OFC, orbitofrontal cortex medial (m), ventral (v) or lateral (l)). Right images show CTB-647 labelled neurons in M1 and lOFC. b, Scatter graph of the number of CTB-647 positive neurons in different parts of the cortex (n = 5 mice). c, AAV1-hSyn-Chronos-GFP and AAV9-CamK11a-ChR2-mCherry were injected into M1 and lOFC to label the projections in the striatum. Images show lOFC and M1 projections in the striatum. d, Image and scatter graph show µ-crystallin expression in the M1 and lOFC projection area (n = 4 mice; two-tailed two-sample t-test, P = 3.2 x 10⁻⁵). Average data are shown as mean ± s.e.m. and all statistics are reported in Supplementary Table 5. Source Data
Extended Data Fig. 9
Extended Data Fig. 9. Further MSN properties in Crym KO mice.
a, Traces of MSN membrane responses to current injection (left) and relationship of injected current to number of APs (right) in control and Crym KO mice. b, Scatter graphs show the MSN resting membrane potential, membrane resistance, and rheobase in control (n = 28 cells from 11 mice) and Crym KO mice (n = 19 cells from 11 mice; two-tailed Mann–Whitney test or -two-tailed two-sample t-test). c, Cartoon of AAV2-CamK11a-ChR2-mCherry injection into the M1. Recordings were done in the central striatum. d, Graph shows the current density after brief pulses of 470 nm light (2 ms) at different power in control (n = 15 cells from 5 mice) and Crym KO (n = 20 cells from 5 mice; two-way repeated measure ANOVA). e, Representative traces and graph for evoked EPSCs due to paired stimuli in control (n = 15 cells from 5 mice) and Crym KO mice (n = 20 cells from 5 mice; two-way repeated measure ANOVA). f, Representative sEPSC traces from one individual representative MSN from control and Crym KO mice. g, Cumulative probability graph for the inter-event interval (left) and for the amplitude (right). Pooled data for the frequency and amplitude are shown in the inset bar graph (n = 39 cells from 16 mice for control and n = 34 cells from 14 mice for Crym KO, two-tailed Mann–Whitney t-tests, P = 2.8 x 10⁻⁴). h, Images of biocytin-labelled MSNs and dendritic spines in control (left) and Crym KO (right) mice. i, Sholl analyses performed with increments of 10 μm diameter (n = 9 MSNs in control and n = 10 MSNs in Crym KO from 5 mice; two-way repeated measure ANOVA). j, Scatter graphs show spine density and spin head width in control (n = 74 dendrites from 10 MSNs from 5 mice) and Crym KO mice (n = 86 dendrites from 11 MSNs from 5 mice; two-tailed two-sample t-test and two-tailed Mann–Whitney test). k, Representative sIPSC current traces (left) and individual traces and average (right) from one representative MSN from control and Crym KO mice. l, Cumulative probability graph for the inter-event interval (left) and for the amplitude (right). Pooled data for the frequency and amplitude are shown in the inset bar graph (n = 24 cells from 5 mice, two-tailed Mann–Whitney tests, P = 9.3 ×10⁻⁴). m, Scatter graph of 17 metabolites and 2 neurotransmitters (GABA and glutamate) measured by mass spectrometry (n = 6 mice; two-tailed Mann–Whitney test or two-tailed two-sample t-test; AKG as alpha-ketoglutarate and NAA as N-acetyl-aspartate). n, Scatter graphs show lactate/pyruvate, glutamate/aspartate, and glutamate/GABA ratio in control and Crym KO mice (n = 6 mice; two-tailed Mann–Whitney test or two-tailed two-sample t-test). Average data are shown as mean ± s.e.m. and all statistics are reported in Supplementary Table 5. Source Data
Extended Data Fig. 10
Extended Data Fig. 10. Assessments of GAT3, GABA and MAOB in control and Crym KO astrocytes, and supportive data for presynaptic chemogenetics.
af, Representative images and quantification of the expression of GAT3 (a,b), GABA (c,d) and MAOB (e,f) in control (left) and Crym KO astrocytes (right) (n = 30 cells from 6 mice for GABA and MAOB, n = 32 cells from 6 mice for GAT3; two-tailed Mann–Whitney test or two-tailed two-sample t-test, P = 6.5 × 10⁻⁸ for MAOB). gm, Presynaptic chemogenetics supportive data. g, Graphs show the sEPSC frequency (left) and amplitude (right) of control and Crym KO mice before and after 200 nM DCZ application (n = 16 cells from 4 mice, two-tailed paired-sample t-test and two-tailed paired sign test). h, As in g, but for sIPSC (n = 16 cells from 4 mice, two-tailed paired-sample t-test and two-tailed paired sign test). im, Graphs show the time in the centre (i), grooming duration (j), grooming bouts (k), rearing bouts (l) and % of buried marbles (m) of control and Crym KO mice with or without rg-h4DMi after DCZ or vehicle treatment (n = 11 mice per group; two-way ANOVA followed by Tukey’s post-hoc test). Average data are shown as mean ± s.e.m. and all statistics are reported in Supplementary Table 5. Source Data
Extended Data Fig. 11
Extended Data Fig. 11. Molecular mechanisms of µ-crystallin in striatal astrocytes and supplementary data for RNA-seq.
a, Unique and common pathways for the 2,519 shared genes versus the 178 enriched and depleted genes in the Crym+ population. Top 10 shared pathways for the Crym+ astrocytes versus other striatal astrocytes (grey) and top 10 unique pathways for Crym+ astrocytes (red) are shown. b, Volcano plot of differentially expressed genes (DEGs) (limmaVoom, FDR < 0.05) shows the numbers of up- and downregulated astrocyte genes between Crym KO IP and control IP. These analyses were restricted to genes with >2-fold enrichment in the IP compared with the input. Only Crym was found significantly downregulated. c, Heat maps of Log2FC for TH related genes, striatal TR1αdirectly targeted genes, and astrocytic transcriptional targets of T3 (* P = 5.1 x 10⁻⁴; NS, not significant). (d) Striatal astrocyte principal component (PCA) analysis of the 500 most variable genes across 8 samples. e, Gene-expression levels (in fragments per kilobase per million, FPKM) of cell-specific markers for astrocytes, neurons, oligodendrocytes, and microglia after a local injection of astrocyte-selective RiboTag AAV in the central striatum (IP samples) (n = 4 mice). Average data are shown as mean ± s.e.m. and all statistics are reported in Supplementary Table 3. Source Data
Extended Data Fig. 12
Extended Data Fig. 12. Functional properties of Crym+ and Crym astrocytes.
a, GCaMP8m expression in central (Crym+) and dorsolateral (Crym) astrocytes. Representative images for central and dorsolateral striatal astrocytes expressing cytosolic GCaMP8m (white arrows show GCaMP8m expressing astrocytes). Scatter graph shows the percent co-localization between GCaMP8m and µ-crystallin (n = 4 mice, two-tailed two-sample t-test, P = 1.3 ×10⁻⁸) There was no co-localization between μ-crystallin and GCaMP8m in the dorsolateral region, because astrocytes in this region do not express Crym. b, Representative images for central (Crym+) and dorsolateral (Crym) striatal astrocytes expressing tdTomato (left) and µ-crystallin (right). Scatter graphs show the territory and soma area (n = 50 cells from 5 mice, two-tailed two-sample t-test). c, Whole-cell voltage clamp recordings from central and dorsolateral striatal astrocytes. Representative current waveforms, average current-voltage relationships, membrane potential (mV), membrane resistance (MOhm) and slope conductance (nS) are shown (n = 11 cells from 4 mice, two-tailed two-sample t-test). d, Traces representing the ΔF/F of Ca2+ signals in somata of central (Crym+) and dorsolateral (Crym) astrocytes. Astrocytes from the central striatum were more active. e, Representative image of GCaMP8m expressing astrocyte showing somatic, territory and microdomain regions of interest. f, Scatter graphs show the percent of active cells per mouse when assessed over 500 s (n = 4 mice), the frequency of Ca2+ signals per cell, and their ΔF/F in somata (n = 40 cells from 4 mice, two-tailed two-sample t-test and two-tailed Mann-Whitney test). As seen in the representative traces in d, astrocytes in the central striatum were more active within their somata. g, Scatter graphs show the number, area, frequency, and ΔF/F of Ca2+ signals in astrocyte territories (n = 40 cells from 4 mice, two-tailed Mann–Whitney or two-tailed two-sample t-test); there were no differences. h, Scatter graphs of Ca2+ signals, represented by ΔF/F, evoked by 10 µM phenylephrine (PE). There were no differences (n = 20 cells from 4 mice; two-tailed two-sample t-test). i, Representative images (left) and quantification (right) of the expression of GAT3 and µ-crystallin in central and dorsolateral striatal astrocytes (n = 35 cells from 4 mice, two-tailed Mann–Whitney or two-tailed two-sample t-test, P = 6.5 ×10⁻¹³ for µ-crystallin). GAT3 was higher in the central striatal astrocytes. j, Current recordings in voltage clamp (−60 mV) from MSNs in dorsolateral striatal astrocytes. Dashed lines and arrows indicate the changes of baseline holding current induced by application of bicuculline (BIC = 25 µM) or bicuculline after a pre-application of GAT3 inhibitor SNAP-5114 (40 μM). For comparison, traces for central astrocytes are shown in Fig. 3. k, The inset table summarizes the tonic GABA currents for central and dorsolateral striatal astrocytes. Tonic GABA currents were larger in the central striatum and were reduced by a pre-application of the GAT3 blocker, SNAP-5114, indicating GAT3 contributed GABA to the extracellular space. However, in the dorsolateral striatum, tonic GABA currents were smaller and increased by pre-application of SNAP-5114, indicating that in this region GAT3 removed GABA from the extracellular space. l, Heat map shows the ratio of the various metrics for central (Crym+) vs dorsolateral (Crym) astrocytes for all the parameters assessed above (* = P < 0.05). Statistical tests and P values for the heat map are from the corresponding data reported in the earlier panels in the figure. Average data are shown as mean ± s.e.m. and all statistics are reported in Supplementary Table 5. Source Data
Extended Data Fig. 13
Extended Data Fig. 13. Characterization and validation of Crym-BioID2 for proteomics.
a, Schematic of the astrocyte-specific Crym-BioID2 AAV construct and its corresponding GFP control. Proximal proteins within ~10 nm are biotinylated after the addition of exogenous biotin. b, Representative IHC images of striatal astrocytes from mice microinjected with GfaABC1D-Crym-BioID2 AAVs and treated with biotin. The tissue was immunostained with anti-HA antibody (red), S100β (green), or with a fluorophore conjugated streptavidin probe (grey). Right panel shows endogenous µ-crystallin (magenta) co-localized with S100β (green). c, Representative images of immunostained mouse striatum injected with astrocyte-specific Crym-BioID2 and then treated with biotin for 7 days. Panel shows the immunostaining pattern with S100β as an astrocyte cell marker. d, As in c but with NeuN as a neuronal cell marker. e, Bar graphs depicting the percent of S100β positive or NeuN positive cells with HA expression in a 40x magnification field of view. Black portion of the bar graphs show percent co-localization. (n  =  8 fields of view at 40x magnification from 4 mice). f, Western blot analysis of brain unilaterally microinjected with Crym-BioID2. Graph depicts the streptavidin signal intensity divided by the β-actin signal intensity for each data point. (n  =  4 mice; two-tailed paired t-test). For gel source data, see Supplementary Fig. 1. g, Table shows the number of peptides and proteins found in the astrocyte-specific Crym-BioID2 proteomics experiments. Each row shows the number of proteins after filtering. h, Bar graph shows the relative µ-crystallin protein expression in LFQ from each neuron and astrocyte subcompartment BioID2 proteomics experiment from ref. and the present study with Crym-BioID2. i, Images of PLA puncta for µ-crystallin and Map2 in tdTomato (tdT) positive astrocytes in a control experiment where the negative PLA probe was omitted. j, Same as i but for µ-crystallin and Usp9x. Average data are shown as mean ± s.e.m. and all statistics are reported in Supplementary Table 5. Source Data
Extended Data Fig. 14
Extended Data Fig. 14. μ-crystallin interactome astrocyte card.
a, BioID2 that is targeted with Crym-BioID2 biotinylates proteins that interact with μ-crystallin. b, LFQ comparison of significant proteins (Log2FC > 1 and FDR < 0.05 versus GFP controls) detected in the cytosolic Astro BioID2 and Crym-BioID2 reveal μ-crystallin enriched proteins. Top half of the volcano plot shows 23 unique Crym-BioID2 proteins when compared to cytosol. The top four most abundant proteins for Crym-BioID2 are shown. Lower half of volcano plot shows comparison of proteins that were common in both cytosolic BioID2 and Crym-BioID2. The five highest enriched proteins for Crym-BioID2 are shown. Magenta label shows protein that was validated with immunohistochemistry. c, Heat map shows the rank-rank hypergeometric overlap (RRHO) of the RNA and protein rank for the 78 Crym-BioID2 proteins. Red pixels represent highly significant overlap. Colour scale denotes the range of P values at the negative log10 scale (Bin size = 100). d, IHC analysis of Capzb protein in tdTomato and Crym-GFP labelled astrocytes shows co-localization within the astrocyte territory. Scale bar denotes 20 μm. e, Co-localization analysis using Pearson’s r coefficient shows co-localization between Crym-GFP and Capzb is equivalent to tdT, which is to be expected for these cytosolic proteins. The mean and s.e.m. are shown (n  =  8 tdTomato+ cells from 4 mice; Two-tailed paired t-test). f, Scale-free STRING analysis protein–protein association map of the 78 unique and enriched biotinylated proteins identified with Crym-BioID2. Node size represents the enrichment of each protein vs the GFP control (log2(BioID2/GFP)). Edges represent putative interactions from the STRING database. g, Bar graphs show the functional enrichment analysis of all 78 proteins using ‘Biological process’, “Cellular component”, and “Molecular function” terms from Enrichr. Average data are shown as mean ± s.e.m. and all statistics are reported in Supplementary Table 5. Source Data

References

    1. Khakh BS, Deneen B. The emerging nature of astrocyte diversity. Annu. Rev. Neurosci. 2019;42:187–207. doi: 10.1146/annurev-neuro-070918-050443. - DOI - PubMed
    1. Haim LB, Rowitch DH. Functional diversity of astrocytes in neural circuit regulation. Nat. Rev. Neurosci. 2017;18:31–41. doi: 10.1038/nrn.2016.159. - DOI - PubMed
    1. Khakh BS, Sofroniew MV. Diversity of astrocyte functions and phenotypes in neural circuits. Nat. Neurosci. 2015;18:942–952. doi: 10.1038/nn.4043. - DOI - PMC - PubMed
    1. Kinney CJ, Bloch RJ. µ-Crystallin: a thyroid hormone binding protein. Endocr. Regul. 2021;55:89–102. doi: 10.2478/enr-2021-0011. - DOI - PMC - PubMed
    1. Piantadosi SC, et al. Transcriptome alterations are enriched for synapse-associated genes in the striatum of subjects with obsessive-compulsive disorder. Transl. Psychiatry. 2021;11:171. doi: 10.1038/s41398-021-01290-1. - DOI - PMC - PubMed

MeSH terms