. 2024 Mar;627(8004):564-571.
doi: 10.1038/s41586-024-07118-4. Epub 2024 Feb 28.

Latitudinal patterns in stabilizing density dependence of forest communities

Affiliations

Latitudinal patterns in stabilizing density dependence of forest communities

Lisa Hülsmann et al. Nature. 2024 Mar.

Abstract

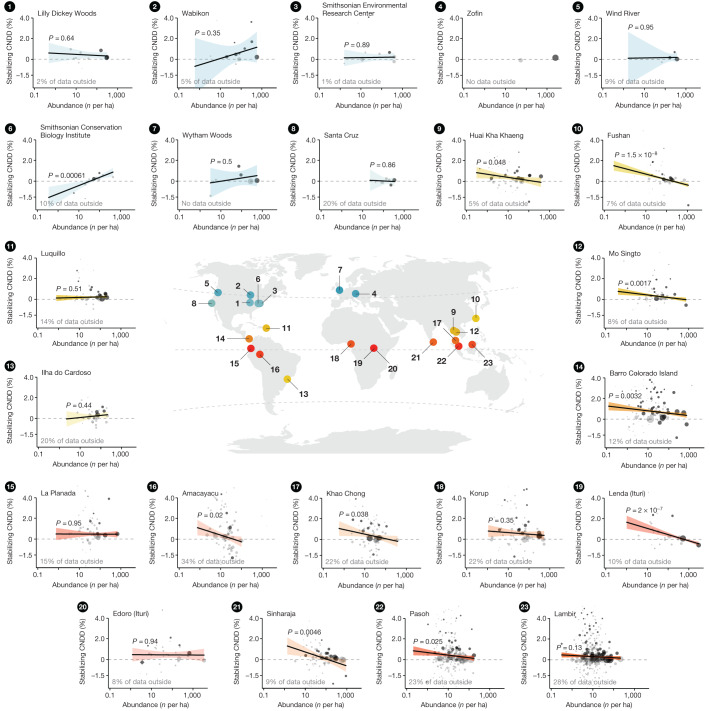
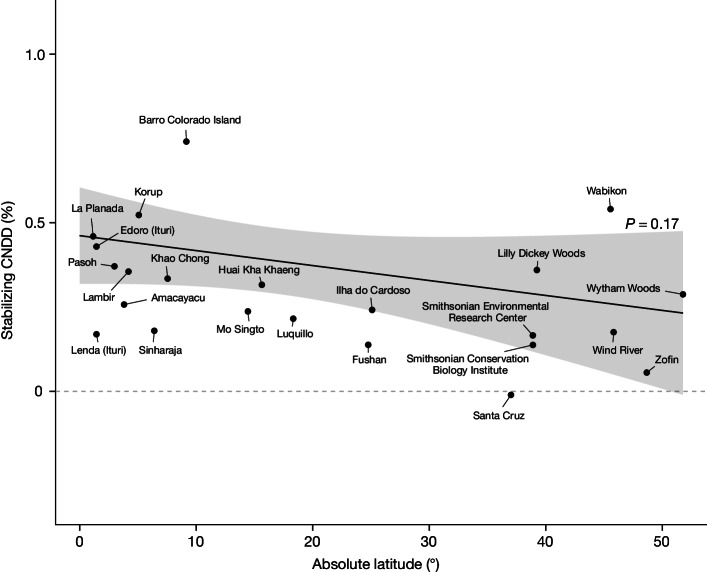
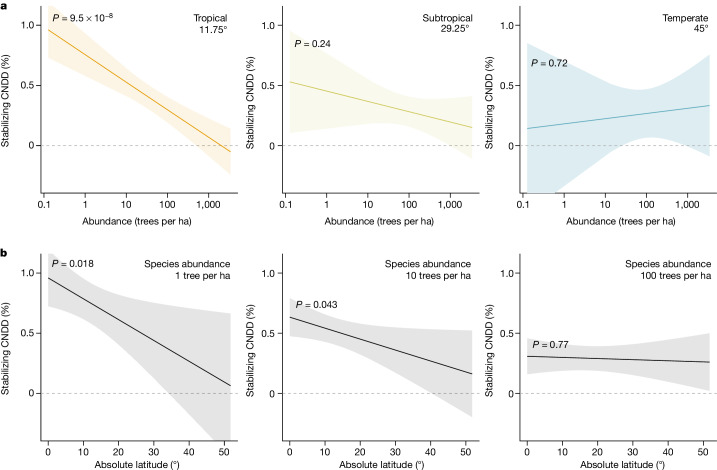
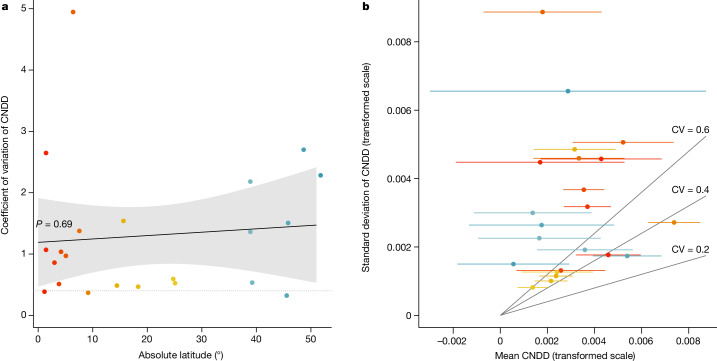
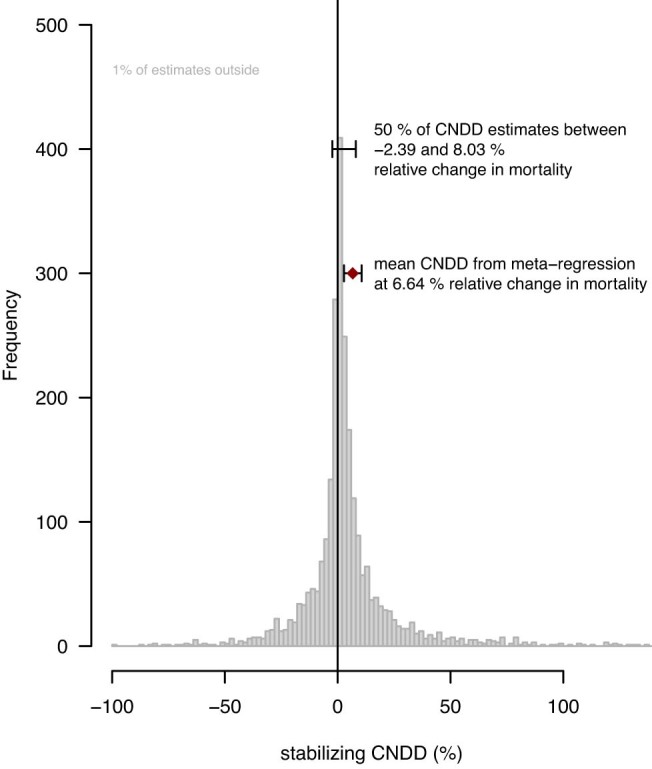
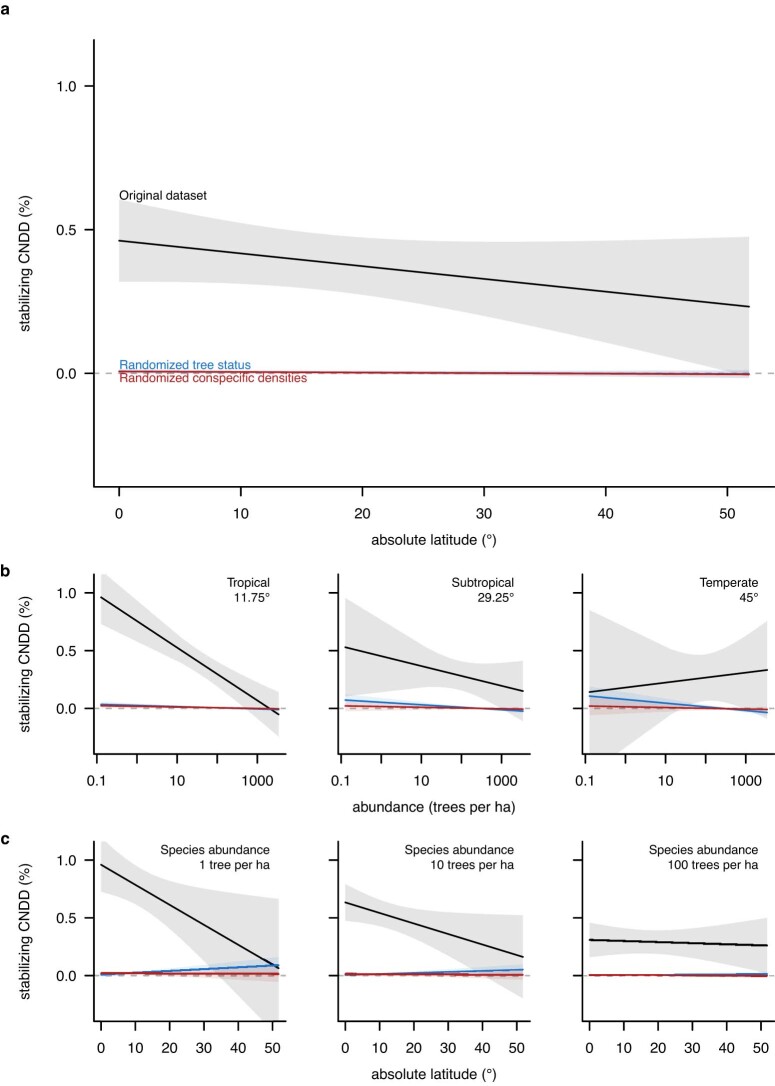
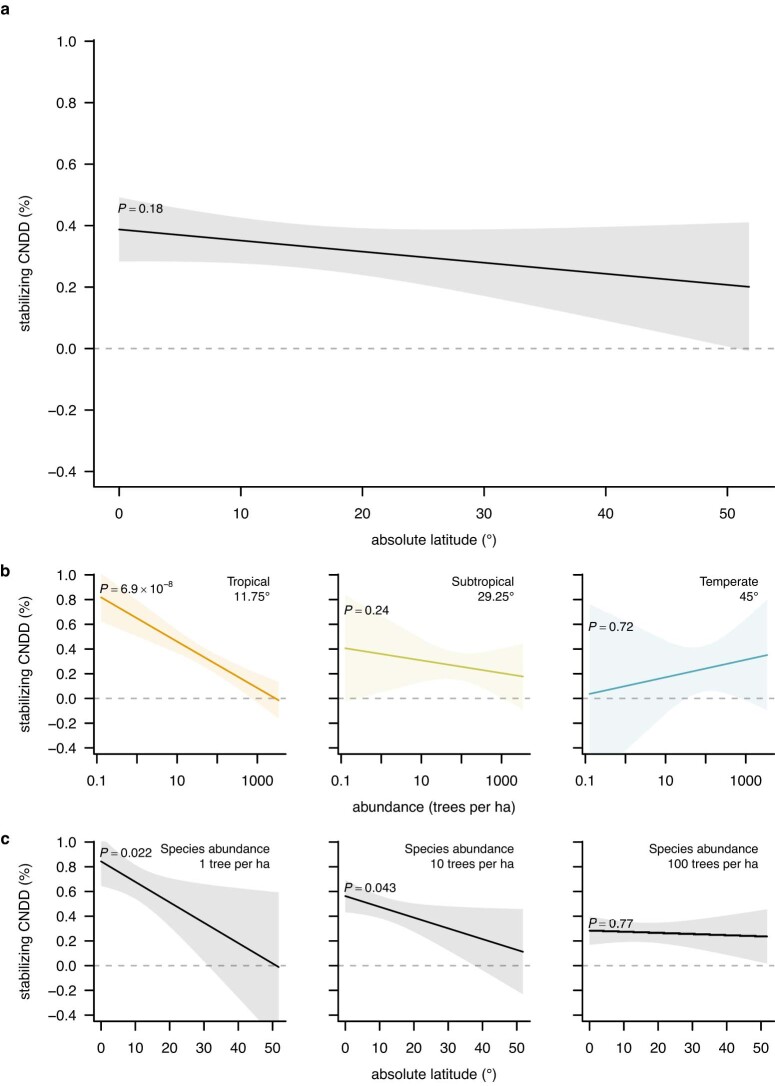
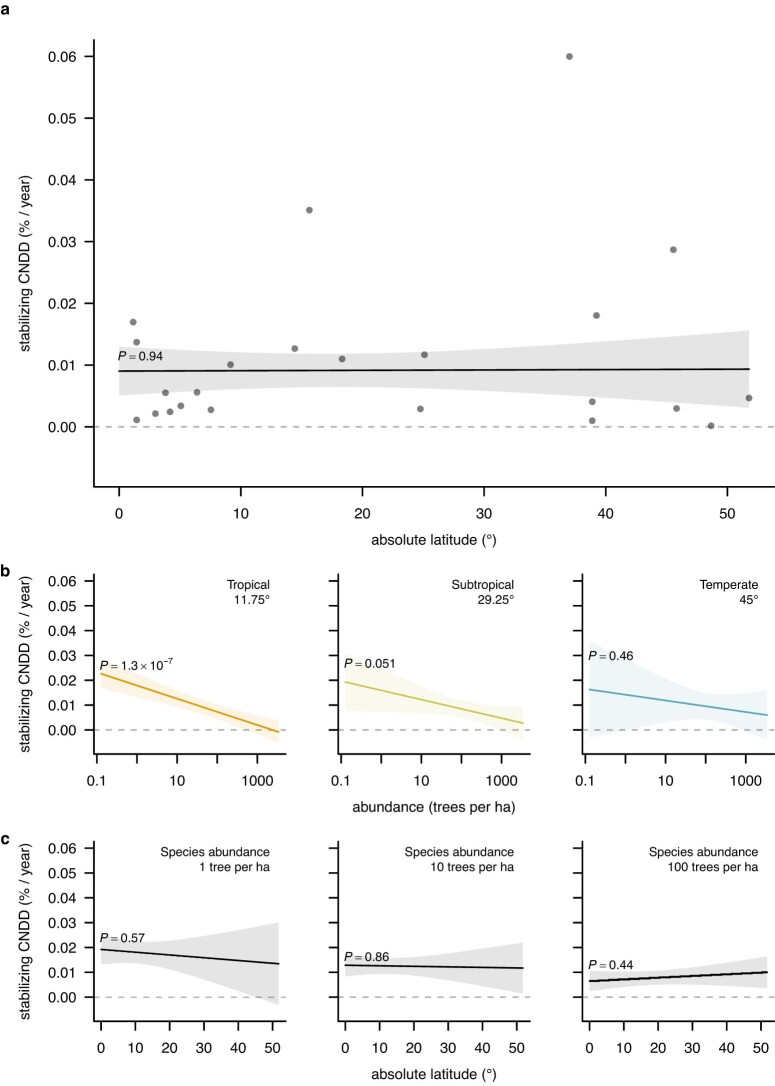
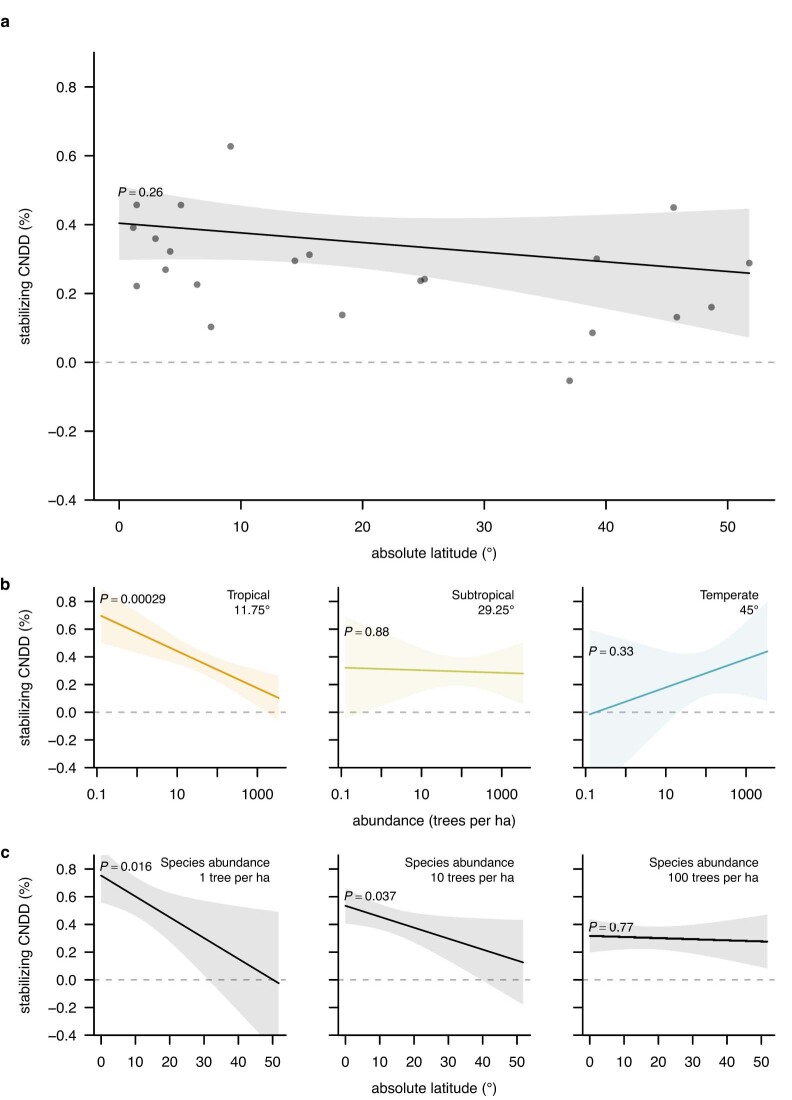
Numerous studies have shown reduced performance in plants that are surrounded by neighbours of the same species1,2, a phenomenon known as conspecific negative density dependence (CNDD)3. A long-held ecological hypothesis posits that CNDD is more pronounced in tropical than in temperate forests4,5, which increases community stabilization, species coexistence and the diversity of local tree species6,7. Previous analyses supporting such a latitudinal gradient in CNDD8,9 have suffered from methodological limitations related to the use of static data10-12. Here we present a comprehensive assessment of latitudinal CNDD patterns using dynamic mortality data to estimate species-site-specific CNDD across 23 sites. Averaged across species, we found that stabilizing CNDD was present at all except one site, but that average stabilizing CNDD was not stronger toward the tropics. However, in tropical tree communities, rare and intermediate abundant species experienced stronger stabilizing CNDD than did common species. This pattern was absent in temperate forests, which suggests that CNDD influences species abundances more strongly in tropical forests than it does in temperate ones13. We also found that interspecific variation in CNDD, which might attenuate its stabilizing effect on species diversity14,15, was high but not significantly different across latitudes. Although the consequences of these patterns for latitudinal diversity gradients are difficult to evaluate, we speculate that a more effective regulation of population abundances could translate into greater stabilization of tropical tree communities and thus contribute to the high local diversity of tropical forests.


Conflict of interest statement

The authors declare no competing interests.

Figures

Fig. 1
Fig. 1. Estimated stabilizing CNDD in tree mortality plotted against species abundance at the 23 forest plots, along with plot locations.
Points in small panels indicate CNDD estimates and abundances (number of trees with DBH ≥ 1 cm per hectare) of individual species or species groups. Larger point sizes indicate lower uncertainty (variance) in CNDD estimates. Points in dark grey indicate effects that are statistically significantly different from zero (with α = 0.05). Circles are individual species; diamonds are rare species analysed jointly as groups of rare trees or rare shrubs. Because of the high variation in CNDD estimates, not all species-specific estimates can be shown, but the proportion of data that is represented by the estimates outside the plotting area is indicated for each site. The regression lines, 95% confidence intervals (CI) and P values are based on meta-regression models fitted independently per site (except for the Zofin site, for which too few estimates were available). Dashed horizontal lines indicate zero stabilizing CNDD. Locations of forest sites and CNDD-abundance relationships are coloured by latitude (gradient from tropical forests in red–orange to subtropical forests in yellow–green and temperate forests in blue). Stabilizing CNDD is defined as the relative change (in %) in annual mortality probability (relative average marginal effect; rAME) induced by a small perturbation in conspecific density (one additional conspecific neighbour with DBH = 2 cm at a one-metre distance) while keeping total densities constant. Positive numbers indicate a relative increase in mortality with an increase in conspecific density; that is, CNDD.
Fig. 2
Fig. 2. Evaluation of the first hypothesized pattern, whereby the average strength of stabilizing CNDD across species becomes greater towards the tropics.
The estimated relationship of stabilizing CNDD to absolute latitude indicates that average species CNDD does not become significantly stronger toward the tropics (P = 0.17). The regression line and 95% CI are predictions from the meta-regression model fitted with species-site-specific CNDD estimates (n = 2,534 species or species groups from 23 forest sites) including absolute latitude as a predictor (‘mean species CNDD model’; see Table 1a). Black points are mean CNDD estimates per forest site from meta-regressions fitted separately for each forest site without predictors (as in Fig. 4); note that these points are not the direct data basis for the regression line. The dashed horizontal line indicates zero stabilizing CNDD. Stabilizing CNDD is defined as in Fig. 1; for the same plot with alternative definitions of CNDD see Extended Data Figs. 4 and 5.
Fig. 3
Fig. 3. Evaluation of the second hypothesized pattern, whereby CNDD more strongly regulates species abundances and thus community structure in the tropics.
a, The estimated relationship of stabilizing CNDD to absolute latitude and species abundance indicates that species-specific CNDD is considerably stronger for rare than for common species in tropical forests (P = 9.5 × 10−8), whereas species in subtropical and temperate forests show no statistically significant association between CNDD and species abundance (P = 0.24 and P = 0.72, respectively). b, Consequently, stabilizing CNDD of species with low abundance (here, one tree per hectare) is stronger in tropical than in temperate forests (P = 0.018), whereas CNDD of species with high abundance (here, 100 trees per hectare) shows no latitudinal gradient (P = 0.77). Note that a caveat to the comparison in b is that species abundance distributions and total community abundance change with latitude so that an abundance of one tree per hectare is not necessarily biologically comparable across latitudes. The regression lines and 95% CI are predictions from the meta-regression model (n = 2,534 species or species groups from 23 forest sites) including absolute latitude, species abundance and their interaction as predictors (‘abundance-mediated CNDD’ model; see Table 1b). Predictions in a are shown for the centres of three latitudinal geographic zones, with the tropical zone ranging between 0° and 23.5° absolute latitude, the subtropical between 23.5° and 35° and the temperate between 35° and 66.5°. Species abundance is quantified as the log-transformed number of trees per hectare. Confidence intervals and P values are obtained by refitting the model with data centred at the respective latitude or abundance value. Dashed horizontal lines indicate zero stabilizing CNDD. Stabilizing CNDD is defined as in Fig. 1; for the same plots with alternative definitions of CNDD, see Extended Data Figs. 4 and 5.
Fig. 4
Fig. 4. Evaluation of the third hypothesized pattern, whereby interspecific variation in stabilizing CNDD decreases towards the tropics.
a, Coefficients of variation (CV = s.d./mean) per forest site showed no statistically significant latitudinal pattern (P = 0.69) but were on average greater than what theory suggests as a maximum for stable coexistence, (CV > 0.4; dotted horizonal line; see ‘Stable coexistence and interspecific variation in CNDD’ in Methods) at all but three sites (Barro Colorado Island, La Planada and Wabikon), owing to large differences among species at comparatively weak CNDD (b). Mean CNDD and interspecific variation in CNDD (s.d.) per forest site were estimated using meta-regressions without predictors fitted separately for each forest site. Points are coloured by latitude (gradient from tropical forests in red–orange to subtropical forests in yellow–green and temperate forests in blue). The regression line, 95% CI and P value in a are based on a linear regression model. Grey lines in b indicate different CV values. Note that we excluded one site for which the average CNDD was less than 0 (Santa Cruz; Fig. 2), because positive conspecific density dependence is expected to be destabilizing, irrespective of species differences. Stabilizing CNDD is defined as in Fig. 1, but here means and s.d. are shown at the transformed scale; that is, log(rAME + 1).
Extended Data Fig. 1
Extended Data Fig. 1. Distribution of stabilizing CNDD calculated over species-site-specific interquantile ranges in conspecific density.
Besides the frequency distribution of species-site-specific estimates, the figure indicates the global average assessed through meta-regression with random intercepts for sites and species in sites (red diamond with 95% CI) and the interquantile range of the estimates. Note that 1% of the CNDD estimates are outside the limits of the x axis. Stabilizing CNDD is defined as the relative change (in %) in annual mortality probability (relative average marginal effect; rAME) induced by changing conspecific density from the first to the third quantile of observed conspecific densities per species while keeping total densities constant.
Extended Data Fig. 2
Extended Data Fig. 2. Robustness tests of the analysis pipeline based on randomized datasets.
ac, When observations of tree status (blue) or conspecific density (red) were randomized, stabilizing CNDD was practically zero at all latitudes (a) and for all species abundances (b,c). Rare species exhibited minimally, but significantly, stronger CNDD for the dataset with randomized tree status (blue), but the effect sizes varied by orders of magnitude from those observed in the original dataset (black). See ‘Robustness tests’ in Methods for details. For details on the visualization and definition of CNDD in a and b,c, see Figs. 2 and 3, respectively. Estimates of the meta-regressions are shown in Extended Data Table 2 (randomized datasets) and Table 1 (original dataset).
Extended Data Fig. 3
Extended Data Fig. 3. Robustness tests without the most influential observations.
ac, When influential observations were removed (nremoved = 99, see ‘Robustness tests’ in Methods for details), the qualitative patterns remained the same; that is, stronger CNDD for rare than for common species in the tropics (b,c) but not generally stronger tropical CNDD (a). For details on the visualization and definition of CNDD in a and b,c, see Figs. 2 and 3, respectively. Estimates of the meta-regressions are shown in Extended Data Table 2.
Extended Data Fig. 4
Extended Data Fig. 4. Alternative definition of stabilizing CNDD as the absolute change in mortality probability.
ac, Similar patterns to the main analysis are visible; that is, stronger CNDD for rare than for common species in the tropics (b,c) but not generally stronger tropical CNDD (a), but, in contrast to the main analysis, the interaction of species abundance and latitude was insignificant. See ‘Quantification of conspecific density dependence’ in Methods for details on the definition of CNDD. For details on the visualization in a and b,c, see Figs. 2 and 3, respectively. Estimates of the meta-regressions are shown in Extended Data Table 3.
Extended Data Fig. 5
Extended Data Fig. 5. Alternative definition of stabilizing CNDD calculated at low conspecific densities (invasion densities).
The patterns remained qualitatively the same as in the main analysis; that is, stronger CNDD for rare than for common species in the tropics (b,c) but not generally stronger tropical CNDD (a). See ‘Quantification of conspecific density dependence’ for details on the definition of CNDD. For details on the visualization in a and b,c, see Figs. 2 and 3, respectively. Note that for one of the sites (Smithsonian Conservation Biology Institute), no point could be drawn for mean CNDD in a because the site-specific meta-regression did not converge. Estimates of the meta-regressions are shown in Extended Data Table 3.

References

    1. Comita LS, et al. Testing predictions of the Janzen–Connell hypothesis: a meta-analysis of experimental evidence for distance- and density-dependent seed and seedling survival. J. Ecol. 2014;102:845–856. doi: 10.1111/1365-2745.12232. - DOI - PMC - PubMed
    1. Song X, Lim JY, Yang J, Luskin MS. When do Janzen-Connell effects matter? A phylogenetic meta-analysis of conspecific negative distance and density dependence experiments. Ecol. Lett. 2021;24:608–620. doi: 10.1111/ele.13665. - DOI - PubMed
    1. Comita LS, Muller-Landau HC, Aguilar S, Hubbell SP. Asymmetric density dependence shapes species abundances in a tropical tree community. Science. 2010;329:330–332. doi: 10.1126/science.1190772. - DOI - PubMed
    1. Janzen DH. Herbivores and the number of tree species in tropical forests. Am. Nat. 1970;104:501. doi: 10.1086/282687. - DOI
    1. Connell, J. H. in Dynamics of Populations (eds den Boer, P. J. & Gradwell, G. R.) 298–312 (Centre for Agricultural Publishing and Documentation, 1971).