. 2024 Feb 28;15(1):1821.
doi: 10.1038/s41467-024-45916-6.

Comprehensive characterization of IFNγ signaling in acute myeloid leukemia reveals prognostic and therapeutic strategies

Affiliations

Comprehensive characterization of IFNγ signaling in acute myeloid leukemia reveals prognostic and therapeutic strategies

Bofei Wang et al. Nat Commun. .

Abstract

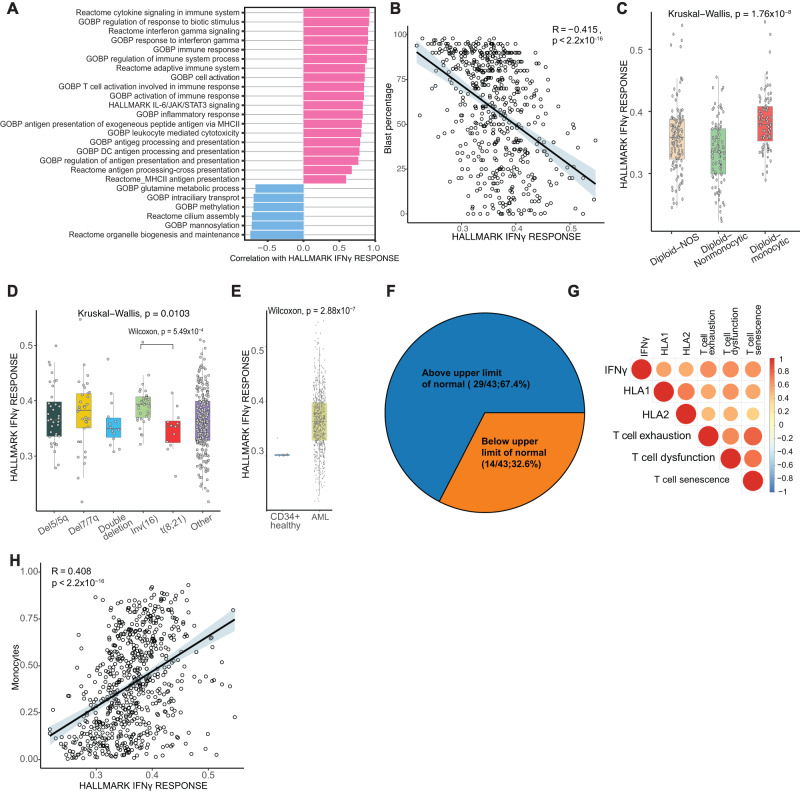
Interferon gamma (IFNγ) is a critical cytokine known for its diverse roles in immune regulation, inflammation, and tumor surveillance. However, while IFNγ levels were elevated in sera of most newly diagnosed acute myeloid leukemia (AML) patients, its complex interplay in AML remains insufficiently understood. We aim to characterize these complex interactions through comprehensive bulk and single-cell approaches in bone marrow of newly diagnosed AML patients. We identify monocytic AML as having a unique microenvironment characterized by IFNγ producing T and NK cells, high IFNγ signaling, and immunosuppressive features. IFNγ signaling score strongly correlates with venetoclax resistance in primary AML patient cells. Additionally, IFNγ treatment of primary AML patient cells increased venetoclax resistance. Lastly, a parsimonious 47-gene IFNγ score demonstrates robust prognostic value. In summary, our findings suggest that inhibiting IFNγ is a potential treatment strategy to overcoming venetoclax resistance and immune evasion in AML patients.


Conflict of interest statement

M.R.G reports research funding from Sanofi, Kite/Gilead, Abbvie and Allogene; consulting for Abbvie, Allogene and Bristol Myers Squibb; honoraria from BMS, Daiichi Sankyo and DAVA Oncology; and stock ownership of KDAc Therapeutics. I.V. received research funding from Avilect Biosciences/Aviceda Therapeutics. H.A.A. reports research funding from Genentech and Enzyme-By-Design, consultancy fees from Molecular Partners, and inkind support from Illumina.

Figures

Fig. 1
Fig. 1. Bulk RNA profiling identifies conserved IFNγ signaling in AML samples.
A Single-sample gene set enrichment analysis of TCGA, MDACC, and BEAT-AML bulk RNA sequencing datasets using pathways curated from Gene Ontology (GO), Hallmark, and Reactome gene set collections of the Molecular Signature Database. B Correlation of blast percentage in the bulk RNA sequencing cohorts and Hallmark IFNγ response pathway. Error band represents 95% confidence interval. T test was used to evaluate the significance of Pearson correlation. C Hallmark IFNγ response score by specific FAB classification in patients with diploid cytogenetics (n = 294; NOS = not otherwise specified; Center line represents the median and lower and upper bounds of box correspond to the first and third quartiles). D Hallmark IFNγ response score by specific cytogenetic groups (n = 378); double deletion indicates patients with both a chromosome 5/5q and 7/7q loss. Center line represents the median and lower and upper bounds of box correspond to the first and third quartiles. Two-sided Wilcoxon test was used to compare inv(16) with t(8;21). E Hallmark IFNγ response score comparing AML samples and healthy CD34+ sorted bone marrow cells. Center line represents the median and lower and upper bounds of box correspond to the first and third quartiles. Two-sided Wilcoxon test was used. F Pie chart showing the percentage of newly diagnosed AML patients with elevated IFNγ level compared to the normal range. G Correlation of IFNγ response pathway with HLA1, HLA2, T-cell exhaustion, T-cell dysfunction, and T-cell senescence scores (see also Supplementary Fig. 1B–F). H Correlation of Hallmark IFNγ response with monocytes as determined through CIBERSORTx immune deconvolution of bulk RNA profiling data. Error band represents 95% confidence interval. T test was used to evaluate the significance of Pearson correlation. Source data are provided as a Source Data file.
Fig. 2
Fig. 2. Single cell RNA profiling of newly diagnosed AML bone marrows.
A OncoPrint of patients included in the single cell RNA (scRNA) profiling. B UMAP projection of 107,067 cells passing quality control (see Supplementary Fig. 2 for QC) and cell cluster identities. C Marker gene expression for key marker genes defining cell cluster identities. D Relative proportions of cells by patients. E Example of concordance between inferCNV results and the karyotype of a patient (PT28A), with a loss of chromosome 7 shown in G-banding karyotype and loss of transcripts corresponding to chromosome 7 in inferCNV map. F Example of concordance between gene expression of monocytic AML-defining markers determined by scRNA profiling and protein expression determined by flow cytometry (CD34 negative, CD33 positive, and CD64 positive) in a representative patient with monocytic AML (PT32A). G Concordance of AML blast count by flow cytometry and scRNA profiling for all patients profiled. T test was used to evaluate the significance of Pearson correlation. Source data are provided as a Source Data file.
Fig. 3
Fig. 3. IFNγ signaling in AML blasts is dependent on phenotypic and cytogenetic groups.
A Radar plot of single cell-level assessment of IFNγ signaling scored, generated with AUCell, comparing T cells and AML cells from patients with diploid non-monocytic, diploid monocytic, del5/5q, del7/7q, and double deletion (both del5/5q and del7/7q) AML. B IFNγ signaling score across specific AML subgroups (n = 56,168 AML cells; Center line represents the median and lower and upper bounds of box correspond to the first and third quartiles). C IFNγ signaling score across AML differentiation hierarchies as described in Zeng et al. 2022. D Interferon regulator factors 8 regulon activity across AML groups determined by SCENIC (n = 5617; Center line represents the median and lower and upper bounds of box correspond to the first and third quartiles). E Regulon activities of 11 core transcriptional regulators reported by Eagle K. et al. visualized by AML groups. F. Heatmap of HLA class 1 and class 2 expression across patient samples. G HLA-E RNA expression in AML subtypes. H Representative histogram of HLA-E expression in AML blast cells as detected by flow cytometry (left) and quantification of mean fluorescent intensity (MFI) of HLA-E expression between diploid non-monocytic (n = 5), del7/7q (n = 4), and diploid monocytic (n = 5) AML patient samples (right; see also Supplementary Fig. 4F). Data are presented as mean values ± SD. Source data are provided as a Source Data file.
Fig. 4
Fig. 4. CD8 T and NK cell IFNγ production in the AML bone marrow shapes a unique immunosuppressive microenvironment.
A Normalized enrichment score of GSEA of IFNγ production pathway for AML, CD4, CD8, and NK cells. B T cell-AML interactions and interaction strength among AML groups predicted by CellChat. C Circos plot of the top predicted non-AML-to-AML ligand-receptor interactions within the diploid monocytic subset among the top 100 ligand-receptor interactions predicted by MultiNicheNet. D Circos plot of the top 50 ligand-receptor interactions within the diploid monocytic subset only. E Dot plot of top 50 ligand-receptor interactions within the diploid monocytic subset only, excluding AML-to-AML interactions. DD double deletion, DM diploid-monocytic, DN diploid-nonmonocytic. F IFNγ levels in culture media were assessed by ELISA after a 72 and 120-h co-culture of CD14+, CD34 + AML blasts, THP1 cells or MOLM13 cells with healthy donor T cells. Control groups included blasts alone, T cells alone, and T cells co-cultured with DynaBeads T cell activator. Co-culture data is from 1 patient with CD14+ blasts, 1 patient with CD34+ blasts, THP1 cells or MOLM13 cells with each condition having 3 replicates. Data are presented as mean values ± SEM. Two-sided t test was used (*p  <  0.01). G Representative multiplex IF panel from 2 patient bone marrow biopsy samples imaged using Lunaphore showing a representative image enriched for CD34+ AML cells, serial section stained with DAPI, CD34, HLA-E, and CD3, H&E, and merged section shown for comparison with scale bar indicating 50 µm. The experiment was repeated 10 times. H Boxplot of distance between CD3 T cells and AML cells by whether AML cells express HLA-E or not. (n = 10; Center line represents the median and lower and upper bounds of box correspond to the first and third quartiles). Two-sided Wilcoxon test was used. Source data are provided as a Source Data file.
Fig. 5
Fig. 5. IFITM3 is prognostic in newly diagnosed AML patients and a potential dependency in AML cells.
A Correlation of IFNγ signaling score with gene expressions in the single cell data. Genes in red have a positive correlation and genes in blue have a negative correlation. B Correlation of IFITM3 expression with IFNγ signaling score at an individual patient level. Error band represents 95% confidence interval. T test was used to evaluate the significance of Pearson correlation. C IFITM3 expression in AML blasts was assessed by flow cytometry after a 24-h stimulation with 10 ng/ml IFNγ. Data represents results from 2 patients’ CD14+ blasts and 2 patients’ CD34+ blasts, with each condition having 3 replicates. The error showed standard error of mean. Two-sided t test was used. D Kaplan-Meier survival curve of the AML patients from TCGA, Beat-AML and MDACC by median IFITM3 expression in the bulk RNA profiling data. E UMAP projection of all patients’ cells scored by IFITM3 expression in cells. F Change in cell line fitness following genetic deletion of IFITM3 in the DepMap CRISPR knockout screen data, showing results in the 26 AML cell lines tested. G Representative multiplex IF panel. Baseline AML sample with CD34 positive blasts show low amounts of IFITM3(Top). Post relapse AML sample with CD34 positive blasts show high amounts of IFITM3 (Bottom). Green is CD34, red is IFITM3, blue is DAPI. Scale bar 50 μm. The experiment was repeated 2 times. H Density plot of IFITM3 fluorescence intensity on AML blasts at diagnosis and post relapse. I Violin plot of fluorescence intensity on AML blasts at diagnosis and post relapse. Post relapse AML sample show significantly higher amounts of IFITM3. Two-sided Wilcoxon test was used. Source data are provided as a Source Data file.
Fig. 6
Fig. 6. IFNγ signaling in AML is associated with venetoclax resistance and parsimonious IFNγ score is associated with worse overall survival.
A Correlation of IFNγ signaling score and venetoclax resistance in BEAT-AML data. Error band represents 95% confidence interval. T test was used to evaluate the significance of Pearson correlation. B Correlation of IFNγ signaling score and venetoclax resistance in Malani et al. data. Error band represents 95% confidence interval. T test was used to evaluate the significance of Pearson correlation. CE Viability assessment of AML blasts after stimulation with 10 ng/ml IFNγ and incubation with venetoclax using the CellTiter-Glo luminescent cell viability assay. Data represents results from 3 AML patients’ blasts, with each condition having 3 replicates, except for (D), which has two replicates. For (C, E), data are presented as mean values ± SEM. Two-sided t test was used. F Kaplan-Meier survival curves of the AML patients from TCGA, Beat-AML, and MDACC by parsimonious IFNγ score in bulk RNA profiling cohort. G Multivariable adjusted Cox regression model for overall survival among the patients in the combined bulk RNA profiling cohort adjusting for parsimonious IFNγ score, age, blast percentage, and cytogenetics. Wald test was used to measure the significance of factors. Source data are provided as a Source Data file.

Similar articles

Cited by

References

    1. Döhner H, Weisdorf DJ, Bloomfield CD. Acute myeloid leukemia. N. Engl. J. Med. 2015;373:1136–1152. doi: 10.1056/NEJMra1406184. - DOI - PubMed
    1. Papaemmanuil E, et al. Genomic classification and prognosis in acute myeloid leukemia. N. Engl. J. Med. 2016;374:2209–2221. doi: 10.1056/NEJMoa1516192. - DOI - PMC - PubMed
    1. Tyner JW, et al. Functional genomic landscape of acute myeloid leukaemia. Nature. 2018;562:526–531. doi: 10.1038/s41586-018-0623-z. - DOI - PMC - PubMed
    1. TCGA. Genomic and epigenomic landscapes of adult de novo acute myeloid leukemia. N. Engl. J. Med.368, 2059-2074 (2013). 10.1056/NEJMoa1301689. - PMC - PubMed
    1. Kantarjian H, et al. Harnessing the benefits of available targeted therapies in acute myeloid leukaemia. Lancet Haematol. 2021;8:e922–e933. doi: 10.1016/S2352-3026(21)00270-2. - DOI - PMC - PubMed

MeSH terms