

Socio-spatial equity analysis of relative wealth index and emergency obstetric care accessibility in urban Nigeria
- PMID: 38418903
- PMCID: PMC10902387
- DOI: 10.1038/s43856-024-00458-2
Socio-spatial equity analysis of relative wealth index and emergency obstetric care accessibility in urban Nigeria
Erratum in
-
Publisher Correction: Socio-spatial equity analysis of relative wealth index and emergency obstetric care accessibility in urban Nigeria.Commun Med (Lond). 2024 May 7;4(1):82. doi: 10.1038/s43856-024-00509-8. Commun Med (Lond). 2024. PMID: 38714882 Free PMC article. No abstract available.
Abstract
Background: Better geographical accessibility to comprehensive emergency obstetric care (CEmOC) facilities can significantly improve pregnancy outcomes. However, with other factors, such as affordability critical for care access, it is important to explore accessibility across groups. We assessed CEmOC geographical accessibility by wealth status in the 15 most-populated Nigerian cities.
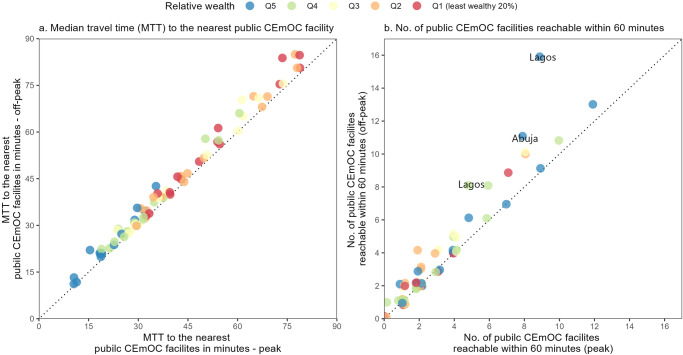
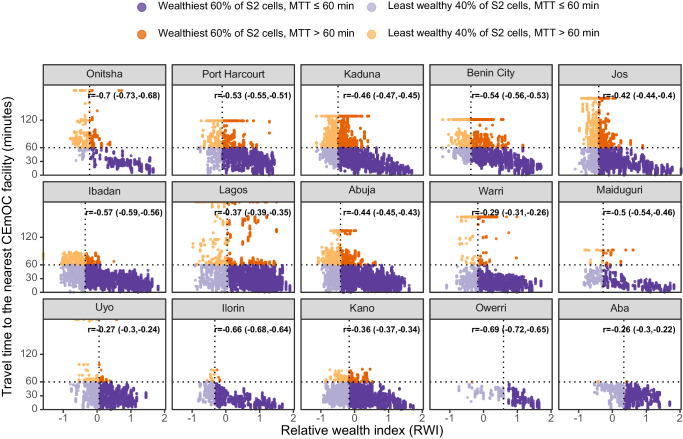
Methods: We mapped city boundaries, verified and geocoded functional CEmOC facilities, and assembled population distribution for women of childbearing age and Meta's Relative Wealth Index (RWI). We used the Google Maps Platform's internal Directions Application Programming Interface to obtain driving times to public and private facilities. City-level median travel time (MTT) and number of CEmOC facilities reachable within 60 min were summarised for peak and non-peak hours per wealth quintile. The correlation between RWI and MTT to the nearest public CEmOC was calculated.
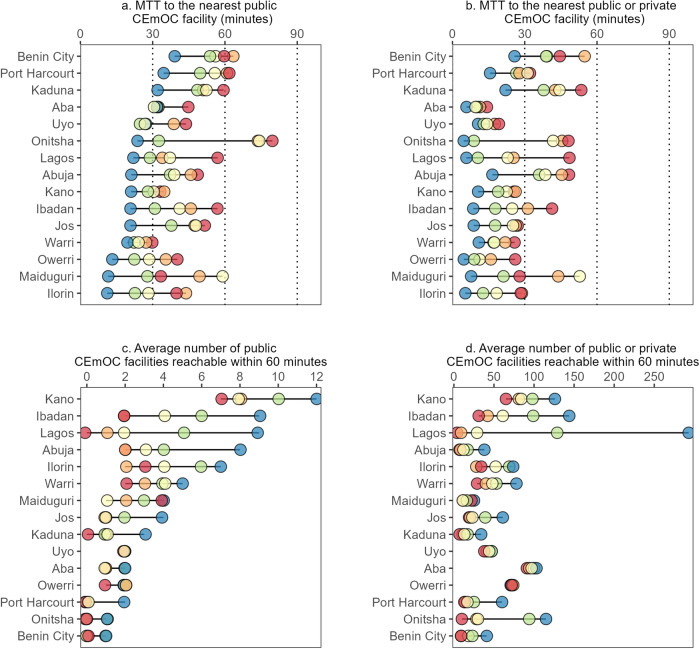
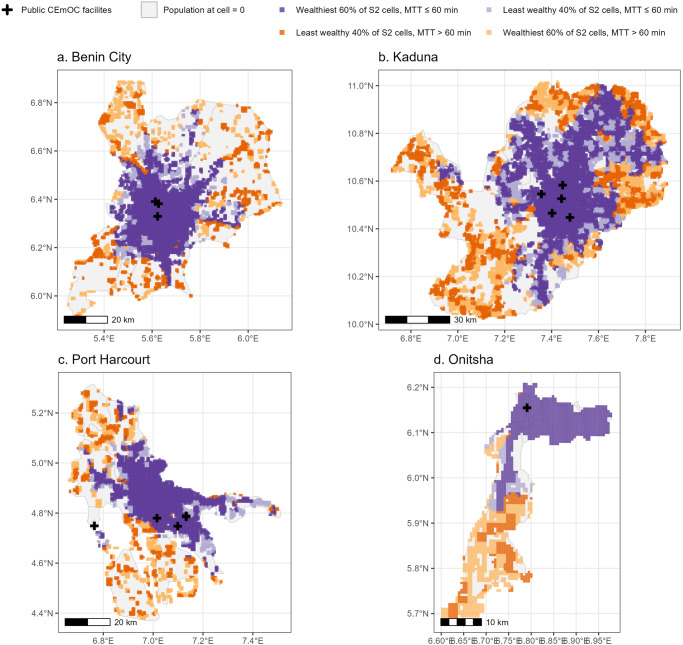
Results: We show that MTT to the nearest public CEmOC facility is lowest in the wealthiest 20% in all cities, with the largest difference in MTT between the wealthiest 20% and least wealthy 20% seen in Onitsha (26 vs 81 min) and the smallest in Warri (20 vs 30 min). Similarly, the average number of public CEmOC facilities reachable within 60 min varies (11 among the wealthiest 20% and six among the least wealthy in Kano). In five cities, zero facilities are reachable under 60 min for the least wealthy 20%. Those who live in the suburbs particularly have poor accessibility to CEmOC facilities.
Conclusions: Our findings show that the least wealthy mostly have poor accessibility to care. Interventions addressing CEmOC geographical accessibility targeting poor people are needed to address inequities in urban settings.
Plain language summary
Access to critical obstetric care can be lifesaving for pregnant women and their offspring. However, socioeconomic factors are known to affect accessibility to health services across different groups. Here, we assessed peak and off-peak travel times to functional health facilities for women from 15 Nigerian cities, using travel time estimates produced by Google Maps and stratified by wealth status. Travel time to the nearest hospital and the number of hospitals reachable within 60 min varied across cities. The wealthiest 20% across all cities had the shortest travel time and vice versa for the least wealthy 20%. Women who live in the suburbs particularly have poor accessibility. Tailored action is needed to improve access for vulnerable populations living in urban settings.
© 2024. The Author(s).
Conflict of interest statement
CS, NS, YS, GP, MK, SV, and TS are employees of Google LLC, which makes the Google Maps Platform. AB-T received grant funding from Google to support this work. PMM is an Editorial Board Member for Communications Medicine and Guest Editor for the Geospatial Analysis for Improved Understanding of Health Inequalities Collection but was not involved in the editorial review or peer review, nor in the decision to publish this article. All other authors declare no competing interests.
Figures
Similar articles
-
Optimising availability and geographical accessibility to emergency obstetric care within a sub-national social health insurance scheme in Nigeria.Front Health Serv. 2024 Oct 16;4:1460580. doi: 10.3389/frhs.2024.1460580. eCollection 2024. Front Health Serv. 2024. PMID: 39478850 Free PMC article.
-
Geographical accessibility to functional emergency obstetric care facilities in urban Nigeria using closer-to-reality travel time estimates: a population-based spatial analysis.Lancet Glob Health. 2024 May;12(5):e848-e858. doi: 10.1016/S2214-109X(24)00045-7. Lancet Glob Health. 2024. PMID: 38614632
-
An assessment of geographical access and factors influencing travel time to emergency obstetric care in the urban state of Lagos, Nigeria.Health Policy Plan. 2021 Oct 12;36(9):1384-1396. doi: 10.1093/heapol/czab099. Health Policy Plan. 2021. PMID: 34424314 Free PMC article.
-
"In cities, it's not far, but it takes long": comparing estimated and replicated travel times to reach life-saving obstetric care in Lagos, Nigeria.BMJ Glob Health. 2021 Jan;6(1):e004318. doi: 10.1136/bmjgh-2020-004318. BMJ Glob Health. 2021. PMID: 33495286 Free PMC article.
-
Measuring geographic access to emergency obstetric care: a comparison of travel time estimates modelled using Google Maps Directions API and AccessMod in three Nigerian conurbations.Geospat Health. 2024 May 27;19(1). doi: 10.4081/gh.2024.1266. Geospat Health. 2024. PMID: 38801322
Cited by
-
Optimising availability and geographical accessibility to emergency obstetric care within a sub-national social health insurance scheme in Nigeria.Front Health Serv. 2024 Oct 16;4:1460580. doi: 10.3389/frhs.2024.1460580. eCollection 2024. Front Health Serv. 2024. PMID: 39478850 Free PMC article.
-
Improving complex health systems and lived environments for maternal and perinatal well-being in urban sub-Saharan Africa: the UrbanBirth Collective.J Glob Health. 2025 Jan 23;15:03009. doi: 10.7189/jogh.15.03009. J Glob Health. 2025. PMID: 39846158 Free PMC article.
References
-
- UNICEF, WHO, World Bank & UNPD. A neglected tragedy: the global burden of stillbirths. (United Nations Children’s Fund, New York, 2020).
-
- Trends in Maternal Mortality 2000 to 2020: Estimates by WHO, UNICEF, UNFPA, World Bank Group and UNDESA/Population Division.(World Health Organization: Geneva, Switzerland, 2023.
Grants and funding
LinkOut - more resources
Full Text Sources
