. 2024 Apr 2;123(7):839-846.
doi: 10.1016/j.bpj.2024.02.022. Epub 2024 Feb 27.

Conserved allosteric perturbation of the GTPase domains by region 1 of Ras hypervariable regions

Affiliations

Conserved allosteric perturbation of the GTPase domains by region 1 of Ras hypervariable regions

Xue Gu et al. Biophys J. .

Abstract

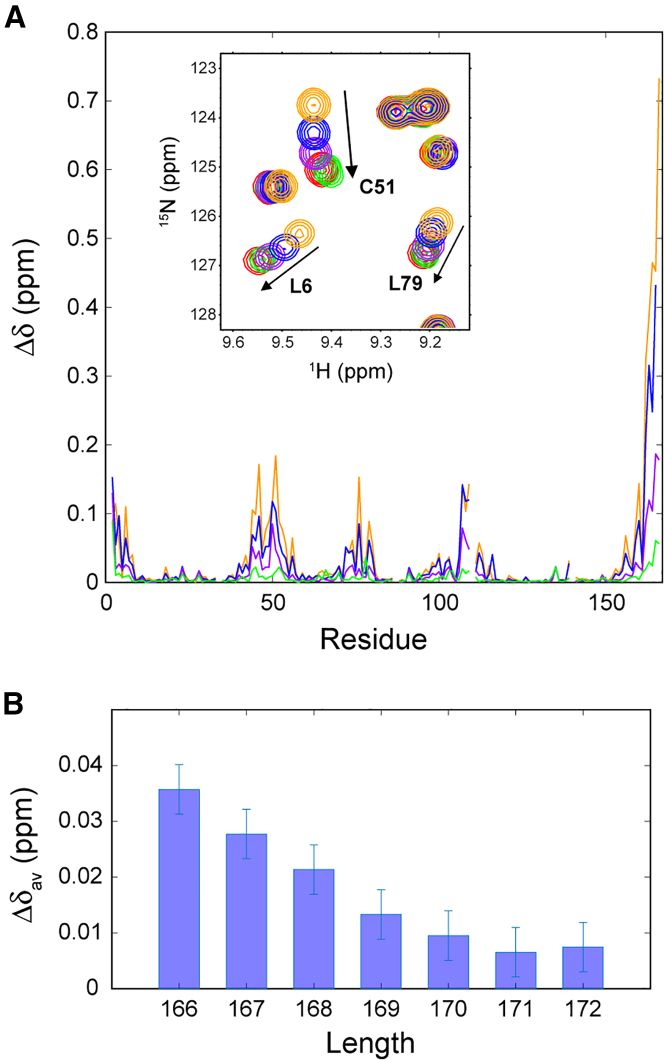
Ras proteins are important intracellular signaling hubs that can interact with numerous downstream effectors and upstream regulators through their GTPase domains (G-domains) anchored to plasma membranes by the C-terminal hypervariable regions (HVRs). The biological functions of Ras were proposed to be regulated at multiple levels including the intramolecular G-domain-HVR interactions, of which the exact mechanism and specificity are still controversial. Here, we demonstrate that the HVRs, instead of having direct contacts, can weakly perturb the G-domains via an allosteric interaction that is restricted to a ∼20 Å range and highly conserved in the tested Ras isoforms (HRas and KRas4B) and nucleotide-bound states. The origin of this allosteric perturbation has been localized to a short segment (residues 167-171) coinciding with region 1 of HVRs, which exhibits moderate to weak α-helical propensities. A charge-reversal mutation (E168K) of KRas4B in region 1, previously described in the Catalog of Somatic Mutations in Cancer database, was found to induce similar chemical shift perturbations as truncation of the HVR does. Further membrane paramagnetic relaxation enhancement (mPRE) data show that this region 1 mutation alters the membrane orientations of KRas4B and moderately increases the relative population of the signaling-compatible state.


Conflict of interest statement

Declaration of interests The authors declare no competing interests.

Figures

Figure 1
Figure 1
Chemical shift perturbations by C-terminal truncations at different residues in the region 1. (A) Chemical shift differences, Δδ=ΔδH2+(0.14ΔδN)2, between HRas1-181·GDP and the C-terminally truncated proteins at 19°C. For clarity, only the data for HRas1-166 (orange), HRas1-167 (blue), HRas1-169 (purple), and HRas1-171 (green) are shown. Inset: a region of the HSQC spectrum of HRas1-181·GDP (red) overlaid with those of the truncated ones that use the same color codes as in the main figure (see Fig. S4 for the comparison of full spectra). (B) The average chemical shift differences (Δδav) over all residues plotted against the lengths of the truncated HRas·GDP. To see this figure in color, go online.
Figure 2
Figure 2
Plot of the residue-specific chemical shift differences (Δδ) between HRas1-166·GDP and HRas1-181·GDP against the Cα-Cα distances (d) between individual residues and H166. Inset: mapping of the residue-specific Δδ onto the structure of HRas1-166·GDP (PDB: 4Q21). The color codes are consistent in the main and inset figures. To see this figure in color, go online.
Figure 3
Figure 3
C-terminal truncation induced chemical shift perturbations in different Ras isoforms and activation states. (A and B) Chemical shift differences between KRas4B1-185 and KRas4B1-166 (blue) or KRas4B1-171 (red) in GDP-bound inactive (A) or native GTP-bound active (B) states, measured at 14.1 T, 22°C. (C) Chemical shift differences between HRas1-181·GTP and HRas1-166·GTP (blue) or HRas1-171·GTP (red), measured at 14.1 T, 15°C. Overlays of the original NMR spectra are shown in the supporting material (Figs. S5–S7). The shaded areas highlight the P-loop and switch I and II regions, which are minimally affected. To see this figure in color, go online.
Figure 4
Figure 4
Perturbations of the conformation and membrane orientation of KRas4B·GDP by point mutations in region 1. (A) Chemical shift changes caused by the E168K (K169N) mutation are colored magenta (blue). Data of the mutated and adjacent residues are not shown. (B and C) The mPRE Γ2 rates of KRas4BC118S/K169N·GDP (blue) and KRas4BC118S/E168K·GDP (magenta) are compared with the previously reported data (15) of KRas4BC118S·GDP (orange). Only the data for the G-domain (residues 1–166) are shown. The Γ2 rates of KRas4BC118S/K169N (B) and KRas4BC118S/E168K (C) were scaled by single multiplicative factors so that their average values best match that of KRas4BC118S. To see this figure in color, go online.
Figure 5
Figure 5
The mPRE-derived KRas4BC118S/E168K orientations on the nanodiscs. (A) Comparison of the experimental Γ2 rates (magenta dots) with those back-calculated from a KRas4BC118S/E168K ensemble comprising 128 orientations (green). (B) Polar plot of the Euler angles (β, γ) for individual KRas4BC118S/E168K orientations (magenta dots) in the ensemble compared with those of KRas4BC118S (black dots) reported previously (15). Individual orientational clusters (OCs) are indicated by dashed ovals. (C–E) Illustration of the G-domain (pink ribbon) in representative orientations of OC2a (C), OC2 (D), and OC2b (E), complexed with the Ras-binding domain of RalGDS (light blue ribbon) according to the previously solved cocrystal structure (51). The membrane surfaces are indicated by gray semitransparent planes. To see this figure in color, go online.

References

    1. Goodsell D.S. The Molecular Perspective: The ras Oncogene. Oncol. 1999;4:263–264. - PubMed
    1. Wilson C.Y., Tolias P. Recent advances in cancer drug discovery targeting RAS. Drug Discov. Today. 2016;21:1915–1919. - PubMed
    1. Barbacid M. ras GENES. Annu. Rev. Biochem. 1987;56:779–827. - PubMed
    1. Castellano E., Santos E. Functional specificity of Ras isoforms: So similar but so different. Genes Cancer. 2011;2:216–231. - PMC - PubMed
    1. Santra T., Herrero A., et al. Kolch W. An Integrated Global Analysis of Compartmentalized HRAS Signaling. Cell Rep. 2019;26:3100–3115.e7. - PubMed

Publication types

MeSH terms

LinkOut - more resources