

Nucleosome spacing controls chromatin spatial structure and accessibility
- PMID: 38419332
- PMCID: PMC10995425
- DOI: 10.1016/j.bpj.2024.02.024
Nucleosome spacing controls chromatin spatial structure and accessibility
Abstract
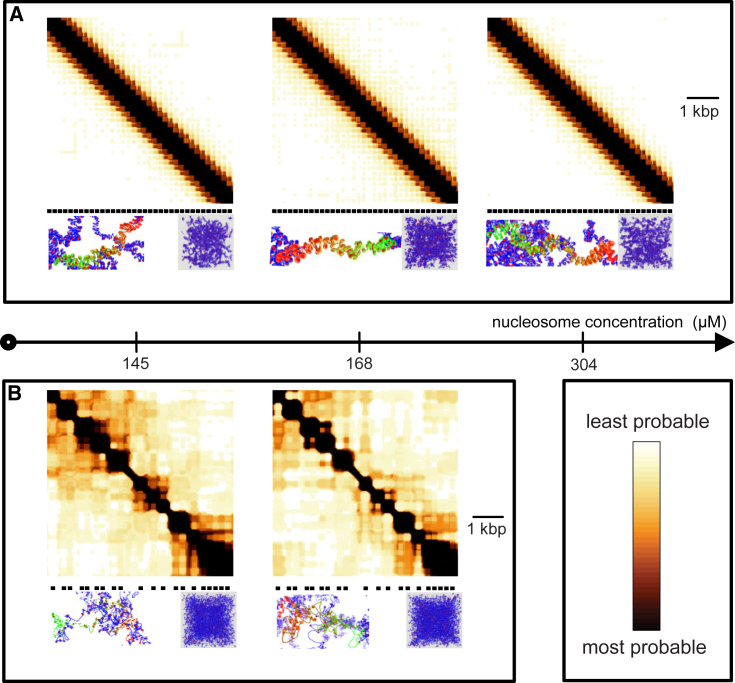
Recent research highlights the significance of the three-dimensional structure of chromatin in regulating various cellular processes, particularly transcription. This is achieved through dynamic chromatin structures that facilitate long-range contacts and control spatial accessibility. Chromatin consists of DNA and a variety of proteins, of which histones play an essential structural role by forming nucleosomes. Extensive experimental and theoretical research in recent decades has yielded conflicting results about key factors that regulate the spatial structure of chromatin, which remains enigmatic. By using a computer model that allows us to simulate chromatin volumes containing physiological nucleosome concentrations, we investigated whether nucleosome spacing or nucleosome density is fundamental for three-dimensional chromatin accessibility. Unexpectedly, the regularity of the nucleosome spacing is crucial for determining the accessibility of the chromatin network to diffusive processes, whereas variation in nucleosome concentrations has only minor effects. Using only the basic physical properties of DNA and nucleosomes was sufficient to generate chromatin structures consistent with published electron microscopy data. Contrary to other work, we found that nucleosome density did not substantially alter the properties of chromatin fibers or contact probabilities of genomic loci. No breakup of fiber-like structures was observed at high molar density. These findings challenge previous assumptions and highlight the importance of nucleosome spacing as a key driver of chromatin organization. These results identified changes in nucleosome spacing as a tentative mechanism for altering the spatial chromatin structure and thus genomic functions.
Copyright © 2024 Biophysical Society. Published by Elsevier Inc. All rights reserved.
Conflict of interest statement
Declaration of interests The authors declare no competing interests.
Figures
Similar articles
-
Changing chromatin fiber conformation by nucleosome repositioning.Biophys J. 2014 Nov 4;107(9):2141-50. doi: 10.1016/j.bpj.2014.09.026. Biophys J. 2014. PMID: 25418099 Free PMC article.
-
Dynamics of nucleosomes and chromatin fibers revealed by single-molecule measurements.BMB Rep. 2025 Jan;58(1):24-32. doi: 10.5483/BMBRep.2024-0191. BMB Rep. 2025. PMID: 39757199 Free PMC article. Review.
-
Nucleosome positioning and composition modulate in silico chromatin flexibility.J Phys Condens Matter. 2015 Feb 18;27(6):064112. doi: 10.1088/0953-8984/27/6/064112. Epub 2015 Jan 7. J Phys Condens Matter. 2015. PMID: 25564155 Free PMC article.
-
Nucleosome distribution and linker DNA: connecting nuclear function to dynamic chromatin structure.Biochem Cell Biol. 2011 Feb;89(1):24-34. doi: 10.1139/O10-139. Biochem Cell Biol. 2011. PMID: 21326360 Free PMC article. Review.
-
Differential nucleosome spacing in neurons and glia.Neurosci Lett. 2020 Jan 1;714:134559. doi: 10.1016/j.neulet.2019.134559. Epub 2019 Oct 19. Neurosci Lett. 2020. PMID: 31639421 Free PMC article.
Cited by
-
The impact of charge regulation and ionic intranuclear environment on the nucleosome core particle.J Chem Phys. 2024 Dec 21;161(23):235101. doi: 10.1063/5.0241529. J Chem Phys. 2024. PMID: 39704570
-
The Impact of Charge Regulation and Ionic Intranuclear Environment on the Nucleosome Core Particle.bioRxiv [Preprint]. 2024 Nov 12:2024.11.11.623012. doi: 10.1101/2024.11.11.623012. bioRxiv. 2024. Update in: J Chem Phys. 2024 Dec 21;161(23):235101. doi: 10.1063/5.0241529. PMID: 39605663 Free PMC article. Updated. Preprint.
-
Nuclear Structure, Size Regulation, and Role in Cell Migration.Cells. 2024 Dec 23;13(24):2130. doi: 10.3390/cells13242130. Cells. 2024. PMID: 39768219 Free PMC article. Review.
References
-
- Luger K., Mäder A.W., et al. Richmond T.J. Crystal structure of the nucleosome core particle at 2.8 A resolution. Nature. 1997;389:251–260. - PubMed
-
- Scheffer M.P., Eltsov M., et al. Frangakis A.S. Nucleosomes stacked with aligned dyad axes are found in native compact chromatin in vitro. J. Struct. Biol. 2012;178:207–214. - PubMed
-
- Tremethick D.J. Higher-Order Structures of Chromatin: The Elusive 30 nm Fiber. Cell. 2007;128:651–654. - PubMed
Publication types
MeSH terms
Substances
LinkOut - more resources
Full Text Sources
