. 2024 Jun;36(26):e2313226.
doi: 10.1002/adma.202313226. Epub 2024 Mar 15.

Antigen Presenting Cell Mimetic Lipid Nanoparticles for Rapid mRNA CAR T Cell Cancer Immunotherapy

Affiliations

Antigen Presenting Cell Mimetic Lipid Nanoparticles for Rapid mRNA CAR T Cell Cancer Immunotherapy

Ann E Metzloff et al. Adv Mater. 2024 Jun.

Abstract

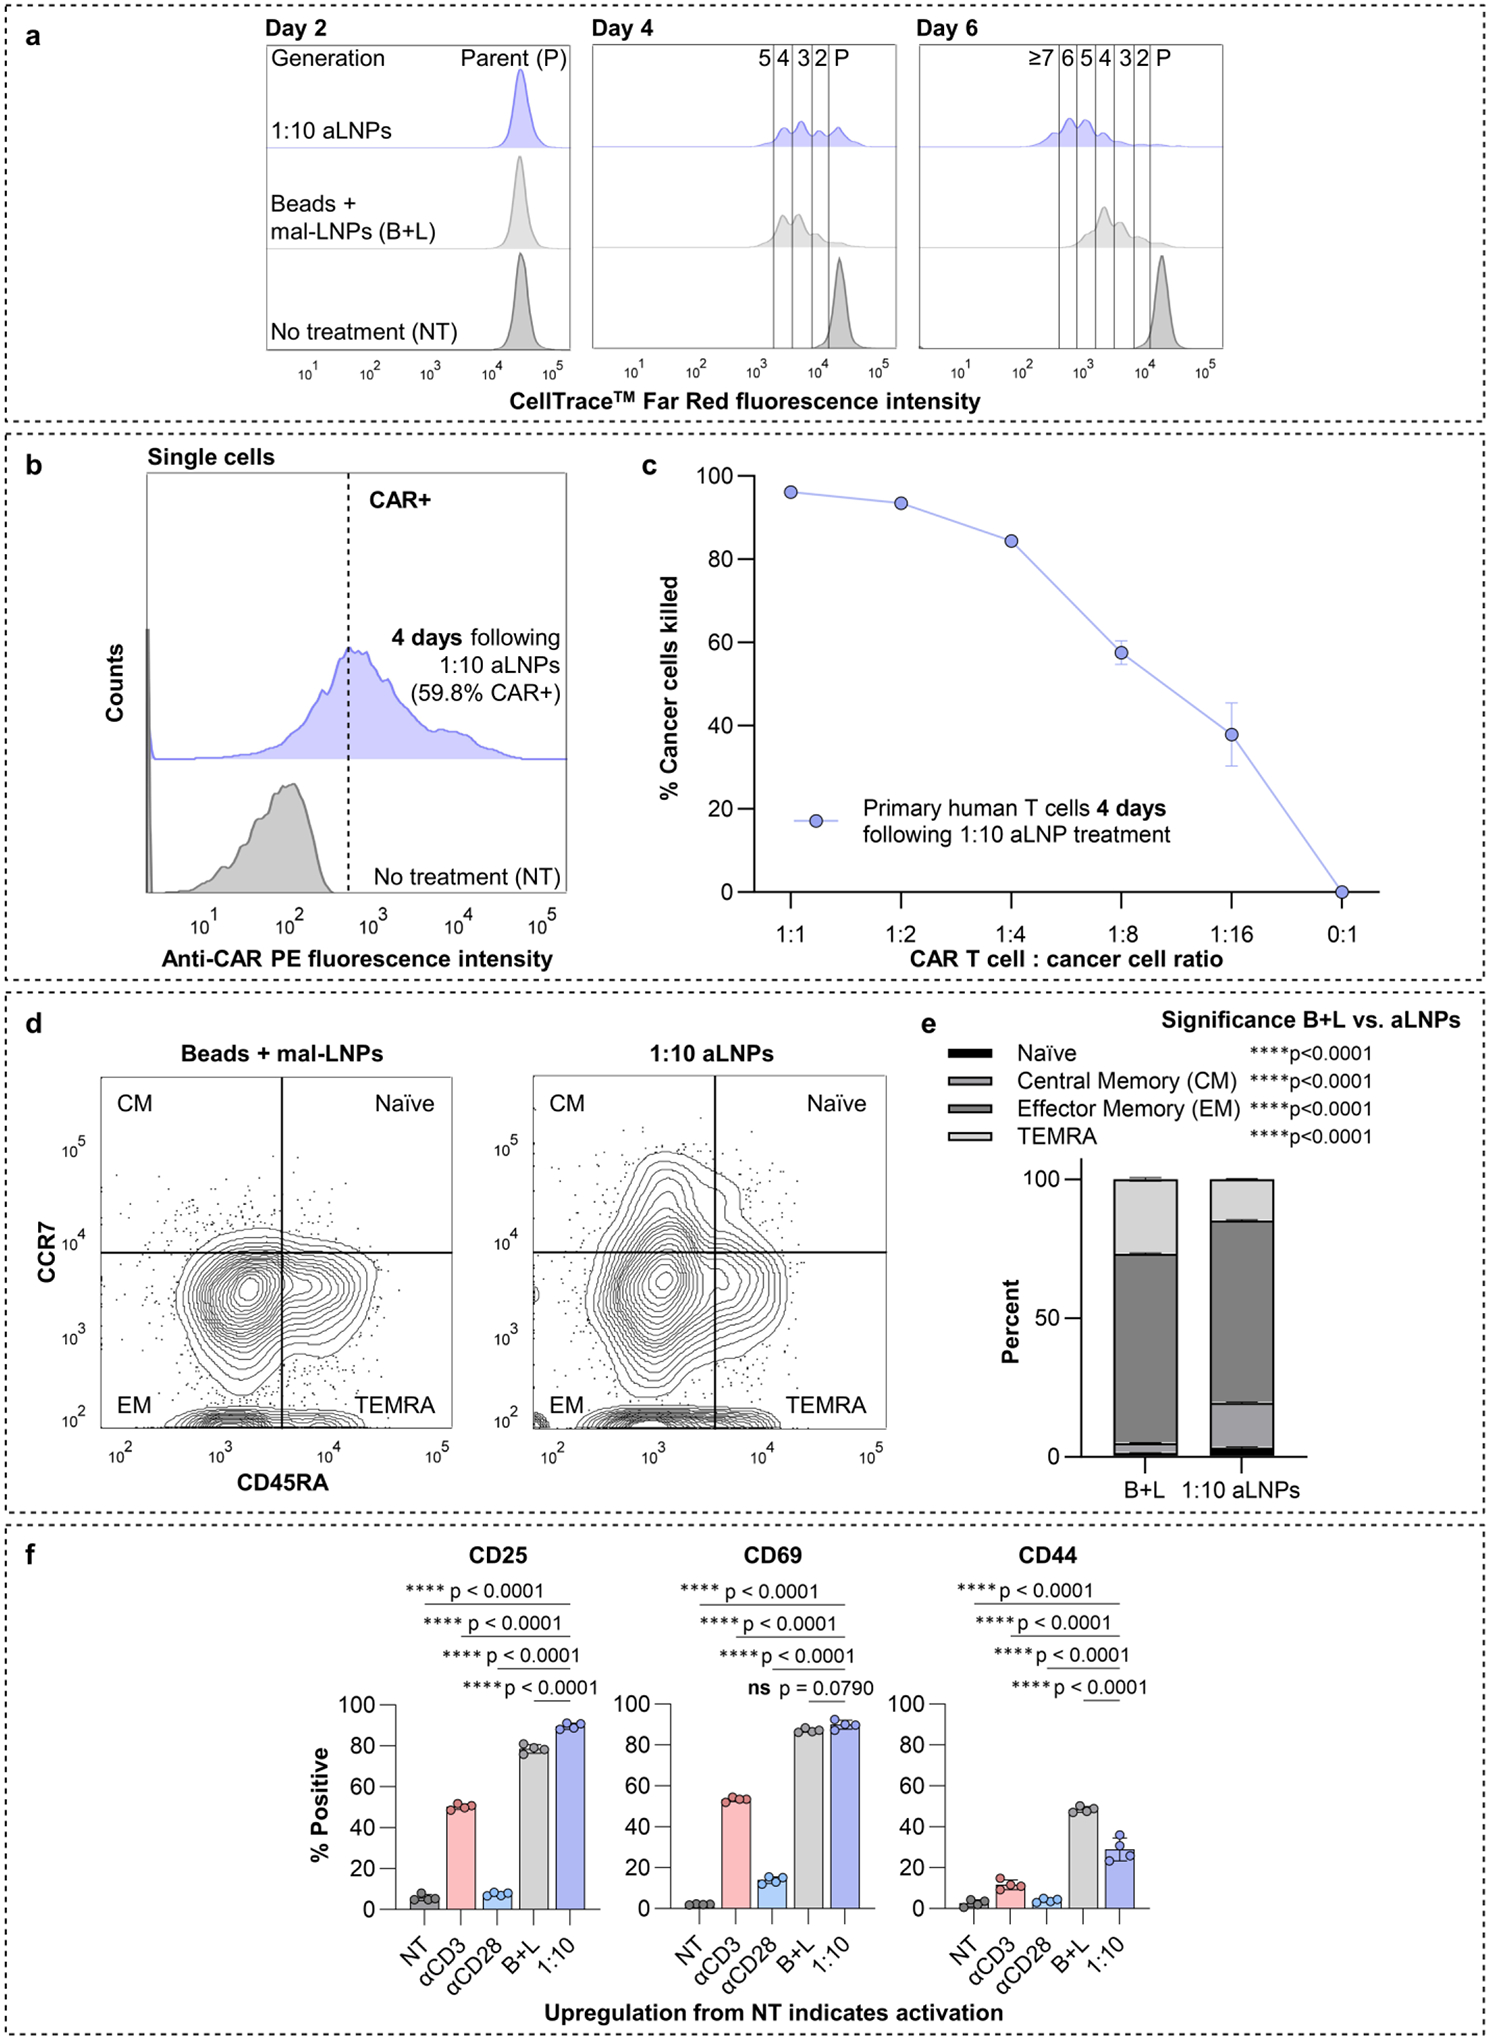
Chimeric antigen receptor (CAR) T cell therapy has achieved remarkable clinical success in the treatment of hematological malignancies. However, producing these bespoke cancer-killing cells is a complicated ex vivo process involving leukapheresis, artificial T cell activation, and CAR construct introduction. The activation step requires the engagement of CD3/TCR and CD28 and is vital for T cell transfection and differentiation. Though antigen-presenting cells (APCs) facilitate activation in vivo, ex vivo activation relies on antibodies against CD3 and CD28 conjugated to magnetic beads. While effective, this artificial activation adds to the complexity of CAR T cell production as the beads must be removed prior to clinical implementation. To overcome this challenge, this work develops activating lipid nanoparticles (aLNPs) that mimic APCs to combine the activation of magnetic beads and the transfection capabilities of LNPs. It is shown that aLNPs enable one-step activation and transfection of primary human T cells with the resulting mRNA CAR T cells reducing tumor burden in a murine xenograft model, validating aLNPs as a promising platform for the rapid production of mRNA CAR T cells.

Keywords: CAR T cells; biomimicry; cancer immunotherapy; lipid nanoparticles; mRNA.


Conflict of interest statement

Conflicts of Interest

A.E.M., M.M.B., and M.J.M. are inventors on a patent filed by the Trustees of the University of Pennsylvania (US Provisional Patent Application No. 63/378,819, filed October 7, 2022; PCT International Patent Application No. PCT/US23/76231, filed October 6, 2023) describing the CD3/CD28 antibody fragment conjugated lipid nanoparticle technology described in this work. N.C.S. holds equity in Tmunity Therapeutics and is an advisor to Tome Biosciences. All other authors declare they have no competing interests.

Figures

Figure 1 |
Figure 1 |. Antigen presenting cell mimetic activating LNPs (aLNPs) rapidly activate primary human T cells and transfect them with CAR mRNA in a single step.
a In the body, T cells are activated when they engage with antigen presenting cells (APCs). For complete activation, APCs must provide T cells with a primary and a costimulatory signal. The primary signal occurs when APC peptide-MHC interacts with T cell CD3/TCR. The costimulatory signal occurs when APC CD80/CD86 interacts with T cell CD28. Once activated, the T cell can carry out its effector function in the body. b (Top) To engineer chimeric antigen receptor (CAR) T cells outside of the body with lipid nanoparticles (LNPs), T cells must first be activated. Antibodies against CD3 and CD28, often conjugated to magnetic beads, are used to mimic APC activation before dosing the T cells with mRNA LNPs. (Bottom) We have developed activating LNPs (aLNPs) by conjugating CD3 and CD28 antibody fragments to the surface of our LNPs. aLNPs combine the activating properties of the beads and the mRNA-delivering capabilities of traditional LNPs, enabling activation of and CAR mRNA delivery to T cells in a single, rapid step. a and b were created with BioRender.com.
Figure 2 |
Figure 2 |. Formulation and characterization of activating LNPs (aLNPs).
a Molar composition of maleimide-LNPs (mal-LNPs). PEG, polyethylene glycol. DOPE, dioleoylphosphatidylethanolamine. C14–4, an ionizable lipid. b SN2 synthesis of the ionizable lipid C14–4 from 1,2-epoxytetradecane (top left) and a polyamine core (bottom left). c The formulation of maleimide-LNPs (mal-LNPs) by microfluidic mixing, the cleavage and reduction of antibody fragments, and the conjugation of antibody fragments onto the mal-LNP surface to generate aLNPs. d Left, the hydrodynamic diameter (intensity weighted Z-average) distributions of mal-LNPs and 1:1 anti-CD3:anti-CD28 aLNPs. Right, Z-average and PDI measurements, collected in triplicate. Reported values are average Z-average ± the calculated standard deviation (calculated standard deviation = √(average PDI × average Z-average2)) and average PDI ± the standard deviation of the three PDI measurements. c was created with BioRender.com.
Figure 3 |
Figure 3 |. aLNPs efficiently transfect primary human T cells with luciferase mRNA in the absence of activating beads.
Luminescence in primary human T cells dosed with one of five mRNA lipid nanoparticles (LNPs) and exposed to one of three treatment conditions. Each bar represents the mean data collected for three different donors that are normalized to untreated cells within each donor. On every bar, the mean normalized luminescence for each donor is plotted as a shape (circle, triangle, or rhombus) to highlight donor-to-donor variability. Differences in LNP means within each treatment were assessed with a two-way repeated measures ANOVA with post hoc t tests using Tukey’s correction for multiple comparisons. Only results of comparisons to aLNPs are shown. n=3 donors, with n=3 replicates per donor. Data are presented as mean ± SD. *p≤0.05, ns = not significant. Created with BioRender.com.
Figure 4 |
Figure 4 |. The ratio of CD3 to CD28 antibody fragments on the aLNP surface influences the number and mean fluorescence intensity (MFI) of CAR transfected cells, which effectively kill leukemia cells ex vivo.
a Representative flow cytometry histograms obtained from primary human T cells treated with CD19-directed CAR mRNA aLNPs containing varying ratios of CD3:CD28 antibody fragments on their surfaces. CAR+ cells are defined as those to the right of the dashed line. b (Top) Schematic depicting the various aLNP treatments. (Bottom left) Percentage of single cells that are CAR+ after each aLNP treatment, from the same experiment as the representative histograms. (Bottom right) MFI of single cells after each aLNP treatment, from the same experiment as the representative histograms. n=1 donor, with n=2 replicates. For each bar graph, differences between group means were assessed by an ordinary one-way ANOVA with post hoc t tests using Tukey’s correction for multiple comparisons. Only comparisons to 1:1 aLNPs are shown. c Co-culture assay plating set up. d In vitro transcribed CD19-targeted CAR mRNA. e Percentage of Nalm6 cancer cells killed when cultured with CAR T cells generated with aLNPs containing 50:1, 10:1, 1:1, 1:10, and 1:50 ratios of CD3:CD28 antibody fragments on their surfaces. n=1 donor, with n=3 replicates per donor, from the same experiment as a and b. Differences in treatment means within each CAR T cell:cancer cell ratio were assessed by a two-way ANOVA with post hoc t tests using Tukey’s correction for multiple comparisons. Only significant comparisons to 1:1 aLNPs are shown. f Percentage of Nalm6 cancer cells killed when cultured with CAR T cells generated with beads + mal-LNPs or 1:10 aLNPs. n=3 donors, with n=3 replicates per donor. Assay results for a single donor are shown, with results for additional donors included in Figure S6. Differences in treatment means within each CAR T cell:cancer cell ratio were assessed by a two-way ANOVA with post hoc t tests using Šídák’s correction for multiple comparisons. Not shown = not significant. For a, b, e, f, data are presented as mean ± SD. *p≤0.05, **p≤0.01, ***p≤0.001, ****p≤0.0001. b, c, d were created with BioRender.com.
Figure 5 |
Figure 5 |. Anti-CD19 CAR T cells generated with aLNPs readily proliferate, maintain cytotoxicity following expansion, and have an activated phenotype.
a Flow cytometry histograms of primary human T cells stained with CellTrace Far Red at 2, 4, and 6 days post treatment with beads + mal-LNPs (B+L) or 1:10 aLNPs (1:10). Each proliferative generation appears as a distinct leftward-shifted peak in the flow cytometry histogram. n=1 donor, with n=2 replicates. b Representative flow cytometry histograms obtained from primary human T cells 4 days after the cells received no treatment (NT) or 1:10 aLNPs. CAR+ cells are defined as those to the right of the dashed line. c Percentage of Nalm6 cancer cells killed after 48 hours when cultured with the 4-day-post-aLNP CAR T cells shown in b. n=1 donor, with n=3 replicates per donor. d Representative flow cytometry plots showing CCR7 vs. CD45RA expression for primary human T cells 3 days following treatment with beads + mal-LNPs (B+L) or 1:10 aLNPs. n=1 donor, with n=3 replicates per donor. e Quantification of Naïve, central memory (CM), effector memory (EM), and TEMRA population sizes for the cells treated in d. Differences in population sizes between B+L and 1:10 aLNPs were assessed by a two-way ANOVA with post hoc t tests using Šídák’s correction for multiple comparisons. f Percentages of primary human T cells expressing CD25, CD69, and CD44, as assessed via flow cytometry, 24 hours after receiving no treatment (NT), LNPs with only CD3 antibody fragments on their surface (αCD3), LNPs with only CD28 antibody fragments on their surface (αCD28), beads + mal-LNPs (B+L), or 1:10 aLNPs (1:10). n=1 donor, with n=4 replicates. For each graph, differences between all group means were assessed by an ordinary one-way ANOVA with post hoc t tests using Tukey’s correction for multiple comparisons. Only results of comparisons to 1:10 aLNPs are shown. For b, c, e, f data are presented as mean ± SD. *p≤0.05, **p≤0.01, ***p≤0.001, ****p≤0.0001, ns = not significant.
Figure 6 |
Figure 6 |. Adoptive transfer of anti-CD19 CAR T cells generated with aLNPs reduces tumor burden in a xenograft mouse model of leukemia.
a Schedule used to establish a low-leukemic burden in NSG mice followed by repeated treatments with CAR T cells generated with 1:10 aLNPs. b Time-course IVIS images of Nalm6 (luciferase-expressing human leukemia) tumor-bearing NSG mice treated with three injections of PBS, untransfected T cells, or 1:10 aLNP generated CAR T cells. c Time-course of quantification of average total flux per mouse for the images shown in panel b. Data are presented as mean ± SD. Differences between all treatment means within each day were assessed by a two-way repeated measures ANOVA with post hoc t tests using Tukey’s correction for multiple comparisons. Only comparisons for Day 14 (the final imaging timepoint) are shown. *p≤0.05, ns = not significant. d Kaplan-Meier survival curves of the mice following treatment. Differences between survival profiles were assessed using pairwise Log-rank tests with Bonferroni corrections for multiple comparisons. To determine significance, the p values shown (all one-tail) were compared to the Bonferroni-corrected α value of 0.0167. * indicates significance, ns = not significant. b, c, d represent data from a single experiment, for which n=5 mice/group. e Time-course IVIS images of Nalm6 tumor-bearing NSG mice treated with three injections of 1:10 aLNP generated CAR T cells or PBS, compared to mice treated with a single injection of lentiviral CAR T cells on Day 0 (D0). f Time-course of quantification of average total flux per mouse for the images shown in panel e. Data are presented as mean ± SD. Differences between all treatment means within each day were assessed by a two-way repeated measures ANOVA with post hoc t tests using Tukey’s correction for multiple comparisons. Only comparisons for Day 17 (the last day all mice were alive) are shown. *p≤0.05, ns = not significant. g Kaplan-Meier survival curves of the mice following treatment. Differences between survival profiles were assessed using pairwise Log-rank tests with Bonferroni corrections for multiple comparisons. To determine significance, the p values shown (one-tail for PBS vs. aLNP and PBS vs. Lentiviral; two-tail for aLNP vs. Lentiviral) were compared to the Bonferroni-corrected α value of 0.0167. * indicates significance, ns = not significant. e, f, g represent data from a single experiment, for which n=3 mice/group. a was created with BioRender.com.

References

    1. FDA Approval Brings First Gene Therapy to the United States, FDA, 2020.
    1. FDA Approves CAR-T Cell Therapy to Treat Adults with Certain Types of Large B-Cell Lymphoma, FDA, 2020.
    1. FDA Approves First Cell-Based Gene Therapy For Adult Patients with Relapsed or Refractory MCL, FDA, 2020.
    1. FDA D.I.S.C.O. Burst Edition: FDA Approval of Breyanzi (Lisocabtagene Maraleucel) for Second-Line Treatment of Large B-Cell Lymphoma, FDA, 2022.
    1. FDA D.I.S.C.O. Burst Edition: FDA Approval of ABECMA (Idecabtagene Vicleucel) the First FDA Approved Cell-Based Gene Therapy for the Treatment of Adult Patients with Relapsed or Refractory Multiple Myeloma, FDA, 2021.

LinkOut - more resources