. 2024 Apr;239(4):e31204.
doi: 10.1002/jcp.31204. Epub 2024 Feb 28.

ATF4-dependent increase in mitochondrial-endoplasmic reticulum tethering following OPA1 deletion in skeletal muscle

Affiliations

ATF4-dependent increase in mitochondrial-endoplasmic reticulum tethering following OPA1 deletion in skeletal muscle

Antentor Hinton Jr et al. J Cell Physiol. 2024 Apr.

Abstract

Mitochondria and endoplasmic reticulum (ER) contact sites (MERCs) are protein- and lipid-enriched hubs that mediate interorganellar communication by contributing to the dynamic transfer of Ca2+, lipid, and other metabolites between these organelles. Defective MERCs are associated with cellular oxidative stress, neurodegenerative disease, and cardiac and skeletal muscle pathology via mechanisms that are poorly understood. We previously demonstrated that skeletal muscle-specific knockdown (KD) of the mitochondrial fusion mediator optic atrophy 1 (OPA1) induced ER stress and correlated with an induction of Mitofusin-2, a known MERC protein. In the present study, we tested the hypothesis that Opa1 downregulation in skeletal muscle cells alters MERC formation by evaluating multiple myocyte systems, including from mice and Drosophila, and in primary myotubes. Our results revealed that OPA1 deficiency induced tighter and more frequent MERCs in concert with a greater abundance of MERC proteins involved in calcium exchange. Additionally, loss of OPA1 increased the expression of activating transcription factor 4 (ATF4), an integrated stress response (ISR) pathway effector. Reducing Atf4 expression prevented the OPA1-loss-induced tightening of MERC structures. OPA1 reduction was associated with decreased mitochondrial and sarcoplasmic reticulum, a specialized form of ER, calcium, which was reversed following ATF4 repression. These data suggest that mitochondrial stress, induced by OPA1 deficiency, regulates skeletal muscle MERC formation in an ATF4-dependent manner.

Keywords: activating transcription factor 4; endoplasmic reticulum; integrated stress response; interorganelle communication; mitochondria.


Figures

Figure 1.
Figure 1.
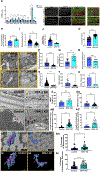
Opa1-Like knockdown (KD) in skeletal muscle alters mitochondrial morphology and mitochondrial-ER contact sites in Drosophila. (A) mRNA expression levels of genes encoding mitochondria–endoplasmic reticulum (ER) contact (MERC) proteins, IP3R3, GRP75 and VDAC and ER stress induced proteins in Opa1-like KD compared with WT (Control) IFMs. (B-G) Adult myofibrils were stained with Phalloidin-FITC (F-actin) and mito-GFP (mitochondria). IFMs from WT flies revealed mitochondria with tubular morphology, whereas the Opa1-like KD flies showed clusters of spherical mitochondria. (H) Mitochondria number (per three sarcomeres) in Opa1-like KD (n = 34) and WT (n = 32) IFMs. (I) Quantification of mitochondrial area. (J) Mitochondrial aspect ratio (major axis/minor axis) in Opa1-like KD (n = 141) and WT (n = 105) IFMs. (K-N) Transmission electron microscopy (TEM) images showing cristae and mitochondrial morphology in WT and Opa1-like KD IFMs (n = 20). (O) Circularity index in Opa1-like KD IFMs relative to WT IFMs. (P). Quantification of mitochondrial area in Opa1-like KD and WT. (Q) Mitochondria number in Opa1-like KD and WT. (R) Cristae quality and abundance was assessed using the cristae score, on a scale from 0 (no sharply defined cristae) to 4 (many regular cristae). The average cristae score was significantly lower in Opa1-like KD than in WT. (S) Quantification of cristae area in Opa1-like KD and WT. (T) Cristae number in Opa1-like KO and WT. (U) Cristae volume in Opa1-like KD and WT. (V-Y) TEM images displaying MERCS in WT and Opa1-like KD IFMs (n = 20). (Z) Quantification of MERC lengths between Opa1-like KD and WT IFMs. (AA) Quantification of MERC distance in Opa1-like KD and WT IFMs. (AB) Percentage of mitochondrial surface area in direct contact with the ER in Opa1-like KD and WT IFMs. (AC) Percentage of ER surface area in direct contact with mitochondria in Opa1-like KD and WT IFMs. (AD-AG) The 3D distribution of single continuous and stationary mitochondria (purple, purple arrows) and ER (blue, blue arrows), reconstructed from serial block face-scanning electron microscopy (SBF-SEM) image stacks of Drosophila indirect flight muscle (IFM) fibers. (AH, AI) Percentage of ER surface area in contact with mitochondria (AH) and percentage mitochondrial surface area in direct contact with ER (AI) in Opa1-like KD compared with wild-type (WT) Drosophila skeletal muscle (SV1 [WT] SV2-3 [Opa1-like KD]). SBF-SEM reconstructions from 7 to 23 fully constructed mitochondria, ER, or MERCs. Significance was determined by two-tailed Student’s t-test. * P<0.05, ** P<0.01, *** P<0.001, **** P < 0.0001.
Figure 2.
Figure 2.
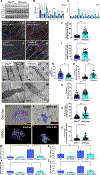
OPA1 deficiency promotes mitochondria–endoplasmic reticulum (ER) contact (MERC) tethering in murine gastrocnemius skeletal muscle. (A) Representative immunoblots showing MERC protein levels (normalized to GAPDH) in 40-week-old WT or OPA1 smKO muscle (n = 6). (B) Densitometric quantification showing a significant increase in protein levels of BIP, GRP-75, MFN-2, and MFN-1 in OPA1 smKO compared with WT mice. (C) Quantification of mRNA expression of OPA1, ER stress genes ATF4, BIP, CHOP, and ATF6, MERC-tethering gene MFN-2, and calcium-related MERC genes IP3R3, Grp75, and VDAC3 in 40-week-old OPA1 smKO compared with WT mice (n = 5). Data are expressed as fold changes vs. WT mice. (D-I). In situ proximal ligation assay (PLA) visualization of MFN1–MNF2 (D-E, red punctae) and IP3R3–VDAC interactions (G-H, red punctae) from 40-week-old WT and Opa1 smKO mice. Quantification demonstrating (F) increased MFN1–MFN2 and (I) IP3R3–VDAC interactions in Opa1 smKO mice compared with WT (n = 3). (J-M). Transmission electron microscopy (TEM) images showing MERCs in 20-week-old wild-type (WT) and Opa1 skeletal muscle specific knockout (Opa1 smKO) mice (n = 3). (N). MERC distance in Opa1 smkO and WT controls. (O, P). Percentage coverage of (O) mitochondrial surface area and (P) ER surface area in Opa1 smKO relative to WT. (Q-T) The 3D distribution of single continuous and stationary mitochondria (purple, purple arrows) and ER (blue, blue arrows), reconstructed from serial block face-scanning electron microscopy (SBF-SEM) image stacks of Opa1 skeletal muscle specific knockout (Opa1 smKO) mouse muscle. (U, V). Percentage of ER surface area in contact with mitochondria (U) and the percentage of mitochondria surface area in direct contact with ER (V) in OPA1 KO compared with WT skeletal muscle. (W–Z). mRNA levels in 12-week-old OPA1 smKO and WT mice 4 weeks after TUDCA treatment (n = 3). IP3R3, (W) ATF4, (X) GRP75 (Y), and VDAC3 (Z) gene expression were significantly reduced in OPA1-smKO mice treated with TUDCA compared to those without TUDCA. Data are presented as fold changes vs. WT mice. SBF-SEM reconstructions from 7 to 23 fully constructed mitochondria, ER, or MERCs. Data are presented as the mean ± SEM. Significance was determined by Student’s t-test. *P < 0.05, **P < 0.01, ***P < 0.001, **** P < 0.0001.
Figure 3.
Figure 3.
ATF4 regulates mitochondria–endoplasmic reticulum (ER) contact (MERC) formation in Opa1-deficient muscle. (a) Representative immunoblot assessing ATF4, IP3R3, and VDAC levels from control (with no genetic modifications) or Ad-Atf4 overexpression (OE) mouse skeletal muscle myotubes (n = 6) (b-d). Densitometric quantification demonstrating an increase in (b) ATF4, (c) IP3R3, and (d) VDAC protein levels in Atf4 OE compared with control myotubes. (e-j) Transmission electron microscopy panel comparing MERCs area in control, Opa1 KO, Atf4 KO, Atf4 OE, double Opa1/Atf4 KO (DKO), and Opa1 KO/Atf4 OE myotubes. Representative mitochondria are identified with purple arrows. (k) Mitochondrial area in Opa1 KO, Atf4 KO, Atf4 OE, DKO, and Opa1 KO/Atf4 OE relative to control myotubes. (l) MERC distance in Opa1 KO, Atf4 KO, Atf4 OE, DKO, and Opa1 KO/Atf4 OE relative to control myotubes. (m-r). Individual electron micrograph of MERCs in control (m), Atf4 KD (n), and Atf4 OE myotubes and their serial block face-scanning electron microscopy three-dimensional reconstructions (p-r), showing continuous, and stationary mitochondria (blue), nuclei (yellow), and ER (pink) in Drosophila flight muscle. Quantification of ER length (s) and ER volume (t) in control, Atf4 KD, and Atf4 OE in Drosophila flight muscle. Significance was determined by Student’s t test. *p < 0.05, **p < 0.01, ***p < 0.001, ****p < 0.0001.
Figure 4.
Figure 4.
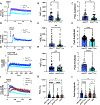
ATF4 regulates calcium homeostasis in OPA1 deficient skeletal myotubes. (A). Mitochondria Ca2+ measurements after caffeine administration (20mM) using mtpericam in control and Opa1 KO primary myotubes. (n=3). (B). Area under the curve for pericam showing decreased mitochondrial Ca2+ in Opa1 KO. (C). Quantification of peak amplitude pericam signal showing reduction in OPA1 primary myotubes. (D). Caffeine-induced (20mM) cytosolic Ca2+ tracing measured by Fura-2 fluorescence in control and Opa1 KO primary myotubes(n=5). (E). Decreased area under the curve for cytosolic Ca2+in Opa1 KO myotubes. (F). Quantification of peak Fura-2 amplitude signal in Opa1 primary myotubes compared to control. (G). Cytosolic Ca2+ levels estimated by Fura-2 in control and Opa1-KO primary myotubes following treatment with Thapsigargin (Thaps) (1uM) and Caffeine (20mM) (n=5). (H). Area under the curve for Fura-2 fluorescence in Opa1 KO myotubes compared to control. (I). Quantification of Fura-2 peak amplitude signal in Opa1 primary myotubes compared to control. (J). Tracing of cytosolic calcium by Fura-2 in primary myotubes from Opa1 KO, Atf4 KO, and double KO (DKO) of Opa1 and Atf4. (K). Area under the curve is lower in Opa1 KO compared control, but normalized in DKO, which is not significantly different relative to control. (L). Peak amplitude quantification significantly decreases in KO of Opa1 compared to control and is normalized in DKO.
Figure 5.
Figure 5.
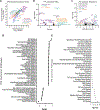
Differential expression analysis of RNA-sequencing (RNA-seq) between WT and Opa1-like KD Drosophila. A. Scatter plot from RNA-seq comparing differentially expressed genes between WT and Opa1-like KD. Select upregulated (red) and downregulated genes (blue) are highlighted. (B). Ingenuity Pathway Analysis (IPA) signals for differentially expressed pathways implicated in mitochondria dysfunction (purple), ER stress (turquoise), and calcium signaling (orange). Negative Z-scores indicate inhibited pathways and positive Z-scores represent activated pathways. (C). Select upstream regulators involved in mitochondria dysfunction (purple), ER stress (turquoise), and calcium signaling (orange), with activation Z-scores >2 or <−2. (D). IPA canonical pathways, with pathway names on the left and bars representing the Z-scores of corresponding pathways. (E). IPA canonical pathways, with names on the left and bars representing the −log (p-value)s of corresponding pathways.

References

    1. Ainbinder A, Boncompagni S, Protasi F, & Dirksen RT (2015). Role of Mitofusin-2 in mitochondrial localization and calcium uptake in skeletal muscle. Cell Calcium, 57(1), 14–24. 10.1016/j.ceca.2014.11.002 - DOI - PMC - PubMed
    1. Amodio G, Pagliara V, Moltedo O, & Remondelli K. (2021). Structural and Functional Significance of the Endoplasmic Reticulum Unfolded Protein Response Transducers and Chaperones at the Mitochondria–ER Contacts: A Cancer Perspective. Frontiers in Cell and Developmental Biology, 9. https://www.frontiersin.org/articles/10.3389/fcell.2021.641194 - DOI - PMC - PubMed
    1. Anastasia I, Ilacqua N, Raimondi A, Lemieux P, Ghandehari-Alavijeh R, Faure G, Mekhedov SL, Williams KJ, Caicci F, Valle G, Giacomello M, Quiroga AD, Lehner R, Miksis MJ, Toth K, de Aguiar Vallim TQ, Koonin EV, Scorrano L, & Pellegrini K. (2021). Mitochondria-rough-ER contacts in the liver regulate systemic lipid homeostasis. Cell Reports, 34(11), 108873. 10.1016/j.celrep.2021.108873 - DOI - PubMed
    1. Betz C, Stracka D, Prescianotto-Baschong C, Frieden M, Demaurex N, & Hall MN (2013). Feature Article: mTOR complex 2-Akt signaling at mitochondria-associated endoplasmic reticulum membranes (MAM) regulates mitochondrial physiology. Proceedings of the National Academy of Sciences of the United States of America, 110(31), 12526–12534. 10.1073/pnas.1302455110 - DOI - PMC - PubMed
    1. Bravo R, Vicencio JM, Parra V, Troncoso R, Munoz JP, Bui M, Quiroga C, Rodriguez AE, Verdejo HE, Ferreira J, Iglewski M, Chiong M, Simmen T, Zorzano A, Hill JA, Rothermel BA, Szabadkai G, & Lavandero K. (2011). Increased ER-mitochondrial coupling promotes mitochondrial respiration and bioenergetics during early phases of ER stress. Journal of Cell Science, 124(Pt 13), 2143–2152. 10.1242/jcs.080762 - DOI - PMC - PubMed

LinkOut - more resources