

Streamlined Multi-Attribute Assessment of an Array of Clinical-Stage Antibodies: Relationship Between Degradation and Stability
- PMID: 38419510
- PMCID: PMC11684140
- DOI: 10.1177/00037028241231824
Streamlined Multi-Attribute Assessment of an Array of Clinical-Stage Antibodies: Relationship Between Degradation and Stability
Abstract
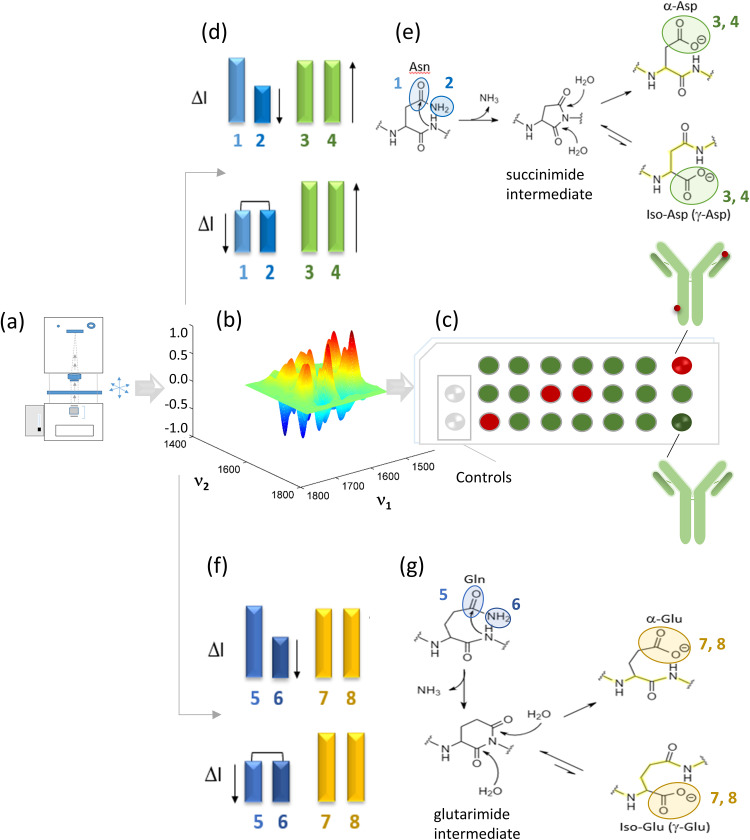
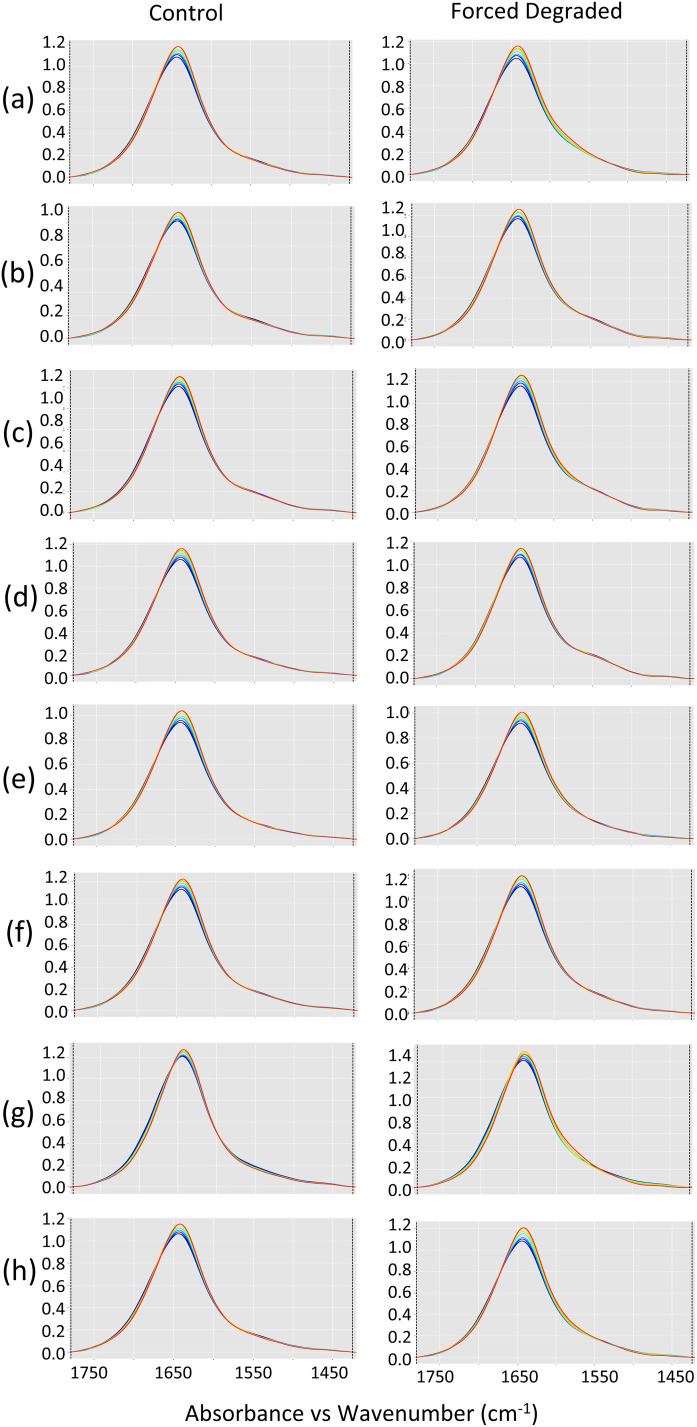
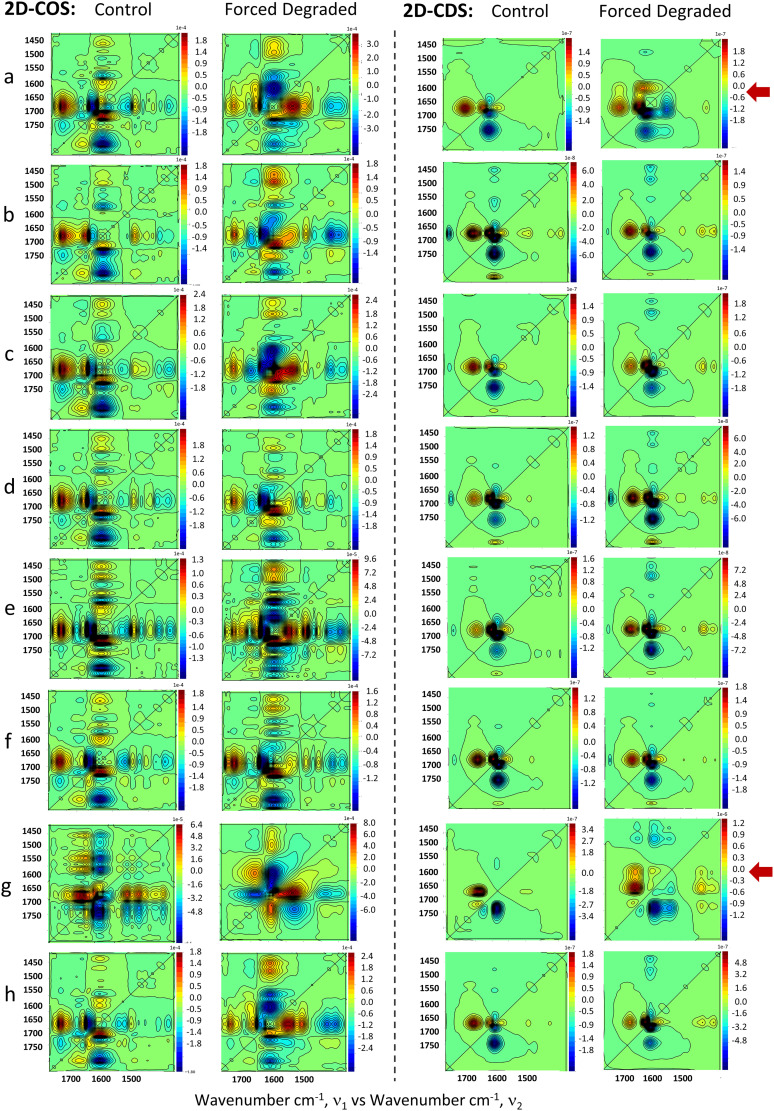
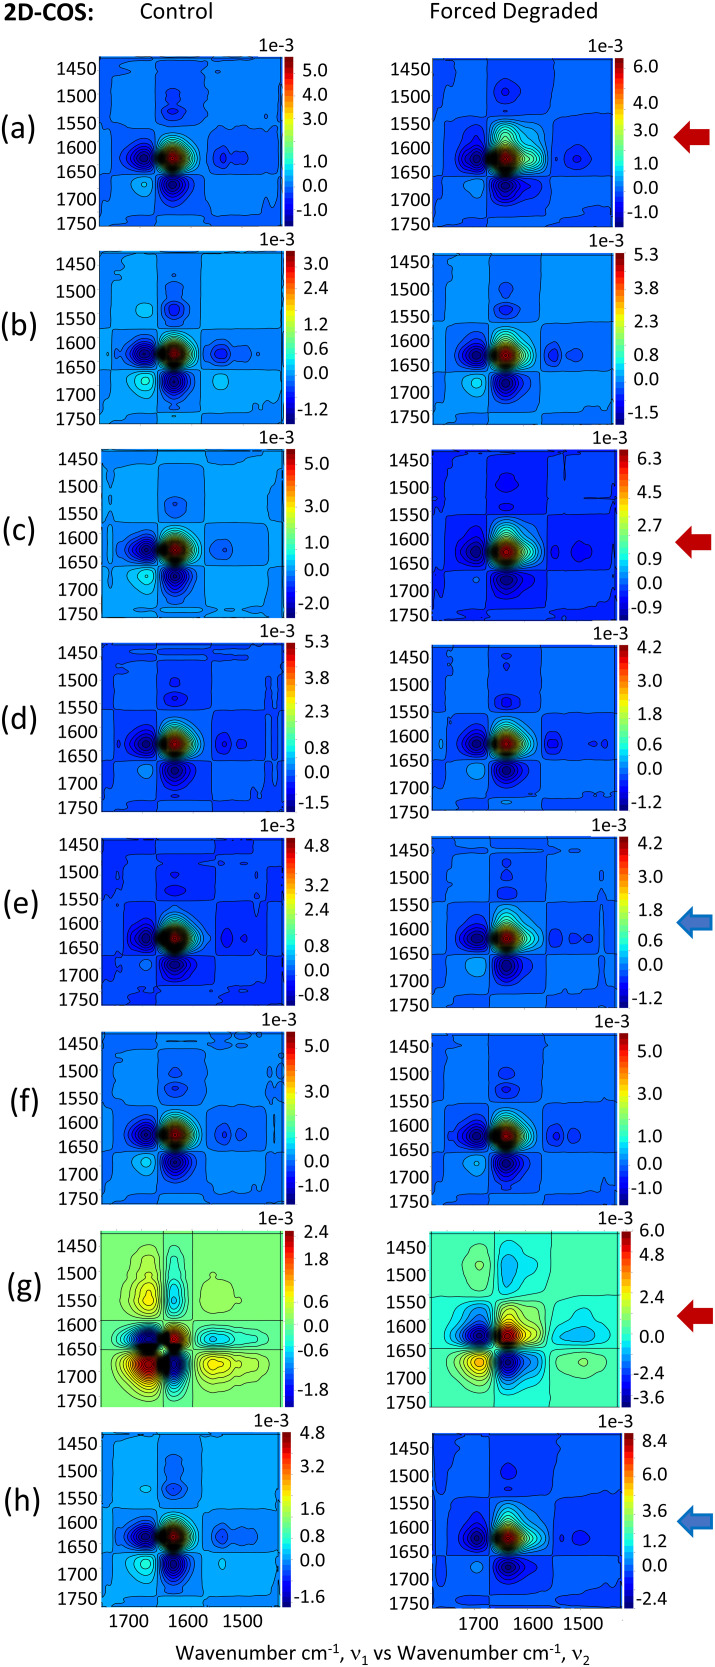
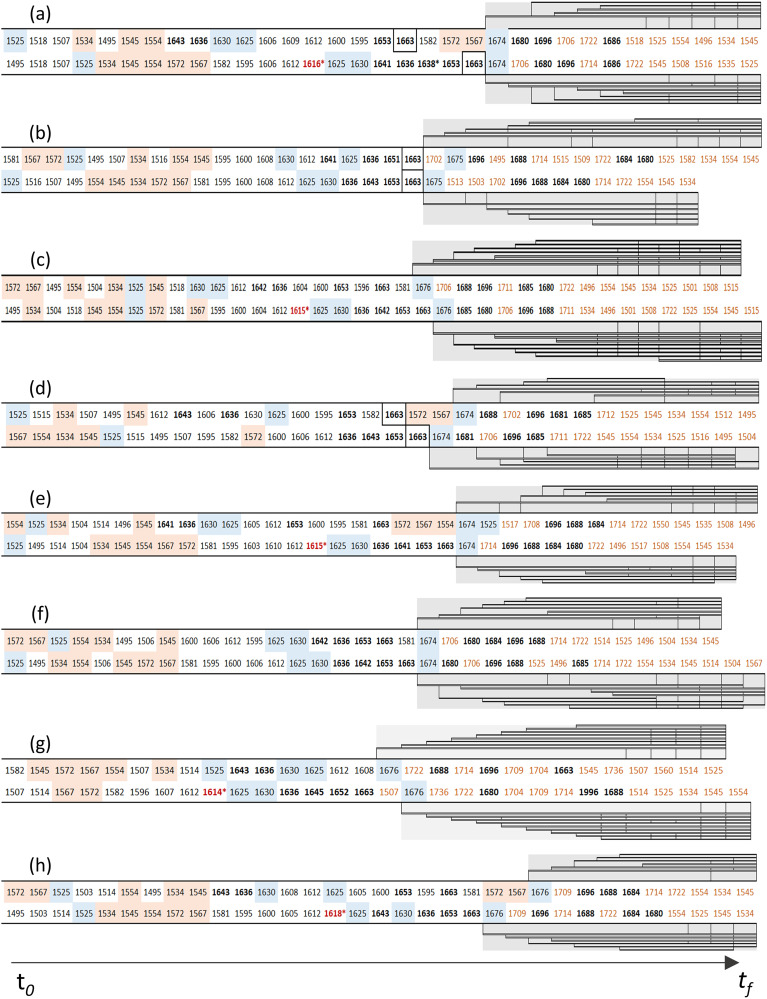
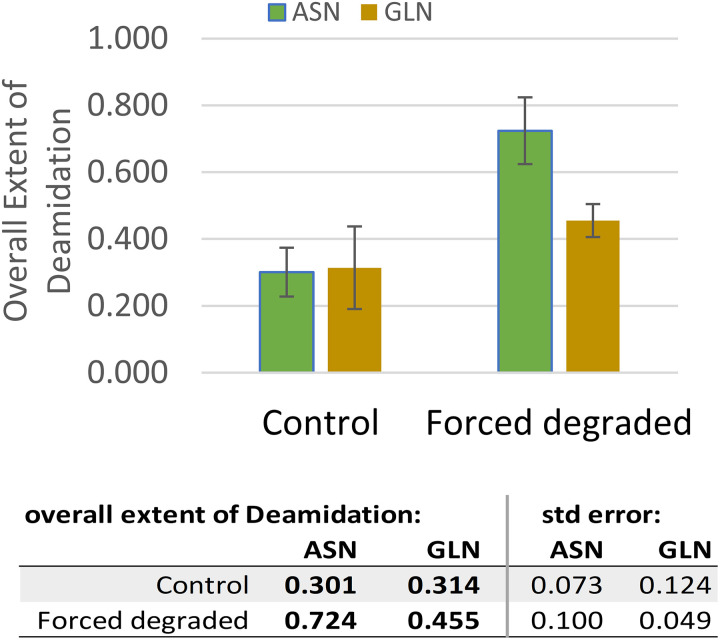
Clinical antibodies are an important class of drugs for the treatment of both chronic and acute diseases. Their manufacturability is subject to evaluation to ensure product quality and efficacy. One critical quality attribute is deamidation, a non-enzymatic process that is observed to occur during thermal stress, at low or high pH, or a combination thereof. Deamidation may induce antibody instability and lead to aggregation, which may pose immunogenicity concerns. The introduction of a negative charge via deamidation may impact the desired therapeutic function (i) within the complementarity-determining region, potentially causing loss of efficacy; or (ii) within the fragment crystallizable region, limiting the effector function involving antibody-dependent cellular cytotoxicity. Here we describe a transformative solution that allows for a comparative assessment of deamidation and its impact on stability and aggregation. The innovative streamlined method evaluates the intact protein in its formulation conditions. This breakthrough platform technology is comprised of a quantum cascade laser microscope, a slide cell array that allows for flexibility in the design of experiments, and dedicated software. The enhanced spectral resolution is achieved using two-dimensional correlation, co-distribution, and two-trace two-dimensional correlation spectroscopies that reveal the molecular impact of deamidation. Eight re-engineered immunoglobulin G4 scaffold clinical antibodies under control and forced degradation conditions were evaluated for deamidation and aggregation. We determined the site of deamidation, the overall extent of deamidation, and where applicable, whether the deamidation event led to self-association or aggregation of the clinical antibody and the molecular events that led to the instability. The results were confirmed using orthogonal techniques for four of the samples.
Keywords: 2D-COS; 2T2D; Biotherapeutic; HPLC; asparagine and glutamine deamidation; cation exchange; co-distribution correlation spectroscopy; correlation spectroscopy; extent of deamidation; high-performance liquid chromatography; protein aggregation; protein stability; quantum cascade laser microspectroscopy; two-dimensional correlation spectroscopy; two-trace two-dimensional.
Conflict of interest statement
Declaration of Conflicting InterestsThe authors declared no potential conflicts of interest with respect to the research, authorship, and/or publication of this article.
Figures
Similar articles
-
Characterization of IgG1 Fc Deamidation at Asparagine 325 and Its Impact on Antibody-dependent Cell-mediated Cytotoxicity and FcγRIIIa Binding.Sci Rep. 2020 Jan 15;10(1):383. doi: 10.1038/s41598-019-57184-2. Sci Rep. 2020. PMID: 31941950 Free PMC article.
-
Engineering an anti-CD52 antibody for enhanced deamidation stability.MAbs. 2019 Oct;11(7):1266-1275. doi: 10.1080/19420862.2019.1631117. Epub 2019 Jul 18. MAbs. 2019. PMID: 31199181 Free PMC article.
-
Atypical Asparagine Deamidation of NW Motif Significantly Attenuates the Biological Activities of an Antibody Drug Conjugate.Antibodies (Basel). 2023 Oct 24;12(4):68. doi: 10.3390/antib12040068. Antibodies (Basel). 2023. PMID: 37987246 Free PMC article.
-
Oxidation and Deamidation of Monoclonal Antibody Products: Potential Impact on Stability, Biological Activity, and Efficacy.J Pharm Sci. 2022 Apr;111(4):903-918. doi: 10.1016/j.xphs.2021.11.024. Epub 2021 Dec 7. J Pharm Sci. 2022. PMID: 34890632 Review.
-
Chemical and physical instabilities in manufacturing and storage of therapeutic proteins.Curr Opin Biotechnol. 2019 Dec;60:159-167. doi: 10.1016/j.copbio.2019.01.014. Epub 2019 Mar 9. Curr Opin Biotechnol. 2019. PMID: 30861476 Review.
Cited by
-
Protein Microarrays for High Throughput Hydrogen/Deuterium Exchange Monitored by FTIR Imaging.Int J Mol Sci. 2024 Sep 16;25(18):9989. doi: 10.3390/ijms25189989. Int J Mol Sci. 2024. PMID: 39337477 Free PMC article.
References
-
- U.S. Food and Drug Administration. “Purple Book Database of Licensed Biological Products”. https://purplebooksearch.fda.gov/ [accessed Jan 21 2024].
LinkOut - more resources
Full Text Sources
