

The mutual interactions among Helicobacter pylori, chronic gastritis, and the gut microbiota: a population-based study in Jinjiang, Fujian
- PMID: 38419635
- PMCID: PMC10899393
- DOI: 10.3389/fmicb.2024.1365043
The mutual interactions among Helicobacter pylori, chronic gastritis, and the gut microbiota: a population-based study in Jinjiang, Fujian
Abstract
Objectives: Helicobacter pylori (H. pylori) is a type of bacteria that infects the stomach lining, and it is a major cause of chronic gastritis (CG). H. pylori infection can influence the composition of the gastric microbiota. Additionally, alterations in the gut microbiome have been associated with various health conditions, including gastrointestinal disorders. The dysbiosis in gut microbiota of human is associated with the decreased secretion of gastric acid. Chronic atrophic gastritis (CAG) and H. pylori infection are also causes of reduced gastric acid secretion. However, the specific details of how H. pylori infection and CG, especially for CAG, influence the gut microbiome can vary and are still an area of ongoing investigation. The incidence of CAG and infection rate of H. pylori has obvious regional characteristics, and Fujian Province in China is a high incidence area of CAG as well as H. pylori infection. We aimed to characterize the microbial changes and find potential diagnostic markers associated with infection of H. pylori as well as CG of subjects in Jinjiang City, Fujian Province, China.
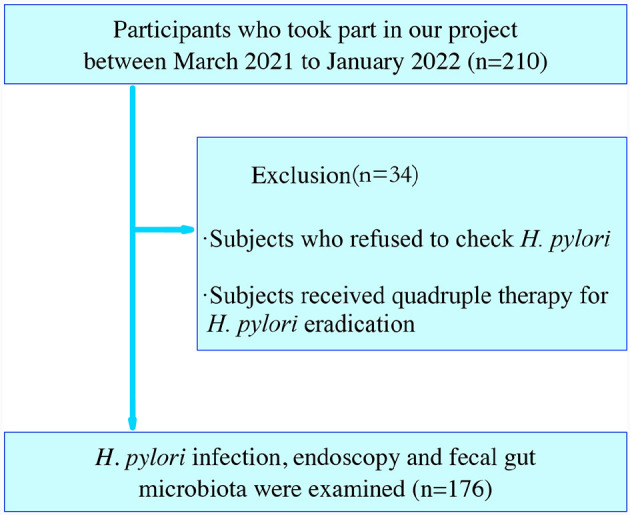
Participants: Enrollment involved sequencing the 16S rRNA gene in fecal samples from 176 cases, adhering to stringent inclusion and exclusion criteria. For our study, we included healthy volunteers (Normal), individuals with chronic non-atrophic gastritis (CNAG), and those with CAG from Fujian, China. The aim was to assess gut microbiome dysbiosis based on various histopathological features. QIIME and LEfSe analyses were performed. There were 176 cases, comprising 126 individuals who tested negative for H. pylori and 50 who tested positive defined by C14 urea breath tests and histopathological findings in biopsies obtained through endoscopy. CAG was also staged by applying OLGIM system.
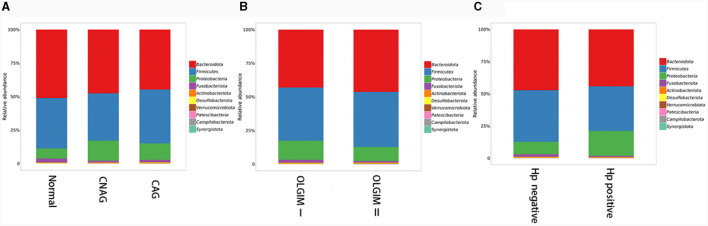
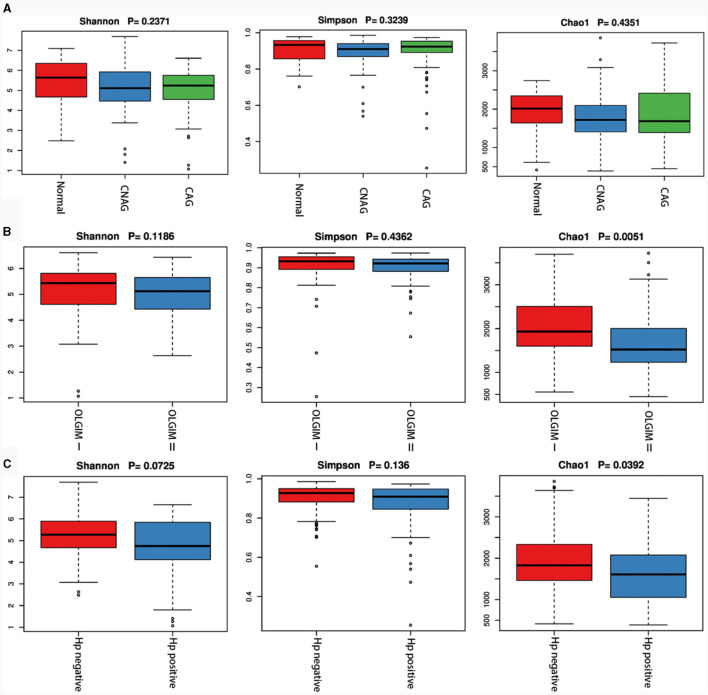
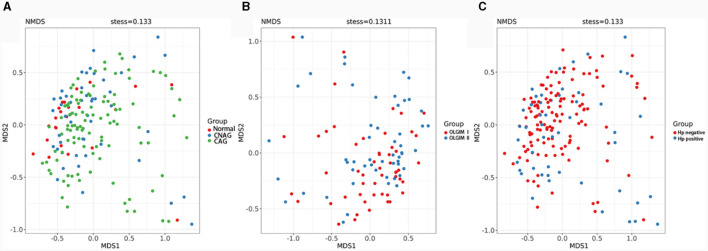
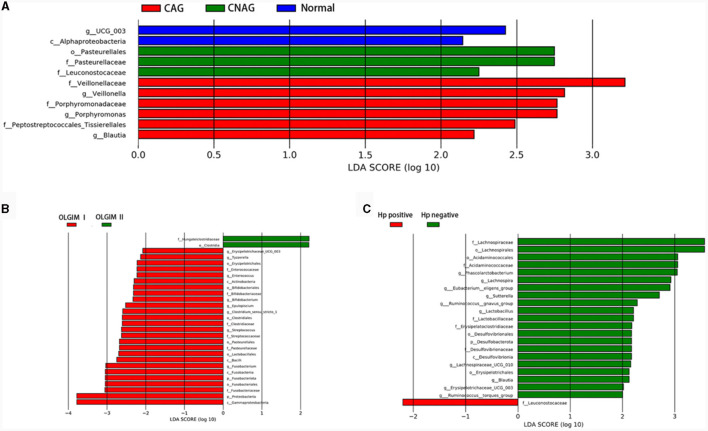
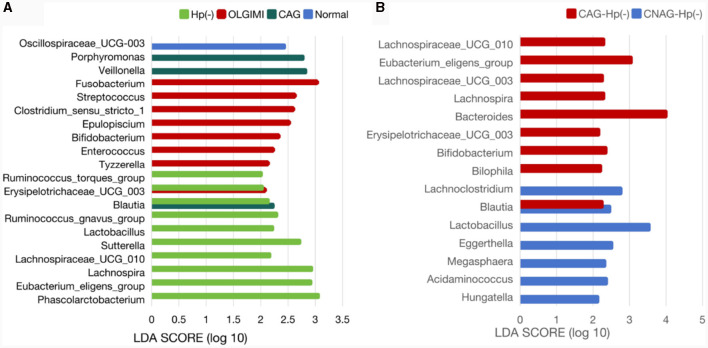
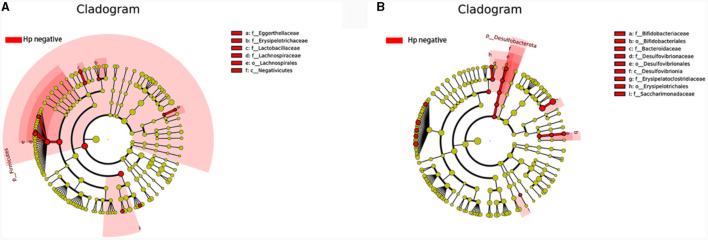
Results: When merging the outcomes from 16S rRNA gene sequencing results, there were no notable variations in alpha diversity among the following groups: Normal, CNAG, and CAG; OLGIM I and OLGIM II; and H. pylori positive [Hp (+)] and H. pylori negative [Hp (-)] groups. Beta diversity among different groups show significant separation through the NMDS diagrams. LEfSe analyses confirmed 2, 3, and 6 bacterial species were in abundance in the Normal, CNAG, and CAG groups; 26 and 2 species in the OLGIM I and OLGIM II group; 22 significant phylotypes were identified in Hp (+) and Hp (-) group, 21 and 1, respectively; 9 bacterial species exhibited significant differences between individuals with CG who were Hp (+) and those who were Hp (-).
Conclusion: The study uncovered notable distinctions in the characteristics of gut microbiota among the following groups: Normal, CNAG, and CAG; OLGIM I and OLGIM II; and Hp (+) and Hp (-) groups. Through the analysis of H. pylori infection in CNAG and CAG groups, we found the gut microbiota characteristics of different group show significant difference because of H. pylori infection. Several bacterial genera could potentially serve as diagnostic markers for H. pylori infection and the progression of CG.
Keywords: Helicobacter pylori; chronic atrophic gastritis; gastric microenvironment; gastritis; gut microbiota.
Copyright © 2024 Li, Hu, Huang, Ding, Zhu, Li, Lan, Huang and Lin.
Conflict of interest statement
The authors declare that the research was conducted in the absence of any commercial or financial relationships that could be construed as a potential conflict of interest.
Figures
References
-
- Capelle L. G., de Vries A. C., Haringsma J., Ter Borg F., de Vries R. A., Bruno M. J., et al. (2010). The staging of gastritis with the OLGA system by using intestinal metaplasia as an accurate alternative for atrophic gastritis. Gastrointest. Endosc. 71, 1150–1158. 10.1016/j.gie.2009.12.029 - DOI - PubMed
LinkOut - more resources
Full Text Sources
Research Materials
Miscellaneous