

Ruminal microbiota and muscle metabolome characteristics of Tibetan plateau yaks fed different dietary protein levels
- PMID: 38419639
- PMCID: PMC10899706
- DOI: 10.3389/fmicb.2024.1275865
Ruminal microbiota and muscle metabolome characteristics of Tibetan plateau yaks fed different dietary protein levels
Abstract
Introduction: The dietary protein level plays a crucial role in maintaining the equilibrium of rumen microbiota in yaks. To explore the association between dietary protein levels, rumen microbiota, and muscle metabolites, we examined the rumen microbiome and muscle metabolome characteristics in yaks subjected to varying dietary protein levels.
Methods: In this study, 36 yaks were randomly assigned to three groups (n = 12 per group): low dietary protein group (LP, 12% protein concentration), medium dietary protein group (MP, 14% protein concentration), and high dietary protein group (HP, 16% protein concentration).
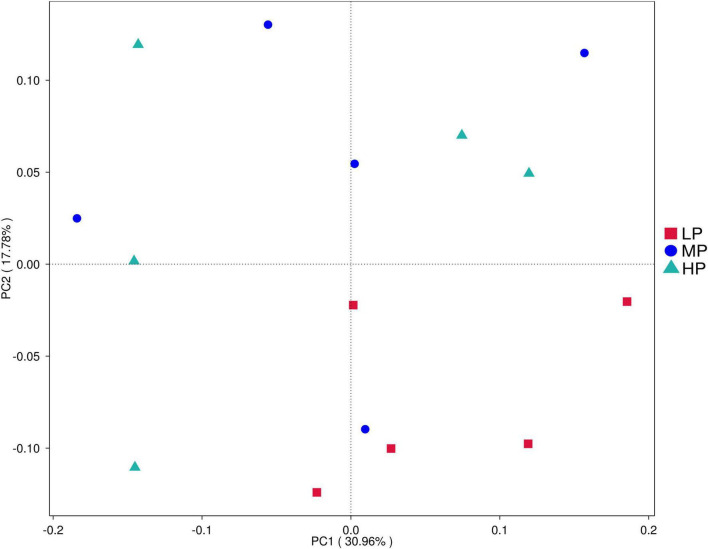
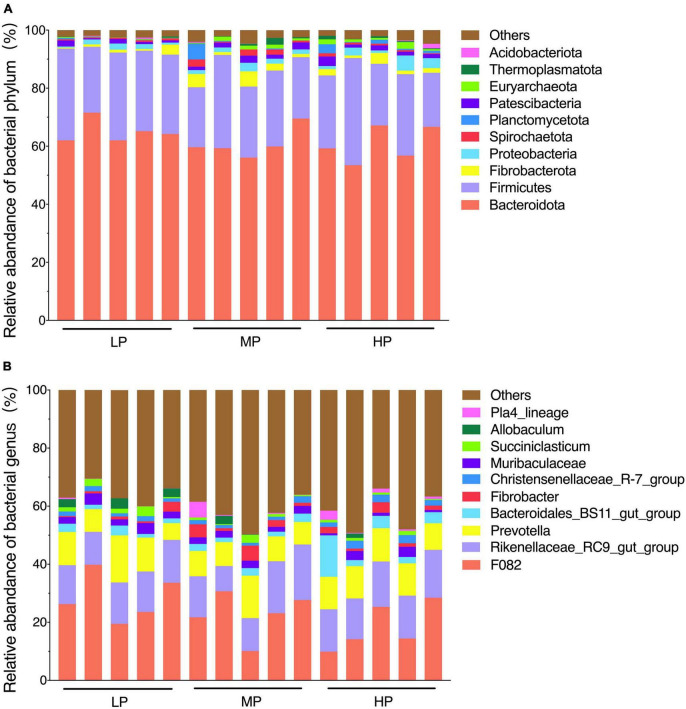
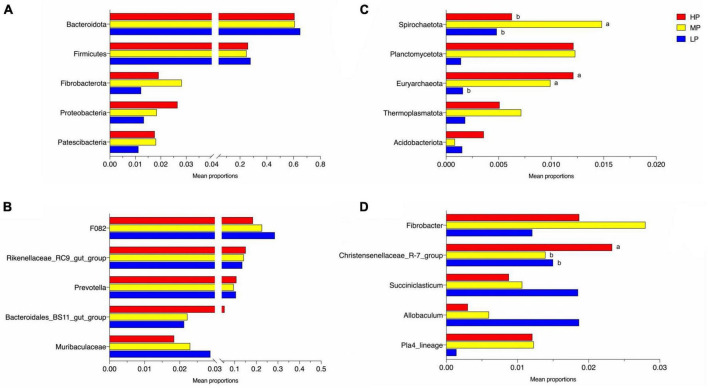
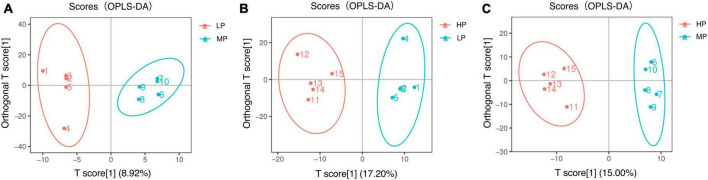
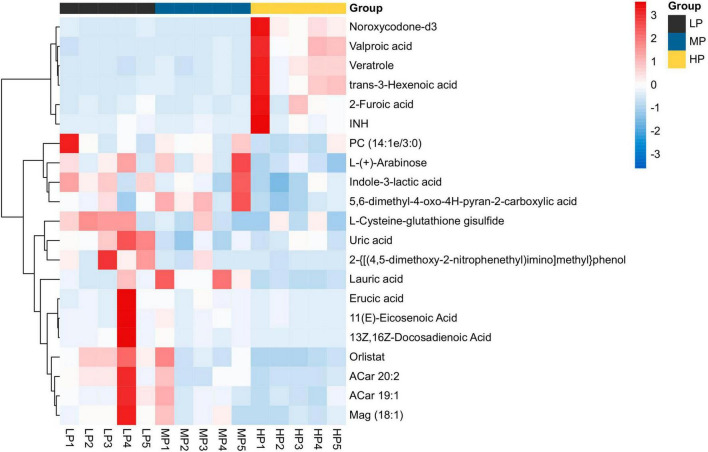
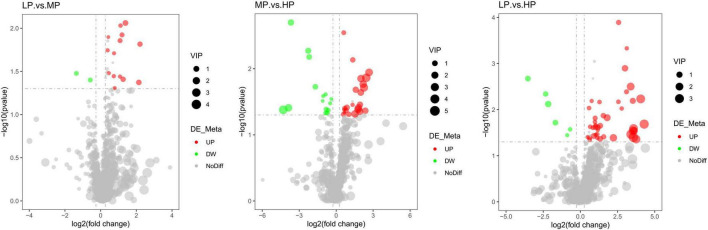
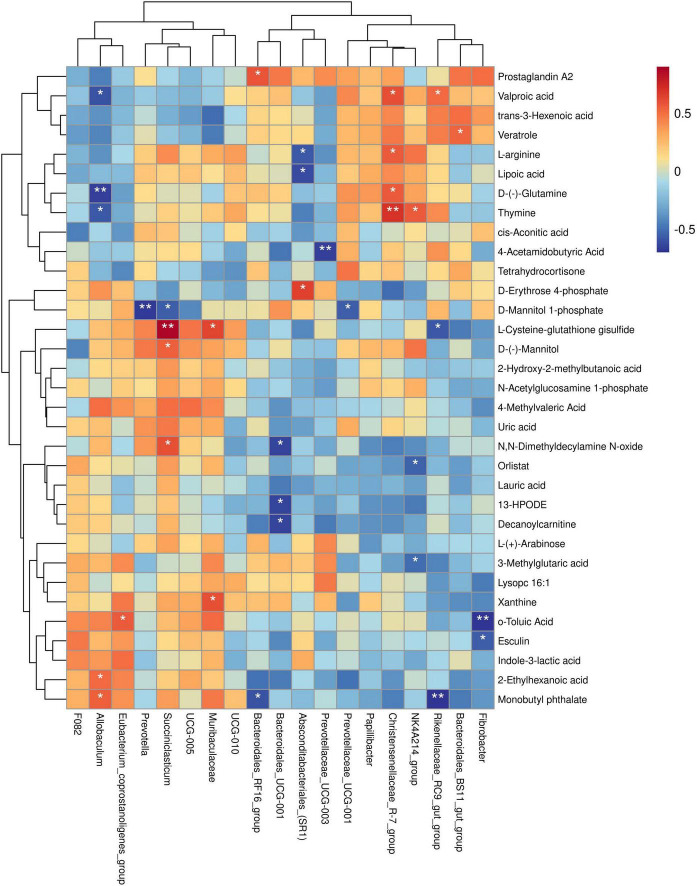
Results: 16S rDNA sequencing revealed that the HP group exhibited the highest Chao1 and Observed_species indices, while the LP group demonstrated the lowest. Shannon and Simpson indices were significantly elevated in the MP group relative to the LP group (P < 0.05). At the genus level, the relative abundance of Christensenellaceae_R-7_group in the HP group was notably greater than that in the LP and MP groups (P < 0.05). Conversely, the relative abundance of Rikenellaceae_RC9_gut_group displayed an increasing tendency with escalating feed protein levels. Muscle metabolism analysis revealed that the content of the metabolite Uric acid was significantly higher in the LP group compared to the MP group (P < 0.05). The content of the metabolite L-(+)-Arabinose was significantly increased in the MP group compared to the HP group (P < 0.05), while the content of D-(-)-Glutamine and L-arginine was significantly reduced in the LP group (P < 0.05). The levels of metabolites 13-HPODE, Decanoylcarnitine, Lauric acid, L-(+)-Arabinose, and Uric acid were significantly elevated in the LP group relative to the HP group (P < 0.05). Furthermore, our observations disclosed correlations between rumen microbes and muscle metabolites. The relative abundance of NK4A214_group was negatively correlated with Orlistat concentration; the relative abundance of Christensenellaceae_R-7_group was positively correlated with D-(-)-Glutamine and L-arginine concentrations.
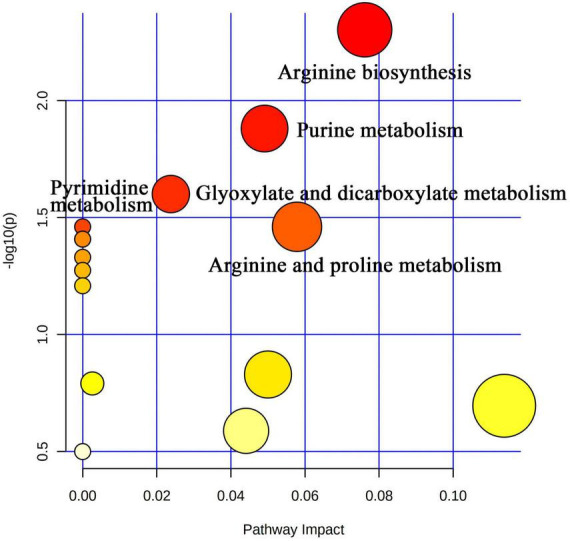
Discussion: Our findings offer a foundation for comprehending the rumen microbiome of yaks subjected to different dietary protein levels and the intimately associated metabolic pathways of the yak muscle metabolome. Elucidating the rumen microbiome and muscle metabolome of yaks may facilitate the determination of dietary protein levels.
Keywords: metabolomics; metabolomics yaks; microbiota; muscle; protein levels; rumen; yaks.
Copyright © 2024 Pang, Wang, Chai, Yang, Wang, Liu, Ding and Wang.
Conflict of interest statement
The authors declare that the research was conducted in the absence of any commercial or financial relationships that could be construed as a potential conflict of interest.
Figures
Similar articles
-
Effect of Dietary Protein Levels on Dynamic Changes and Interactions of Ruminal Microbiota and Metabolites in Yaks on the Qinghai-Tibetan Plateau.Front Microbiol. 2021 Aug 9;12:684340. doi: 10.3389/fmicb.2021.684340. eCollection 2021. Front Microbiol. 2021. PMID: 34434174 Free PMC article.
-
Concentrate supplementation improves cold-season environmental fitness of grazing yaks: responsive changes in the rumen microbiota and metabolome.Front Microbiol. 2023 Aug 28;14:1247251. doi: 10.3389/fmicb.2023.1247251. eCollection 2023. Front Microbiol. 2023. PMID: 37700865 Free PMC article.
-
Dietary forage to concentrate ratios impact on yak ruminal microbiota and metabolites.Front Microbiol. 2022 Aug 11;13:964564. doi: 10.3389/fmicb.2022.964564. eCollection 2022. Front Microbiol. 2022. PMID: 36033892 Free PMC article.
-
Dietary energy and protein gradients drive metabolic adaptation in growing-finishing yaks on the Qinghai-Tibet plateau.Anim Nutr. 2025 Apr 5;21:351-364. doi: 10.1016/j.aninu.2025.01.009. eCollection 2025 Jun. Anim Nutr. 2025. PMID: 40487107 Free PMC article.
-
Linkages between rumen microbiome, host, and environment in yaks, and their implications for understanding animal production and management.Front Microbiol. 2024 Jan 29;15:1301258. doi: 10.3389/fmicb.2024.1301258. eCollection 2024. Front Microbiol. 2024. PMID: 38348184 Free PMC article. Review.
Cited by
-
Integrating 16S rRNA Sequencing and LC-MS-Based Metabolomics to Evaluate the Effects of Dietary Crude Protein on Ruminal Morphology, Fermentation Parameter and Digestive Enzyme Activity in Tibetan Sheep.Animals (Basel). 2024 Jul 24;14(15):2149. doi: 10.3390/ani14152149. Animals (Basel). 2024. PMID: 39123675 Free PMC article.
-
Effects of Dietary Protein Levels on Digestion, Metabolism, Serum Biochemical Indexes, and Rumen Microflora of Lanzhou Fat-Tailed Sheep.Animals (Basel). 2024 Dec 25;15(1):25. doi: 10.3390/ani15010025. Animals (Basel). 2024. PMID: 39794968 Free PMC article.
-
Lactobacillus Supplementation Modulates Rumen Microbiota and Metabolism in Yaks Under Fattening Feeding Conditions: A Comprehensive Multi-Omics Analysis.Animals (Basel). 2025 Jun 6;15(12):1681. doi: 10.3390/ani15121681. Animals (Basel). 2025. PMID: 40564234 Free PMC article.
-
Effects of Different Rearing Methods on the Intestinal Morphology, Intestinal Metabolites, and Gut Microbiota of Lueyang Black-Bone Chickens.Animals (Basel). 2025 Jun 14;15(12):1758. doi: 10.3390/ani15121758. Animals (Basel). 2025. PMID: 40564310 Free PMC article.
-
Multiomics of yaks reveals significant contribution of microbiome into host metabolism.NPJ Biofilms Microbiomes. 2024 Nov 21;10(1):133. doi: 10.1038/s41522-024-00609-2. NPJ Biofilms Microbiomes. 2024. PMID: 39572587 Free PMC article.
References
-
- Al-Nada A. H. (2020). Effect of Lipase Inhibitor (Orlistat) on gliclazide and metformin in response to high-fat meal in rat’s gastrointestinal tract. Int. J. Pharmacol. 16 416–421.
-
- Argyri A. A., Doulgeraki A. I., Blana V. A., Panagou E. Z., Nychas G. J. (2011). Potential of a simple HPLC-based approach for the identification of the spoilage status of minced beef stored at various temperatures and packaging systems. Int. J. Food Microbiol. 150 25–33. 10.1016/j.ijfoodmicro.2011.07.010 - DOI - PubMed
-
- Baker B. J., De Anda V., Seitz K. W., Dombrowski N., Santoro A. E., Lloyd K. G. (2020). Diversity, ecology and evolution of Archaea. Nat. Microbiol. 5 887–900. - PubMed
-
- Biddle A., Stewart L., Blanchard J., Leschine S. (2013). Untangling the genetic basis of fibrinolytic specialization by lachnospiraceae and ruminococcaceae in diverse gut communities. Diversity 5 627–640.
LinkOut - more resources
Full Text Sources
Research Materials
Miscellaneous