

Differences in cervical length during the second trimester among normal weight, overweight and obese women: A systematic review and meta-analysis
- PMID: 38419650
- PMCID: PMC10900401
- DOI: 10.1016/j.eurox.2024.100291
Differences in cervical length during the second trimester among normal weight, overweight and obese women: A systematic review and meta-analysis
Abstract
Objective: Maternal obesity has been previously linked to increased risk of preterm birth; however, the actual pathophysiology behind this observation remains unknown. Cervical length seems to differentiate among overweight, obese and extremely obese patients, compared to normal weight women. However, to date the actual association between body mass index and cervical length remains unknown. In this systematic review, accumulated evidence is presented to help establish clinical implementations and research perspectives.
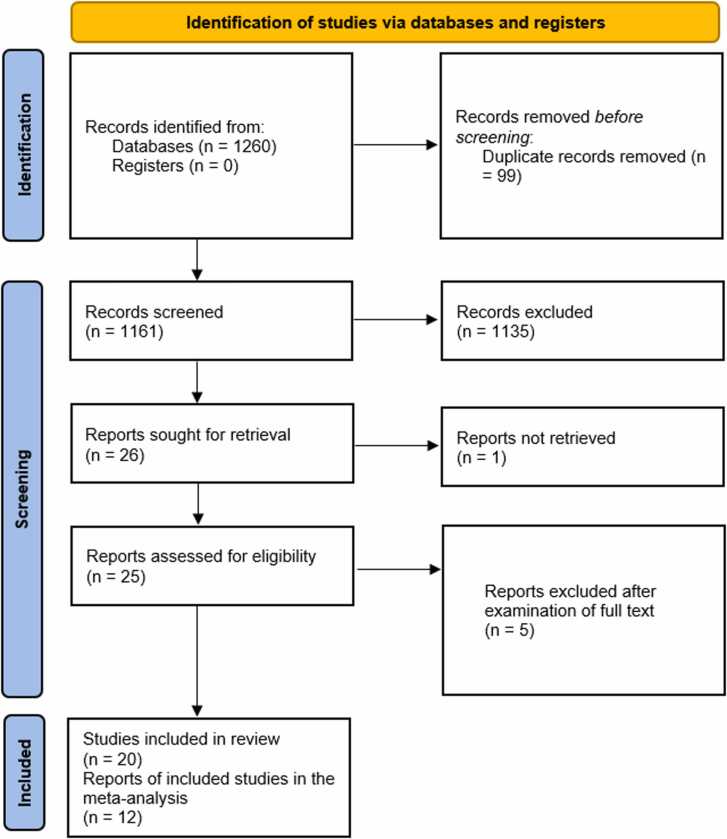
Methods: We searched Medline, Scopus, the Cochrane Central Register of Controlled Trials CENTRAL, Google Scholar, and Clinicaltrials.gov databases from inception till February 2023. Observational studies that reported on women undergone ultrasound assessment of their cervical length during pregnancy were included, when there was data regarding their body mass index. Statistical meta-analysis was performed with RStudio. The quality of the included studies was assessed using the Newcastle-Ottawa Quality Assessment Scale (NOS).
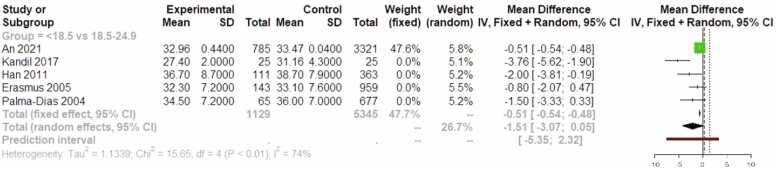
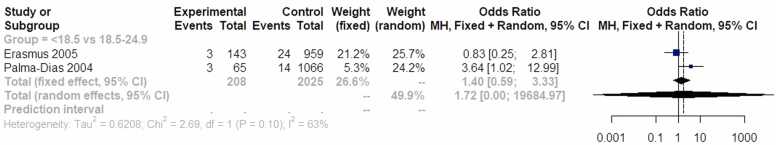
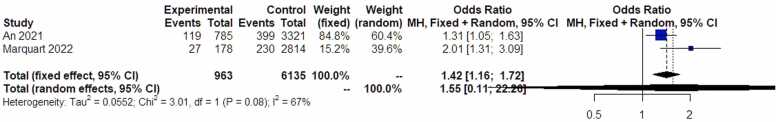
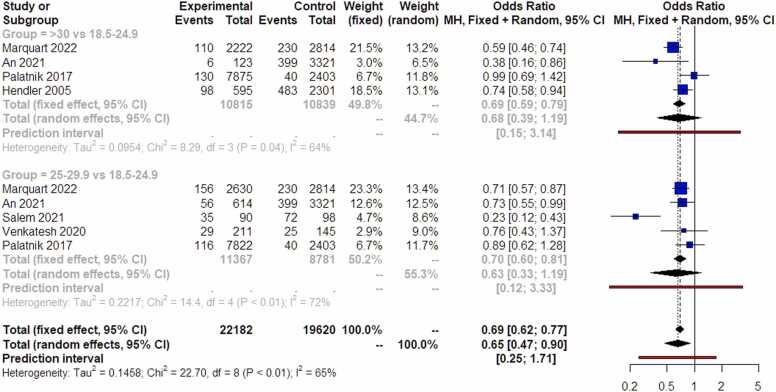
Results: Overall, 20 studies were included in this systematic review and 12 in the meta-analysis. Compared to women with normal weight, underweight women were not associated with increased risk of CL < 15 mm or < 30 mm and their mean CL was comparable (MD -1.51; 95% CI -3.07, 0.05). Overweight women were found to have greater cervical length compared to women with normal weight (MD 1.87; 95% CI 0.52, 3.23) and had a lower risk of CL < 30 mm (OR 0.65; 95% CI 0.47, 0.90).
Conclusion: Further research into whether BMI is associated with cervical length in pregnant women is deemed necessary, with large, well-designed, prospective cohort studies with matched control group.
Keywords: Body mass index; Cervical length; Overweight; Underweight.
© 2024 The Authors.
Conflict of interest statement
The authors declare that they have no known competing financial interests or personal relationships that could have appeared to influence the work reported in this paper.
Figures

Similar articles
-
Risk of neural tube defects according to maternal body mass index: a systematic review and meta-analysis.J Matern Fetal Neonatal Med. 2022 Dec;35(25):7296-7305. doi: 10.1080/14767058.2021.1946789. Epub 2021 Jul 5. J Matern Fetal Neonatal Med. 2022. PMID: 34219595
-
The effect of weight management interventions that include a diet component on weight-related outcomes in pregnant and postpartum women: a systematic review protocol.JBI Database System Rev Implement Rep. 2015 Jan;13(1):88-98. doi: 10.11124/jbisrir-2015-1812. JBI Database System Rev Implement Rep. 2015. PMID: 26447010
-
Is body mass index associated with outcomes of mechanically ventilated adult patients in intensive critical units? A systematic review and meta-analysis.PLoS One. 2018 Jun 8;13(6):e0198669. doi: 10.1371/journal.pone.0198669. eCollection 2018. PLoS One. 2018. PMID: 29883469 Free PMC article.
-
Effects of nutritional interventions during pregnancy on birth, child health and development outcomes: A systematic review of evidence from low- and middle-income countries.Campbell Syst Rev. 2021 Jun 21;17(2):e1150. doi: 10.1002/cl2.1150. eCollection 2021 Jun. Campbell Syst Rev. 2021. PMID: 37131924 Free PMC article.
-
Effects of Maternal Exercise During Pregnancy on Perinatal Growth and Childhood Obesity Outcomes: A Meta-analysis and Meta-regression.Sports Med. 2021 Nov;51(11):2329-2347. doi: 10.1007/s40279-021-01499-6. Epub 2021 Jun 18. Sports Med. 2021. PMID: 34143412
References
Publication types
LinkOut - more resources
Full Text Sources
