. 2024 Feb 14:12:1353333.
doi: 10.3389/fbioe.2024.1353333. eCollection 2024.

Three-dimensional array of microbubbles sonoporation of cells in microfluidics

Affiliations

Three-dimensional array of microbubbles sonoporation of cells in microfluidics

Guangyong Huang et al. Front Bioeng Biotechnol. .

Abstract

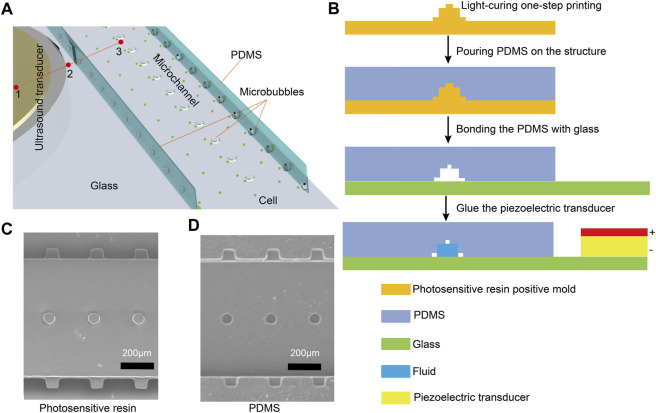
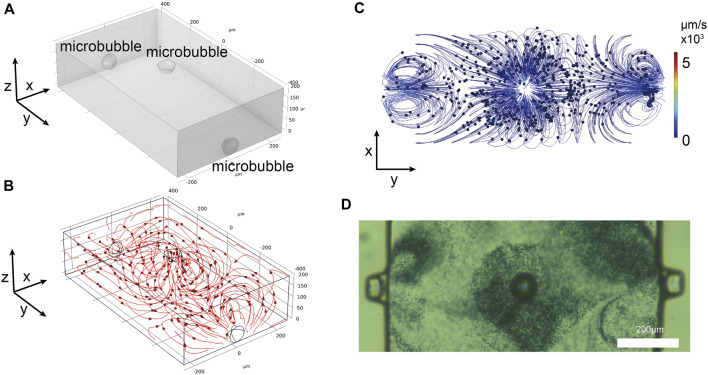
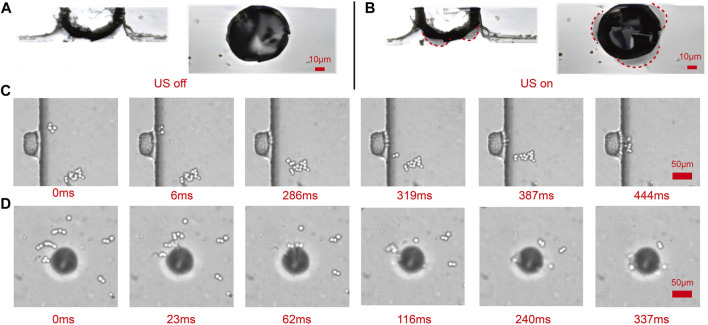
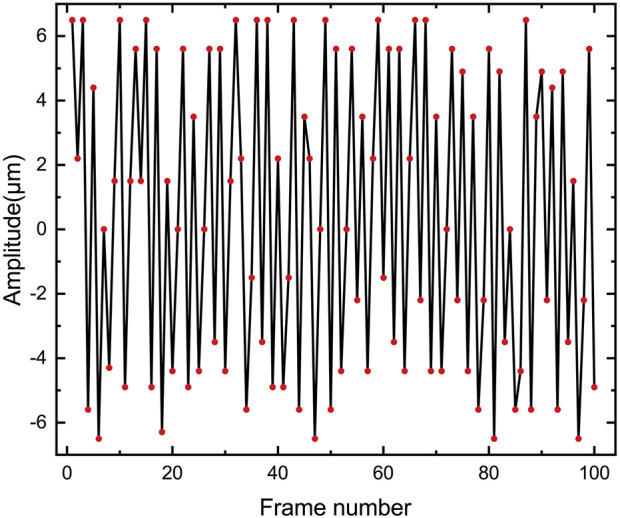
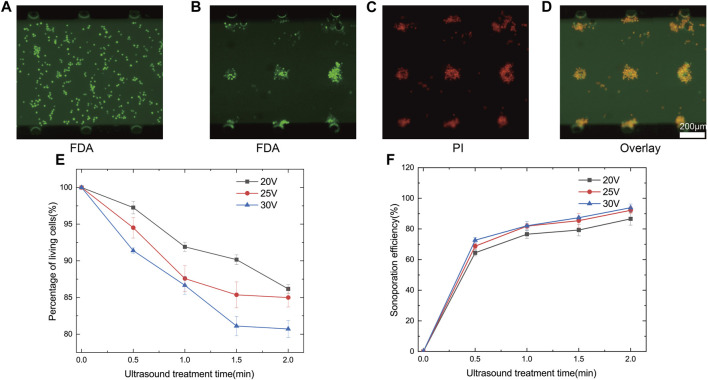
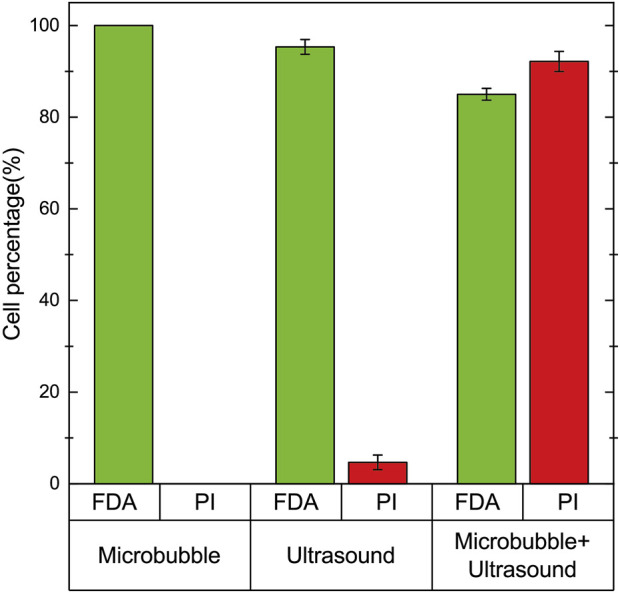
Sonoporation is a popular membrane disruption technique widely applicable in various fields, including cell therapy, drug delivery, and biomanufacturing. In recent years, there has been significant progress in achieving controlled, high-viability, and high-efficiency cell sonoporation in microfluidics. If the microchannels are too small, especially when scaled down to the cellular level, it still remains a challenge to overcome microchannel clogging, and low throughput. Here, we presented a microfluidic device capable of modulating membrane permeability through oscillating three-dimensional array of microbubbles. Simulations were performed to analyze the effective range of action of the oscillating microbubbles to obtain the optimal microchannel size. Utilizing a high-precision light curing 3D printer to fabricate uniformly sized microstructures in a one-step on both the side walls and the top surface for the generation of microbubbles. These microbubbles oscillated with nearly identical amplitudes and frequencies, ensuring efficient and stable sonoporation within the system. Cells were captured and trapped on the bubble surface by the acoustic streaming and secondary acoustic radiation forces induced by the oscillating microbubbles. At a driving voltage of 30 Vpp, the sonoporation efficiency of cells reached 93.9% ± 2.4%.

Keywords: acoustic radiation force; acoustic streaming; membrane disruption; microfluidics; sonoporation.


Conflict of interest statement

The authors declare that the research was conducted in the absence of any commercial or financial relationships that could be construed as a potential conflict of interest.

Figures

FIGURE 1
FIGURE 1
(A)Schematic diagram of the microfluidic chip device. The marks 1, 2, and 3 represent the three positions for temperature measurement. (B) The fabrication process of the microfluidic chip is based on photoresin printing and PDMS molding. The ultrasound transducer is affixed to the glass using adhesive. (C) Top view of the photosensitive resin chip structure taken by Scanning Electron Microscope. (D) Scanning Electron Microscope photograph of the structure of PDMS torn from the photosensitive resin.
FIGURE 2
FIGURE 2
As the fluid flows through the microchannels, microbubbles of the same diameter are generated in the microcavities at the side walls and top due to surface tension.
FIGURE 3
FIGURE 3
(A) Three-dimensional simulation model. (B) Streamlines formed by the simulated microbubbles. (C) Top-down view of particles movement in the simulation model. (D) Experimental observation of polystyrene particles movement around the microbubbles.
FIGURE 4
FIGURE 4
Observation of the shape of sidewall and top microbubbles and trapped captured cells based on the high-speed camera and the microscope. (A) The shape of the microbubble in the absence of ultrasound presence. (B) The shape of the microbubble in the presence of ultrasound. (C) With the presence of ultrasound, all cells in the microchannel are attracted toward the oscillating sidewall microbubbles in 444 ms. (D) With the presence of ultrasound, all cells in the microchannel are attracted toward the oscillating top microbubbles in 337 ms.
FIGURE 5
FIGURE 5
The variation of the amplitude of the oscillating microbubbles with the number of frames at 97.5 kHz and 30 Vpp was recorded using a stroboscopic technique.
FIGURE 6
FIGURE 6
(A)The temperature of the substrate was measured with a thermal imaging camera in three regions (Marked as 1,2,3 in Figure 1, glass placed on the top of the PZT) at the ultrasound transducer frequency of 97.5 kHz, with driving voltages of 10 Vpp, 15 Vpp, 20 Vpp, 25 Vpp, and 30 Vpp for 10 min of operation, respectively. The values of current flowing through the transducer corresponding to driving voltages of 10 Vpp, 15 Vpp, 20 Vpp, 25 Vpp, and 30 Vpp, respectively, were also recorded. (B) Measurement of substrate temperature changes in three regions at 1-min intervals at an ultrasound transducer frequency of 97.5 kHz and a drive voltage of 30 Vpp. (C,D) Temperature comparison between a human finger and the transducer during acoustic operation.
FIGURE 7
FIGURE 7
(A) Observation of the state of cells unaffected by ultrasound, emitting green fluorescence under FDA staining reagent, the cells were viable and evenly distributed in the microchannel. (B) Three-dimensional array of microbubbles oscillated traps nearby cells around the microbubbles and emitted green fluorescence under FDA staining reagent, indicating that the cells were still viable. (C) Cell clusters in the action of three-dimensional array of microbubbles oscillated, emitting red fluorescence under PI stain. (D) The merged fluorescence images show that three-dimensional array of microbubbles oscillation allows the cell clusters to obtain high sonoporation efficiency. (E) Percentage of living cells as a function of ultrasound exposure time at different voltages. (F) Sonoporation efficiency as a function of ultrasound exposure time at different voltages.
FIGURE 8
FIGURE 8
Cell staining experiments were performed on cells in the presence of microbubbles, ultrasound, and microbubble + ultrasound. When only microbubbles were present, all cells fluoresced green, and no red fluorescing cells were observed. When only ultrasound was used, 95.3 %± 1.6% of the cells fluoresced green and 4.7 %± 1.6% fluoresced red. When both ultrasound and microbubbles were present, 85.0 %± 1.3% of the cells fluoresced green and 92.2 %± 2.2% fluoresced red.

Similar articles

References

    1. Adamo A., Jensen K. F. (2008). Microfluidic based single cell microinjection. Lab a Chip 8, 1258–1261. 10.1039/b803212b - DOI - PubMed
    1. Aghaamoo M., Chen Y.-H., Li X., Garg N., Jiang R., Yun J. T.-H., et al. (2022). High-throughput and dosage-controlled intracellular delivery of large cargos by an acoustic-electric micro-vortices platform. Adv. Sci. 9, 2102021. 10.1002/advs.202102021 - DOI - PMC - PubMed
    1. Azmin M., Harfield C., Ahmad Z., Edirisinghe M., Stride E. (2012). How do microbubbles and ultrasound interact? basic physical, dynamic and engineering principles. Curr. Pharm. Des. 18, 2118–2134. 10.2174/138161212800099955 - DOI - PubMed
    1. Birkin P. R., Offin D. G., Vian C. J., Leighton T. G., Maksimov A. O. (2011). Investigation of noninertial cavitation produced by an ultrasonic horn. J. Acoust. Soc. Am. 130, 3297–3308. 10.1121/1.3650537 - DOI - PubMed
    1. Carugo D., Owen J., Crake C., Lee J. Y., Stride E. (2015). Biologically and acoustically compatible chamber for studying ultrasound-mediated delivery of therapeutic compounds. Ultrasound Med. Biol. 41, 1927–1937. 10.1016/j.ultrasmedbio.2015.03.020 - DOI - PubMed

LinkOut - more resources