

Application of transfer learning for rapid calibration of spatially resolved diffuse reflectance probes for extraction of tissue optical properties
- PMID: 38419753
- PMCID: PMC10901350
- DOI: 10.1117/1.JBO.29.2.027004
Application of transfer learning for rapid calibration of spatially resolved diffuse reflectance probes for extraction of tissue optical properties
Abstract
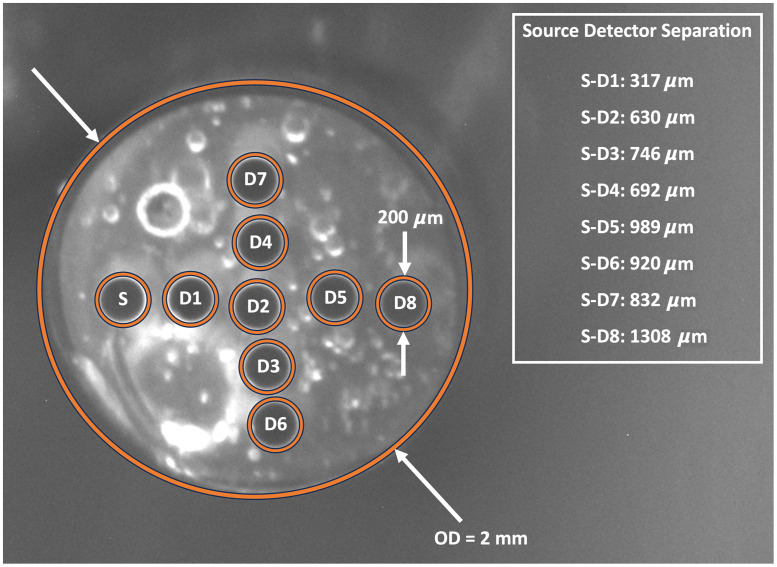
Significance: Treatment planning for light-based therapies including photodynamic therapy requires tissue optical property knowledge. This is recoverable with spatially resolved diffuse reflectance spectroscopy (DRS) but requires precise source-detector separation (SDS) determination and time-consuming simulations.
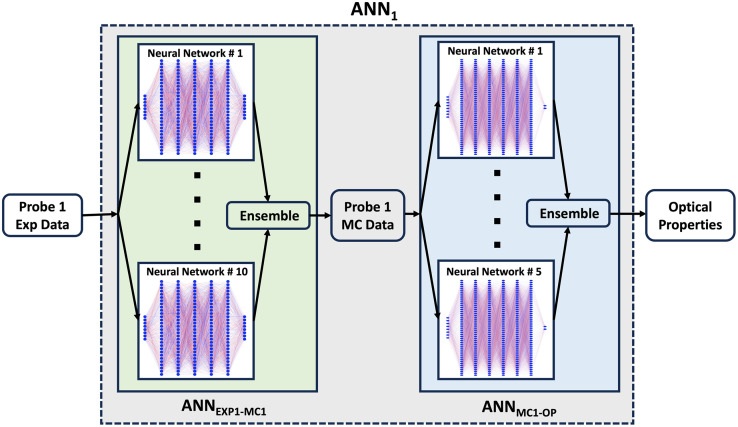
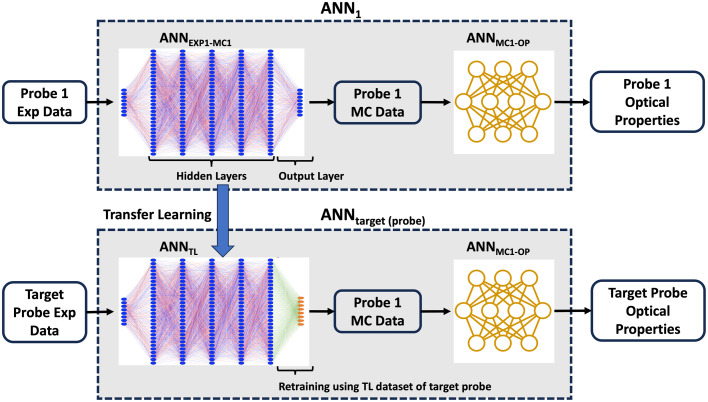
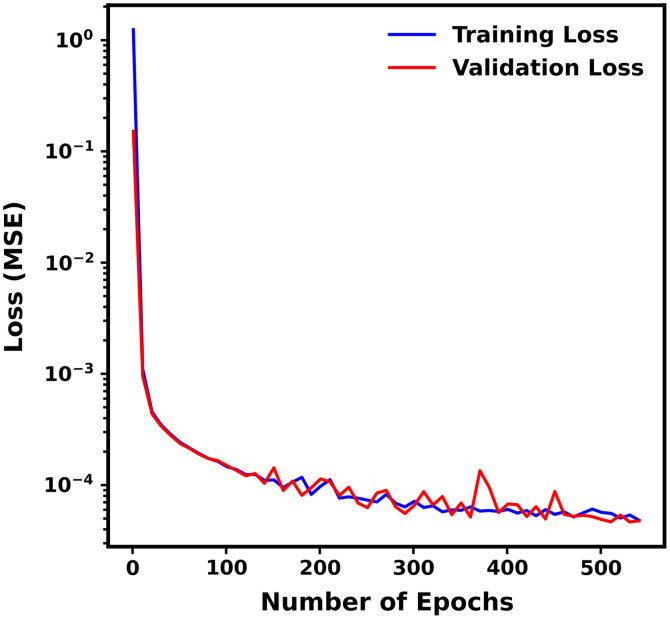
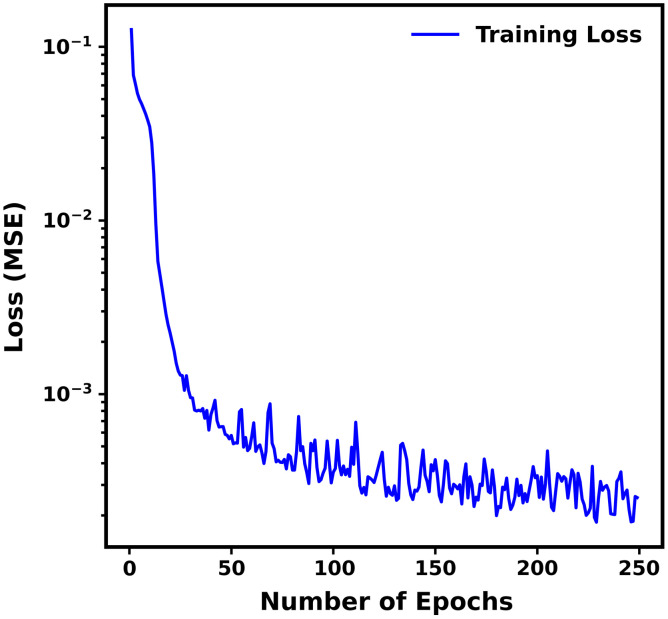
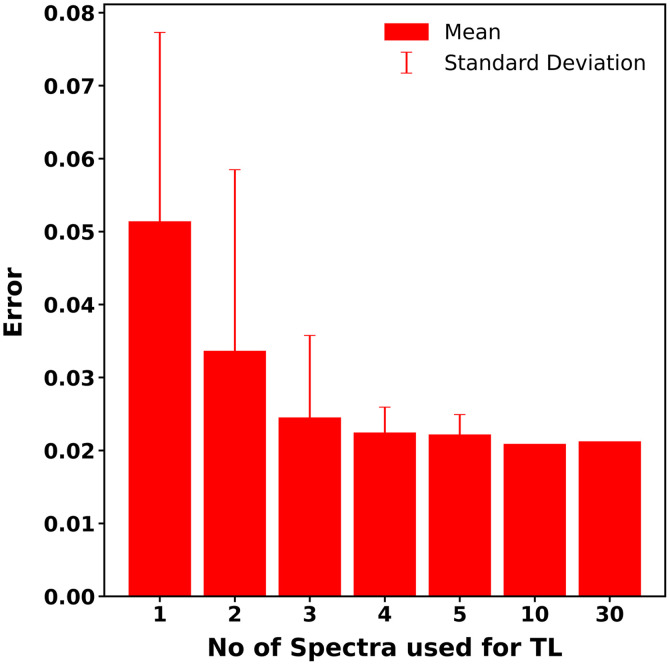
Aim: An artificial neural network (ANN) to map from DRS at multiple SDS to optical properties was created. This trained ANN was adapted to fiber-optic probes with varying SDS using transfer learning (TL).
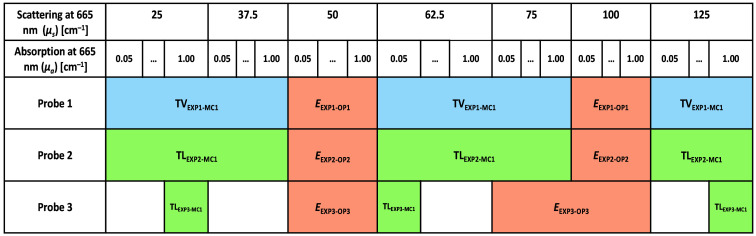
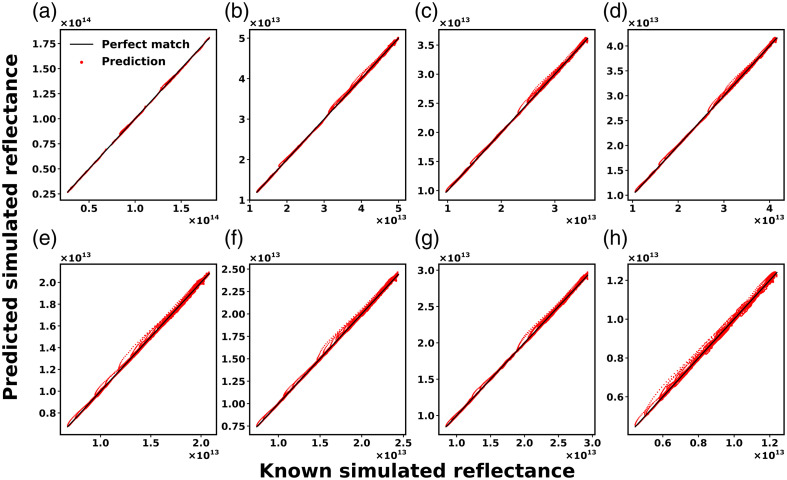
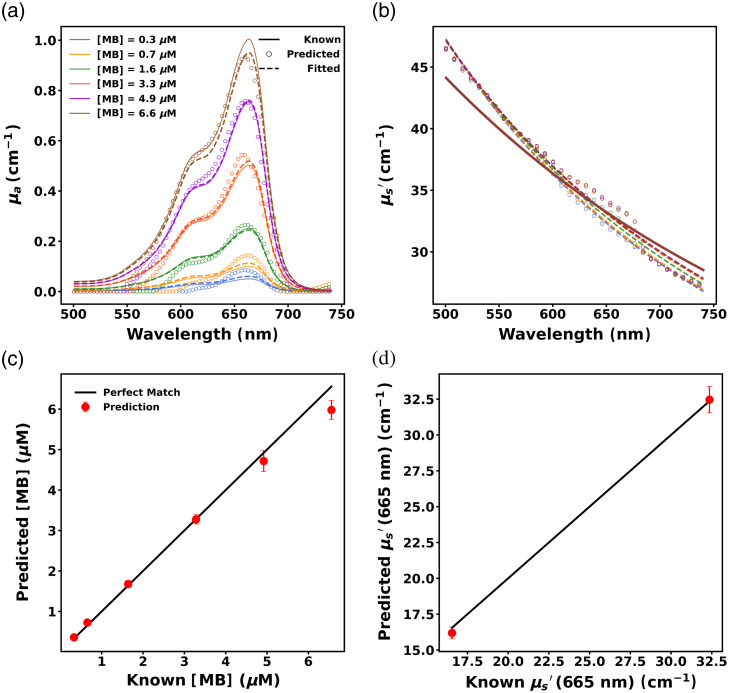
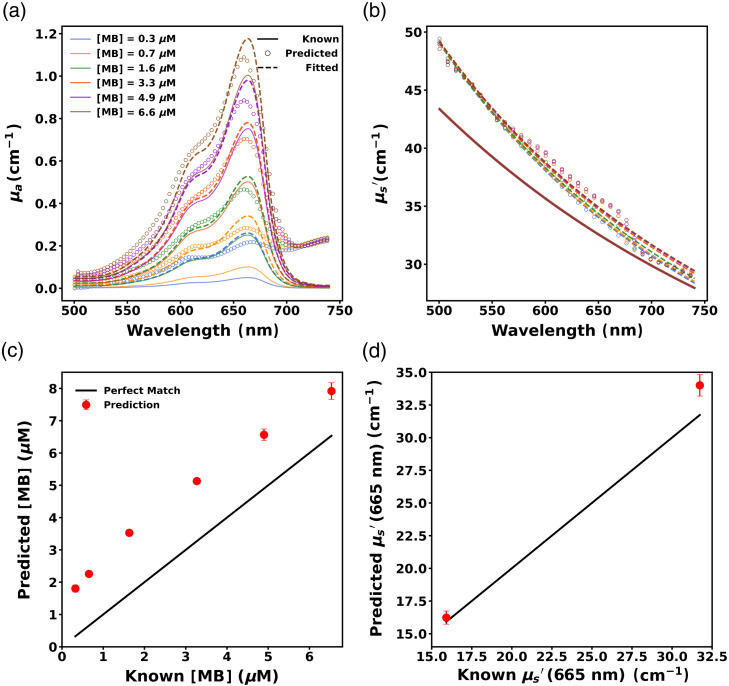
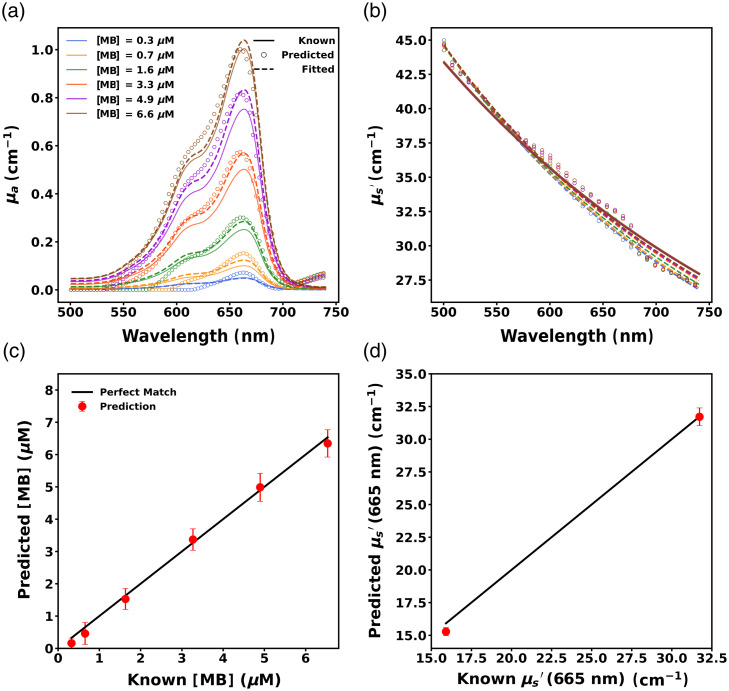
Approach: An ANN mapping from measurements to Monte Carlo simulation to optical properties was created with one fiber-optic probe. A second probe with different SDS was used for TL algorithm creation. Data from a third were used to test this algorithm.
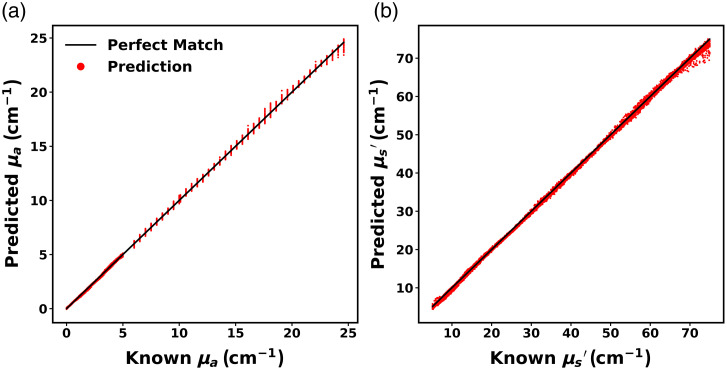
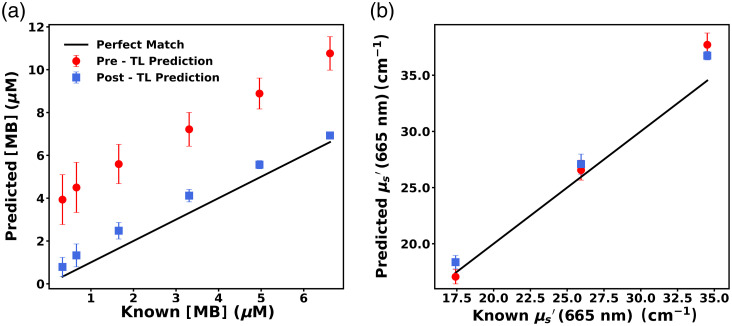
Results: The initial ANN recovered absorber concentration with (7.5% mean error) and at 665 nm () with (2.5% mean error). For probe 2, TL significantly improved absorber concentration (0.38 versus RMSE, ) and (0.71 versus RMSE, ) recovery. A third probe also showed improved absorber (0.7 versus RMSE, ) and (1.68 versus RMSE, ) recovery.
Conclusions: TL-based probe-to-probe calibration can rapidly adapt an ANN created for one probe to similar target probes, enabling accurate optical property recovery with the target probe.
Keywords: Monte Carlo simulation; diffuse reflectance spectroscopy; machine learning; neural network; transfer learning.
© 2024 The Authors.
Figures
Update of
-
Application of Transfer Learning for Rapid Calibration of Spatially-resolved Diffuse Reflectance Probes for Extraction of Tissue Optical Properties.bioRxiv [Preprint]. 2023 Nov 5:2023.10.23.563629. doi: 10.1101/2023.10.23.563629. bioRxiv. 2023. Update in: J Biomed Opt. 2024 Feb;29(2):027004. doi: 10.1117/1.JBO.29.2.027004. PMID: 37961112 Free PMC article. Updated. Preprint.
Similar articles
-
Application of Transfer Learning for Rapid Calibration of Spatially-resolved Diffuse Reflectance Probes for Extraction of Tissue Optical Properties.bioRxiv [Preprint]. 2023 Nov 5:2023.10.23.563629. doi: 10.1101/2023.10.23.563629. bioRxiv. 2023. Update in: J Biomed Opt. 2024 Feb;29(2):027004. doi: 10.1117/1.JBO.29.2.027004. PMID: 37961112 Free PMC article. Updated. Preprint.
-
Designing a use-error robust machine learning model for quantitative analysis of diffuse reflectance spectra.J Biomed Opt. 2024 Jan;29(1):015001. doi: 10.1117/1.JBO.29.1.015001. Epub 2024 Jan 11. J Biomed Opt. 2024. PMID: 38213471 Free PMC article.
-
Evaluation of a fiberoptic-based system for measurement of optical properties in highly attenuating turbid media.Biomed Eng Online. 2006 Aug 23;5:49. doi: 10.1186/1475-925X-5-49. Biomed Eng Online. 2006. PMID: 16928274 Free PMC article.
-
Monitoring of tissue optical properties during thermal coagulation of ex vivo tissues.Lasers Surg Med. 2016 Sep;48(7):686-94. doi: 10.1002/lsm.22541. Epub 2016 Jun 1. Lasers Surg Med. 2016. PMID: 27250022
-
Optical property recovery with spatially-resolved diffuse reflectance at short source-detector separations using a compact fiber-optic probe.Biomed Opt Express. 2021 Nov 9;12(12):7388-7404. doi: 10.1364/BOE.443332. eCollection 2021 Dec 1. Biomed Opt Express. 2021. PMID: 35003841 Free PMC article.
Cited by
-
Devices and Methods for Dosimetry of Personalized Photodynamic Therapy of Tumors: A Review on Recent Trends.Cancers (Basel). 2024 Jul 8;16(13):2484. doi: 10.3390/cancers16132484. Cancers (Basel). 2024. PMID: 39001546 Free PMC article. Review.
References
-
- Baran T. M., et al. , “Photodynamic therapy is a safe and feasible adjunct to percutaneous drainage of deep tissue abscesses: results of a first in humans phase 1 clinical trial,” medRxiv 2023.10.16.23297086 (2023).
Publication types
MeSH terms
Grants and funding
LinkOut - more resources
Full Text Sources
Research Materials
