

Protective Effects of Red Ginseng Against Tacrine-Induced Hepatotoxicity: An Integrated Approach with Network Pharmacology and Experimental Validation
- PMID: 38419811
- PMCID: PMC10900653
- DOI: 10.2147/DDDT.S450305
Protective Effects of Red Ginseng Against Tacrine-Induced Hepatotoxicity: An Integrated Approach with Network Pharmacology and Experimental Validation
Abstract
Introduction: Tacrine, an FDA-approved acetylcholinesterase inhibitor, has shown efficacy in treating Alzheimer's disease, but its clinical use is limited by hepatotoxicity. This study investigates the protective effects of red ginseng against tacrine-induced hepatotoxicity, focusing on oxidative stress.
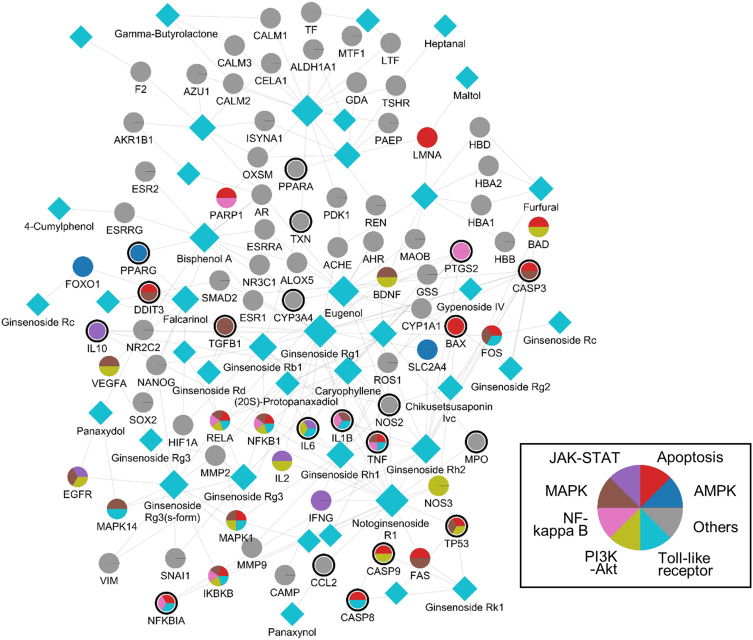
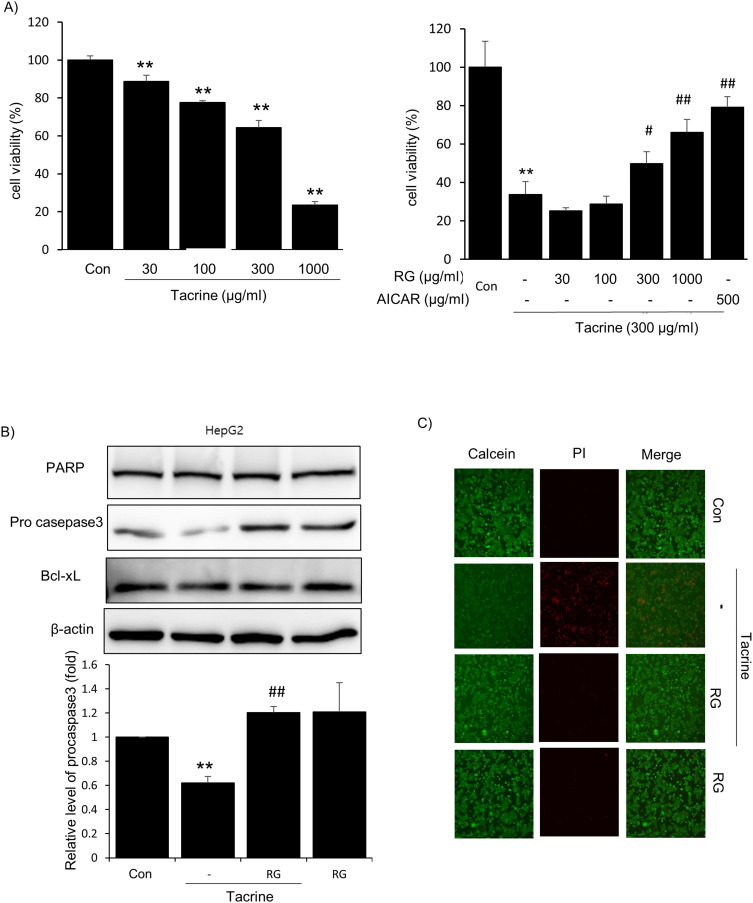
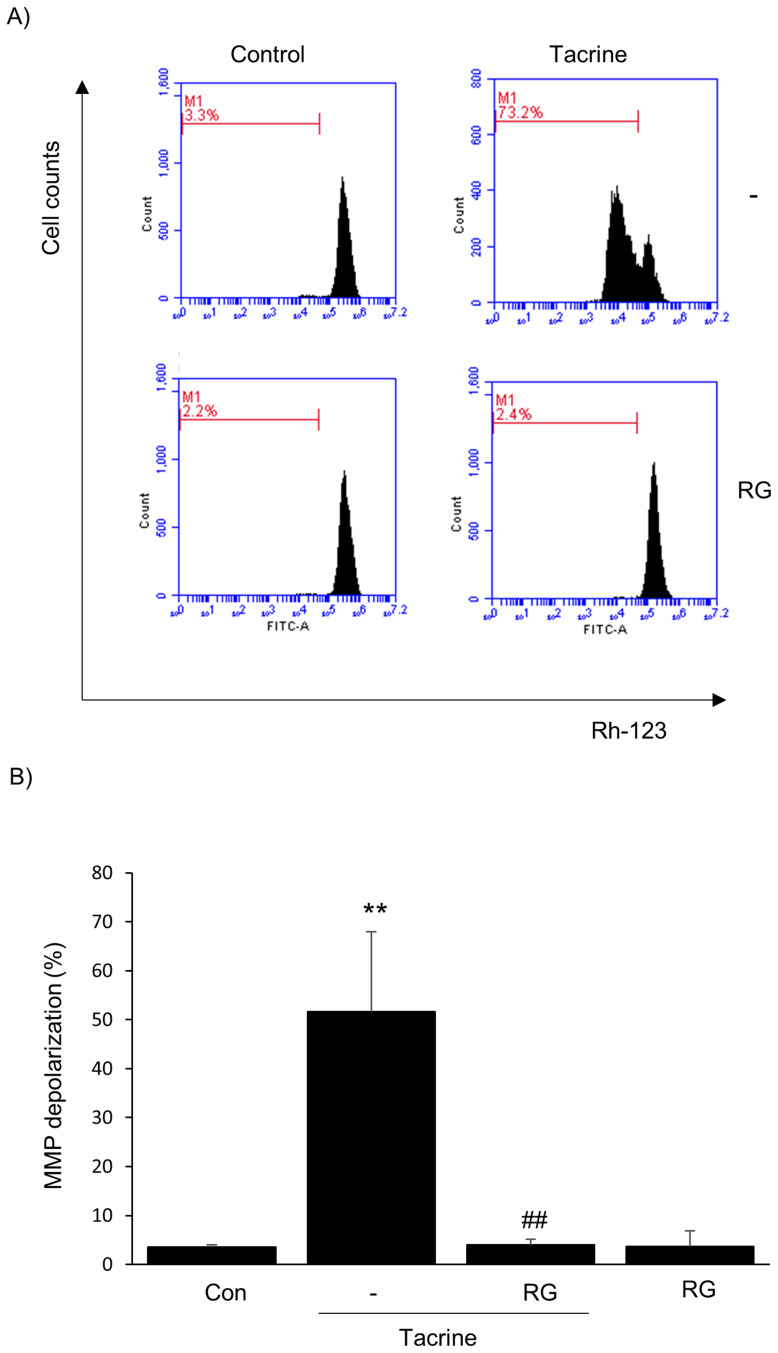
Methods: A network depicting the interaction between compounds and targets was constructed for RG. Effect of RG was determined by MTT and FACS analysis with cells stained by rhodamine 123. Proteins were extracted and subjected to immunoblotting for apoptosis-related proteins.
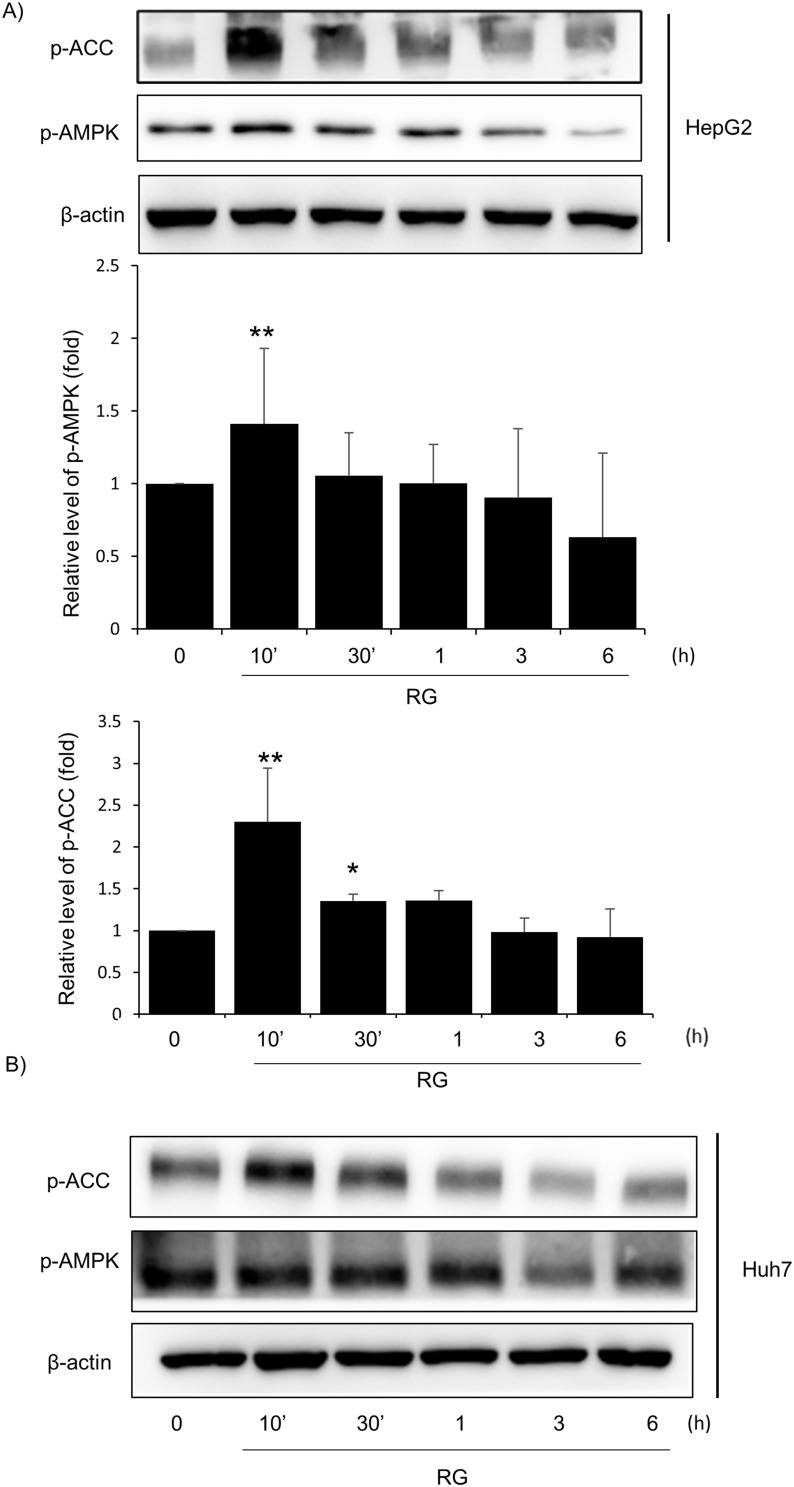
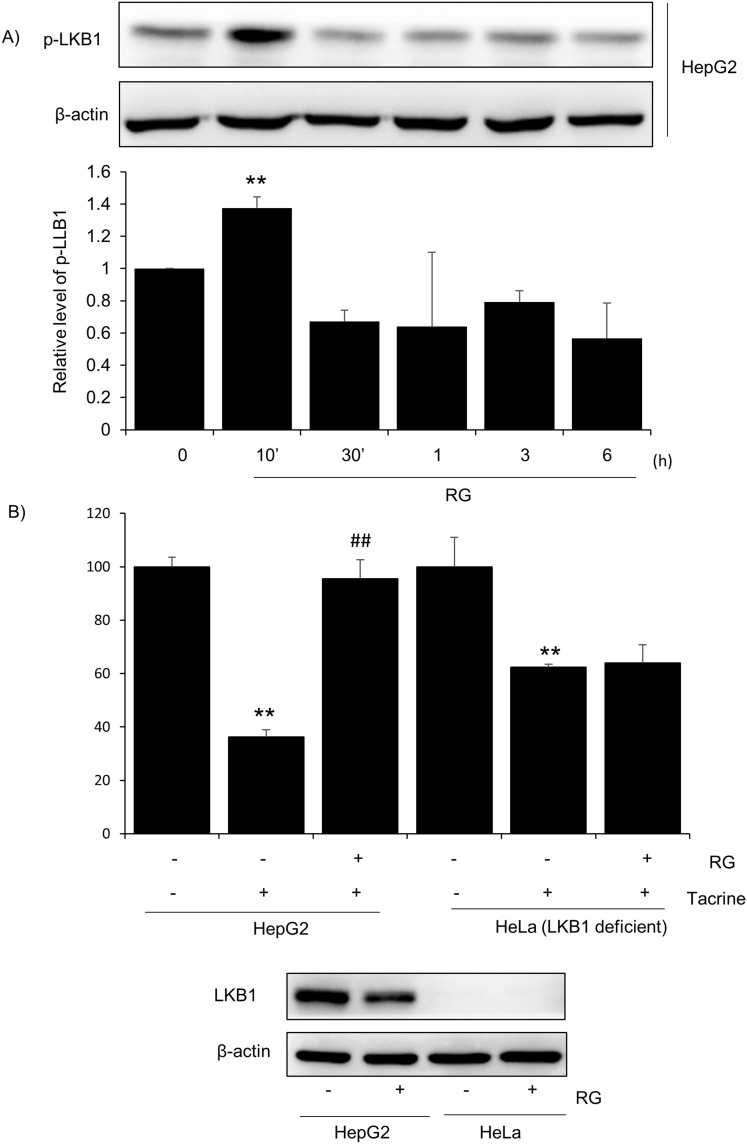
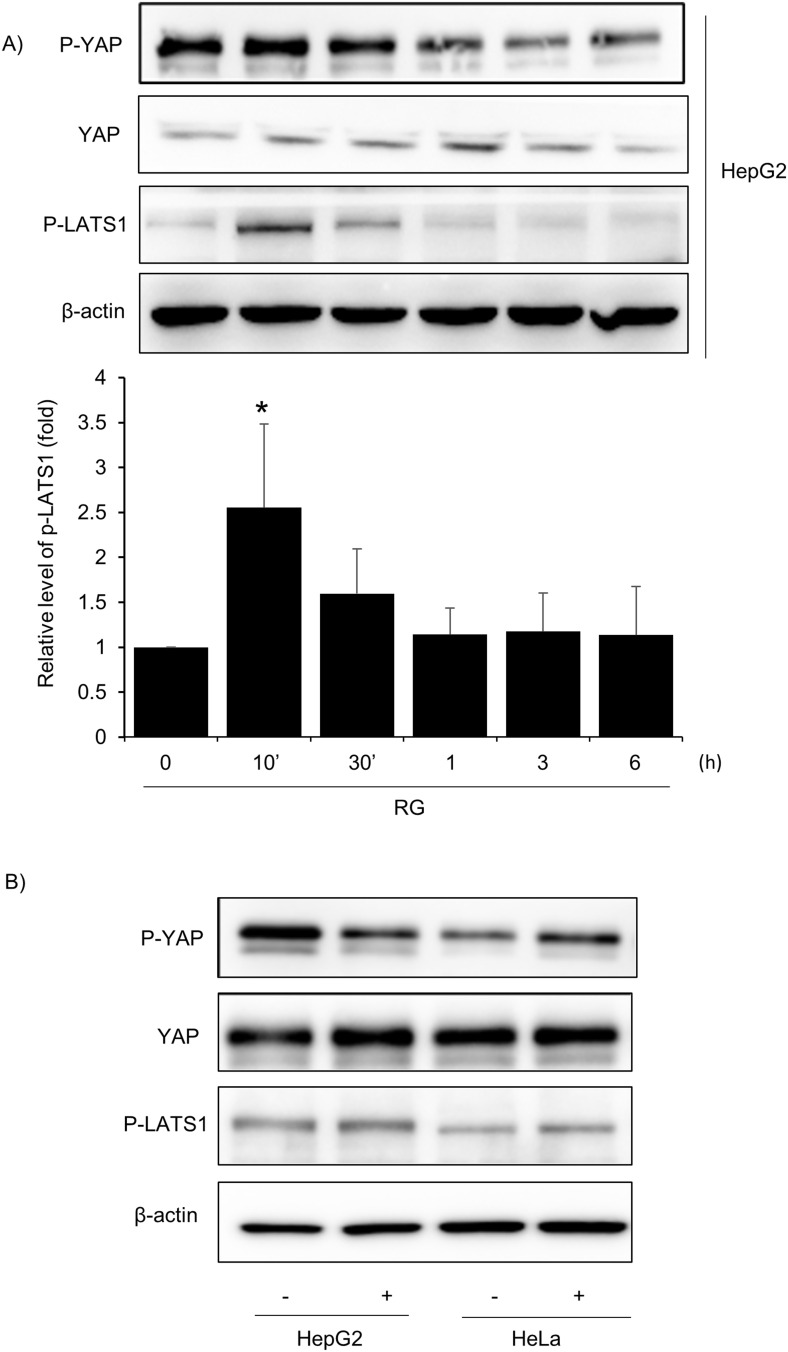
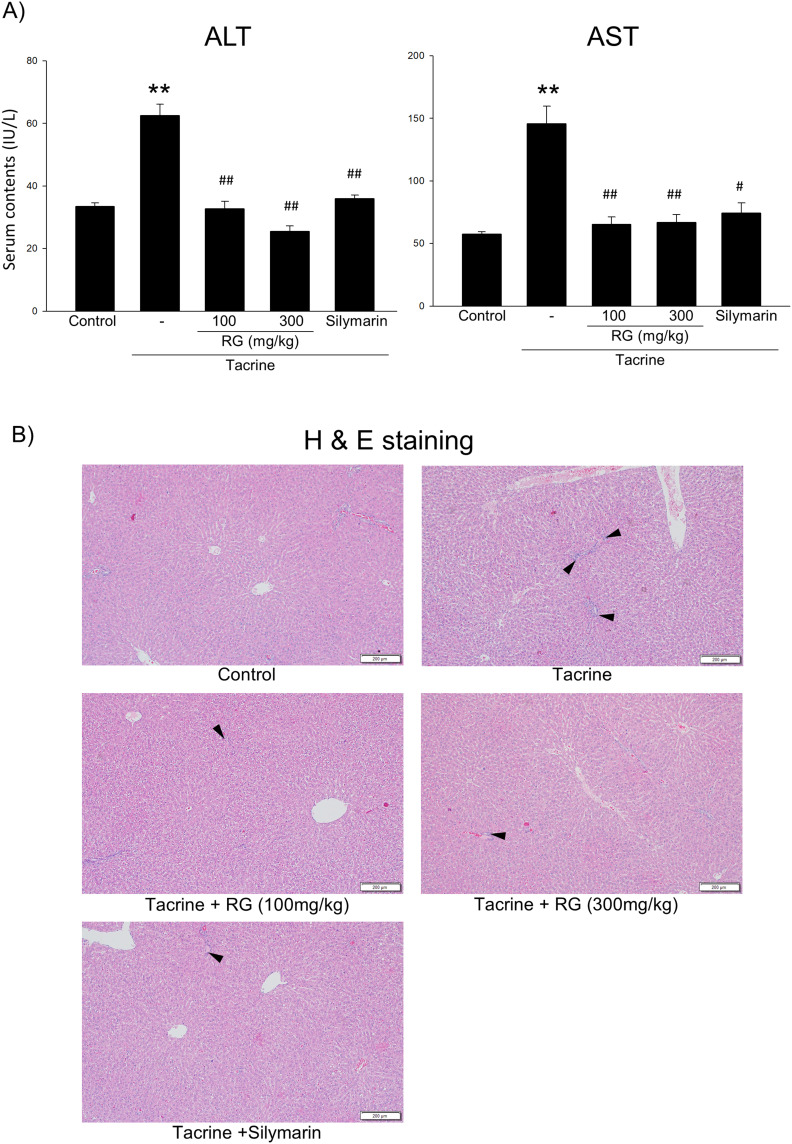
Results: The outcomes of the network analysis revealed a significant association, with 20 out of 82 identified primary RG targets aligning with those involved in oxidative liver damage including notable interactions within the AMPK pathway. in vitro experiments showed that RG, particularly at 1000μg/mL, mitigated tacrine-induced apoptosis and mitochondrial damage, while activating the LKB1-mediated AMPK pathway and Hippo-Yap signaling. In mice, RG also protected the liver injury induced by tacrine, as similar protective effects to silymarin, a well-known drug for liver toxicity protection.
Discussion: Our study reveals the potential of RG in mitigating tacrine-induced hepatotoxicity, suggesting the administration of natural products like RG to reduce toxicity in Alzheimer's disease treatment.
Keywords: AMPK; liver toxicity; oxidative stress; red ginseng; tacrine.
© 2024 Kim et al.
Conflict of interest statement
The authors report no conflicts of interest in this work.
Figures
Similar articles
-
Rosmarinic acid potentiates and detoxifies tacrine in combination for Alzheimer's disease.Phytomedicine. 2023 Jan;109:154600. doi: 10.1016/j.phymed.2022.154600. Epub 2022 Dec 11. Phytomedicine. 2023. PMID: 36610144
-
Design, synthesis and evaluation of OA-tacrine hybrids as cholinesterase inhibitors with low neurotoxicity and hepatotoxicity against Alzheimer's disease.J Enzyme Inhib Med Chem. 2023 Dec;38(1):2192439. doi: 10.1080/14756366.2023.2192439. J Enzyme Inhib Med Chem. 2023. PMID: 36950955 Free PMC article.
-
Tacrine-Based Hybrids: Past, Present, and Future.Int J Mol Sci. 2023 Jan 15;24(2):1717. doi: 10.3390/ijms24021717. Int J Mol Sci. 2023. PMID: 36675233 Free PMC article. Review.
-
Computational design of new tacrine analogs: an in silico prediction of their cholinesterase inhibitory, antioxidant, and hepatotoxic activities.J Biomol Struct Dyn. 2023 Jan;41(1):91-105. doi: 10.1080/07391102.2021.2004232. Epub 2021 Nov 26. J Biomol Struct Dyn. 2023. PMID: 34825629
-
Therapeutic Potential of Multifunctional Tacrine Analogues.Curr Neuropharmacol. 2019;17(5):472-490. doi: 10.2174/1570159X16666180412091908. Curr Neuropharmacol. 2019. PMID: 29651948 Free PMC article. Review.
Cited by
-
Network Pharmacology and Experimental Validation Reveal Therapeutic Potential of Propolis in UV-Induced Allergic Dermatitis.Foods. 2025 Mar 14;14(6):996. doi: 10.3390/foods14060996. Foods. 2025. PMID: 40232010 Free PMC article.
-
Will AMPK be a potential therapeutic target for hepatocellular carcinoma?Am J Cancer Res. 2024 Jul 15;14(7):3241-3258. doi: 10.62347/YAVK1315. eCollection 2024. Am J Cancer Res. 2024. PMID: 39113872 Free PMC article. Review.
-
Cholesterol-modulating effects of Korean red ginseng (KRG) targeting PCSK9 in hyperlipidemia.Sci Rep. 2025 Aug 20;15(1):30637. doi: 10.1038/s41598-025-15863-3. Sci Rep. 2025. PMID: 40836000 Free PMC article.
References
-
- Patterson C. World Alzheimer report 2018. 2018.;
MeSH terms
Substances
LinkOut - more resources
Full Text Sources
Medical
