

Correlation analysis of diabetes based on Copula
- PMID: 38419954
- PMCID: PMC10899488
- DOI: 10.3389/fendo.2024.1291895
Correlation analysis of diabetes based on Copula
Abstract
Introduction: The ratio of Triglyceride (TG) to high-density lipoprotein cholesterol (HDL-C) is a crucial indicator for diabetes diagnosis.
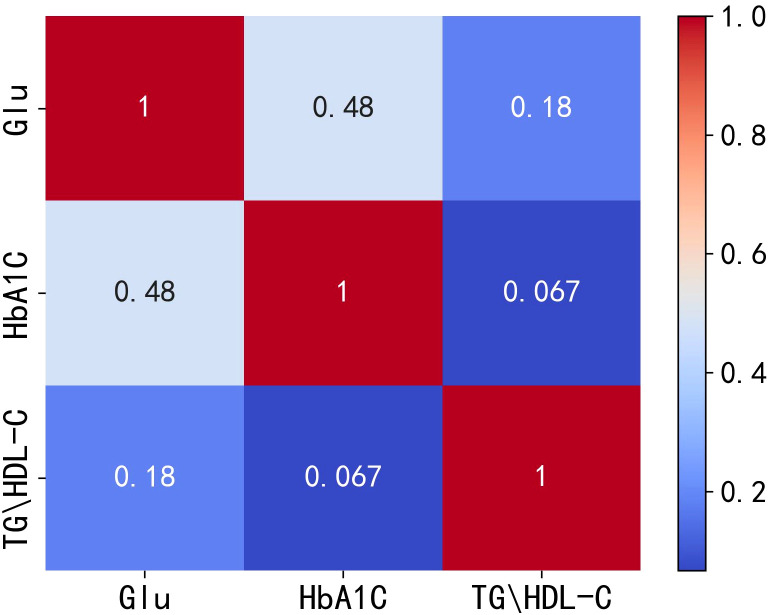
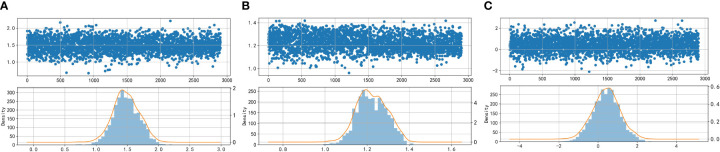
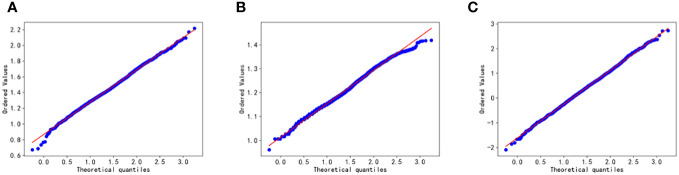
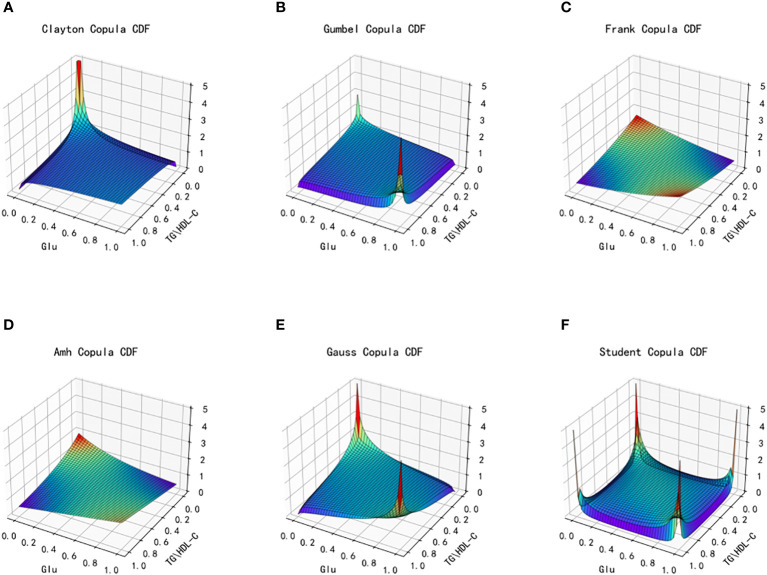
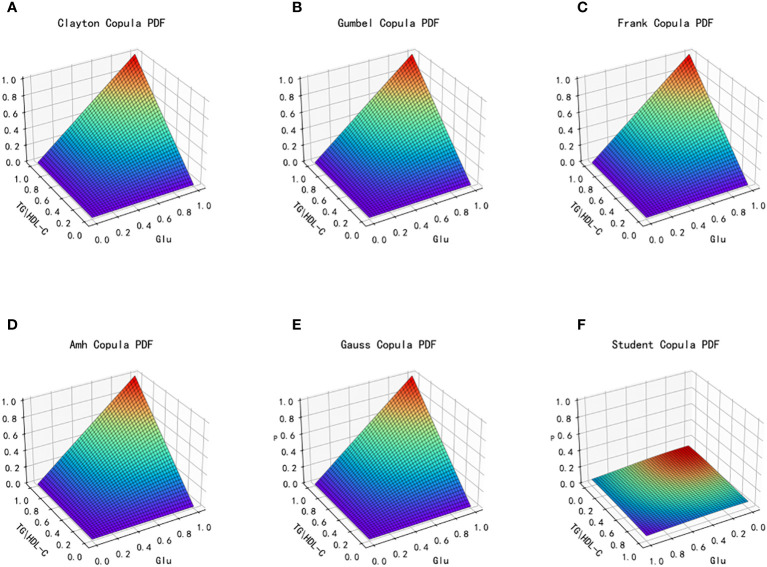
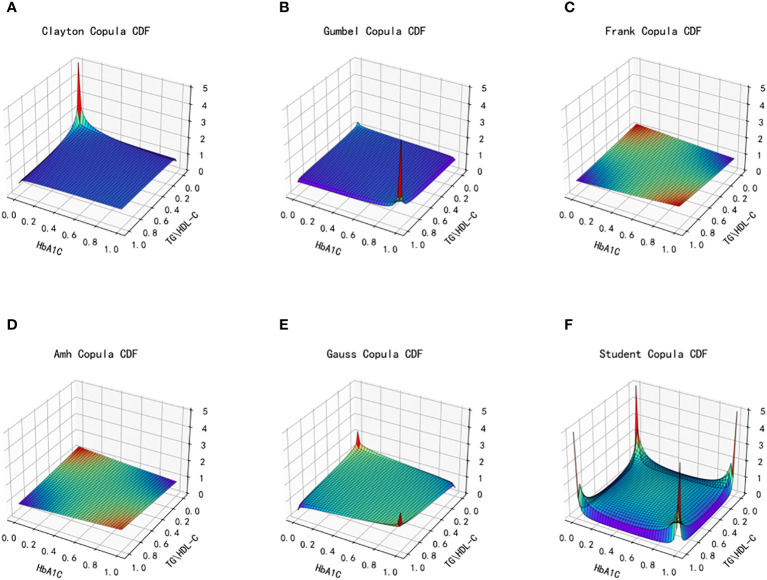
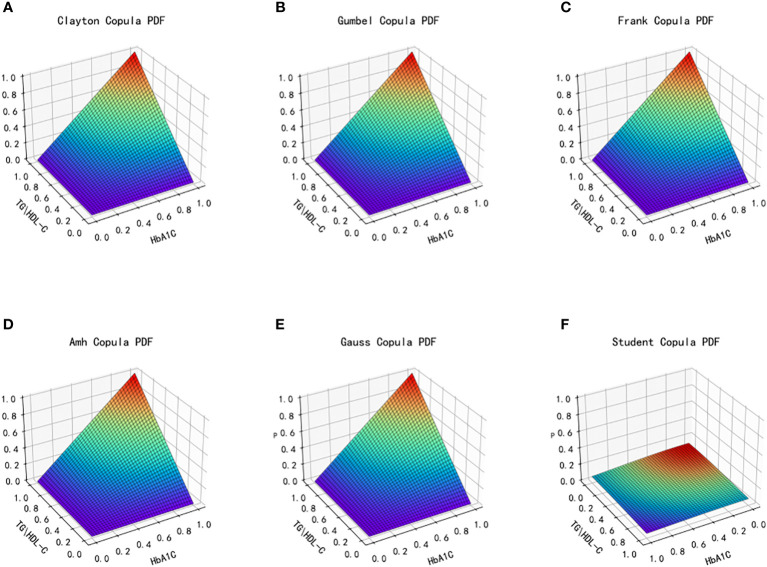
Methods: This study utilizes the Copula function to model and fit the non-linear correlation among fasting blood glucose (Glu), glycosylated hemoglobin (HbA1C), and TG/HDL-C in patients with diabetes. The Copula function chosen for this study includes the two-dimensional Archimedes and Elliptical distribution family, as well as the multidimensional Vine Copula function, for fitting the data. The evaluation of the fitting effect is performed using the mean absolute error (MAE) and mean square error (MSE).
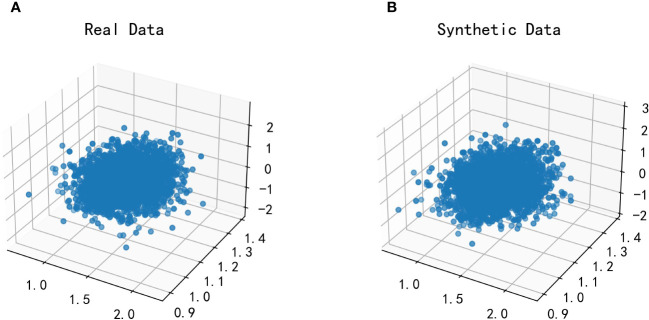
Results: The results indicate that the Clayton Copula exhibits the highest effectiveness in fitting the pairwise relationship between Glu and TG/HDL-C, as well as HbA1C and TG/HDL-C, displaying the smallest fitting error. Additionally, the Vine Copula function produces a satisfactory fit for the relationship among all three indicators. Compared to linear analysis methods, the Copula function more accurately depicts the correlation among these three types of indicators.
Discussion: Moreover, our findings indicate a stronger correlation in the lower tail between Glu and HbA1C, as well as TG/HDL-C, suggesting that the Copula function provides greater accuracy and applicability in depicting the relationship among these indicators. As a result, it can offer a more precise auxiliary diagnosis and serve as a valuable reference in clinical judgment.
Keywords: fasting blood glucose; glycosylated hemoglobin; high-density lipoprotein cholesterol; nonlinear correlation; triglyceride.
Copyright © 2024 Liu, Yang, Yang and Wang.
Conflict of interest statement
The authors declare that the research was conducted in the absence of any commercial or financial relationships that could be construed as a potential conflict of interest.
Figures
Similar articles
-
Association of Triglyceride to high-density lipoprotein cholesterol ratio and incident of diabetes mellitus: a secondary retrospective analysis based on a Chinese cohort study.Lipids Health Dis. 2020 Mar 4;19(1):33. doi: 10.1186/s12944-020-01213-x. Lipids Health Dis. 2020. PMID: 32131838 Free PMC article.
-
The Triglyceride/HDL Ratio and Triglyceride Glucose Index as Predictors of Glycemic Control in Patients with Diabetes Mellitus Type 2.Med Arch. 2019 Jun;73(3):163-168. doi: 10.5455/medarh.2019.73.163-168. Med Arch. 2019. PMID: 31404127 Free PMC article.
-
High level of individual lipid profile and lipid ratio as a predictive marker of poor glycemic control in type-2 diabetes mellitus.Vasc Health Risk Manag. 2019 Jun 5;15:149-157. doi: 10.2147/VHRM.S209830. eCollection 2019. Vasc Health Risk Manag. 2019. PMID: 31239693 Free PMC article.
-
The triglyceride to high-density lipoprotein cholesterol (TG/HDL-C) ratio as a predictor of insulin resistance but not of β cell function in a Chinese population with different glucose tolerance status.Lipids Health Dis. 2016 Jun 7;15:104. doi: 10.1186/s12944-016-0270-z. Lipids Health Dis. 2016. PMID: 27267043 Free PMC article.
-
Clinical efficacy of Huanglian Wendan decoction in treating type 2 diabetes mellitus: A systematic review and meta-analysis.Medicine (Baltimore). 2023 Oct 6;102(40):e35299. doi: 10.1097/MD.0000000000035299. Medicine (Baltimore). 2023. PMID: 37800822 Free PMC article.
References
-
- Chen Z, Hu H, Chen M, Luo X, Yao W, Liang Q, et al. . Association of triglyceride to high-density lipoprotein cholesterol ratio and incident of diabetes mellitus: a secondary retrospective analysis based on a chinese cohort study. Lipids Health Dis (2020) 19:1–11. doi: 10.1186/s12944-020-01213-x - DOI - PMC - PubMed
-
- Zheng D, Li H, Ai F, Sun F, Singh M, Cao X, et al. . Association between the triglyceride to high-density lipoprotein cholesterol ratio and the risk of type 2 diabetes mellitus among chinese elderly: the beijing longitudinal study of aging. BMJ Open Diabetes Res Care (2020) 8:e000811. doi: 10.1136/bmjdrc-2019-000811 - DOI - PMC - PubMed
Publication types
MeSH terms
Substances
LinkOut - more resources
Full Text Sources
Medical
Research Materials
Miscellaneous