. 2024 Feb 28;22(2):e8583.
doi: 10.2903/j.efsa.2024.8583. eCollection 2024 Feb.

The European Union summary report on antimicrobial resistance in zoonotic and indicator bacteria from humans, animals and food in 2021-2022

The European Union summary report on antimicrobial resistance in zoonotic and indicator bacteria from humans, animals and food in 2021-2022

European Food Safety Authority (EFSA) et al. EFSA J. .

Abstract

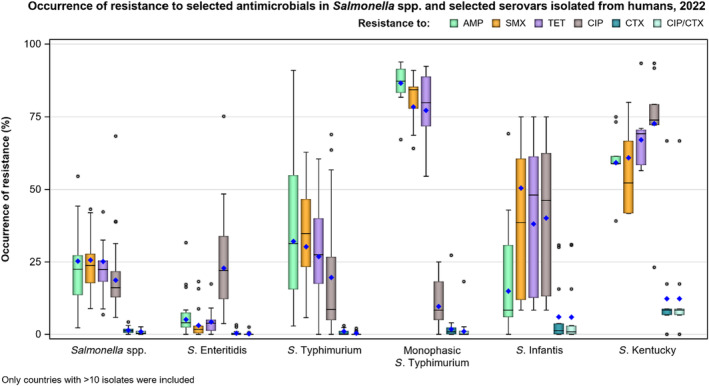
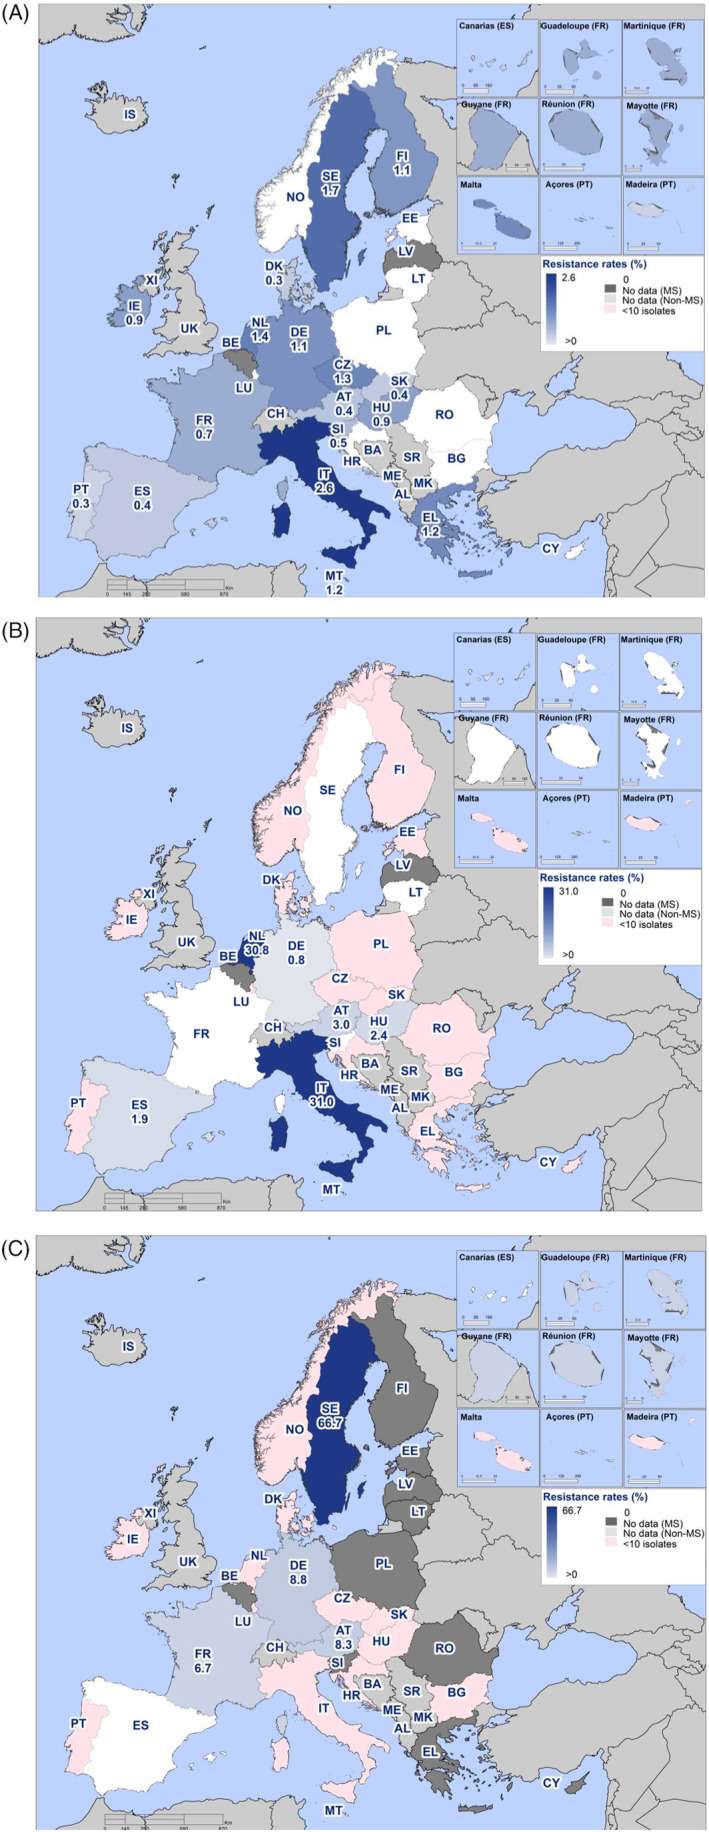
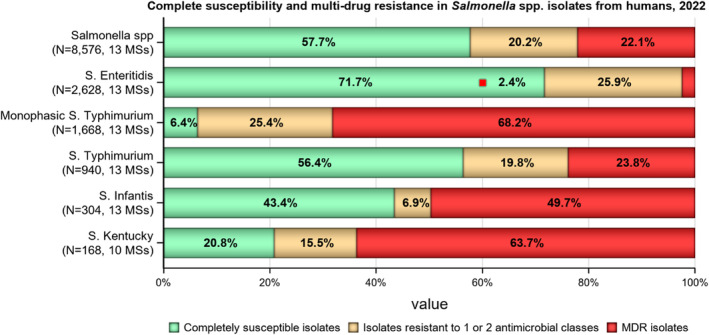
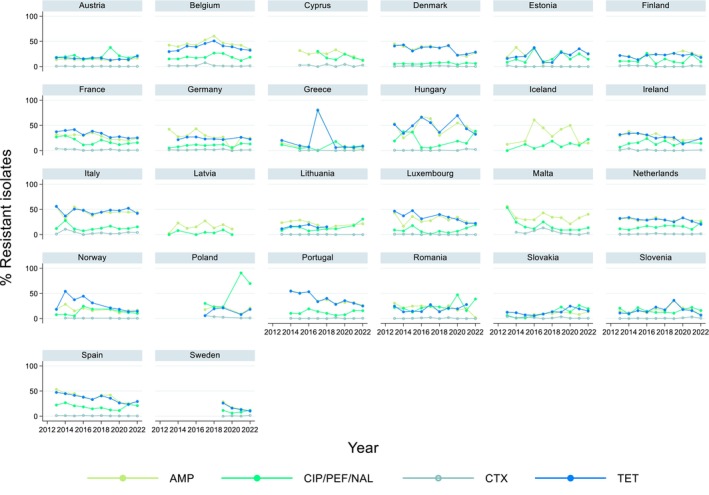
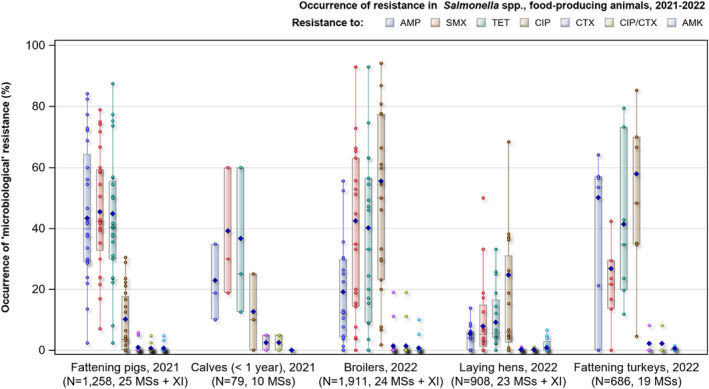
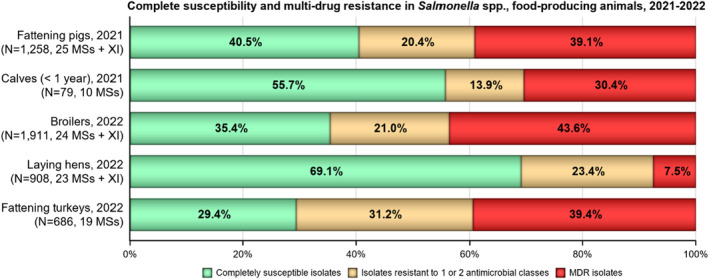
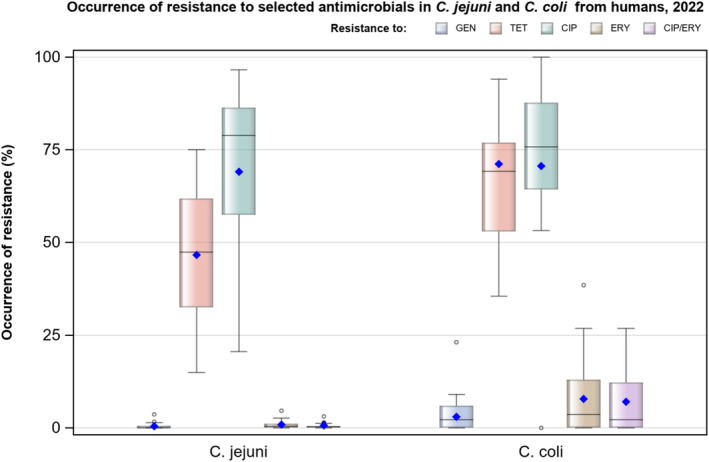
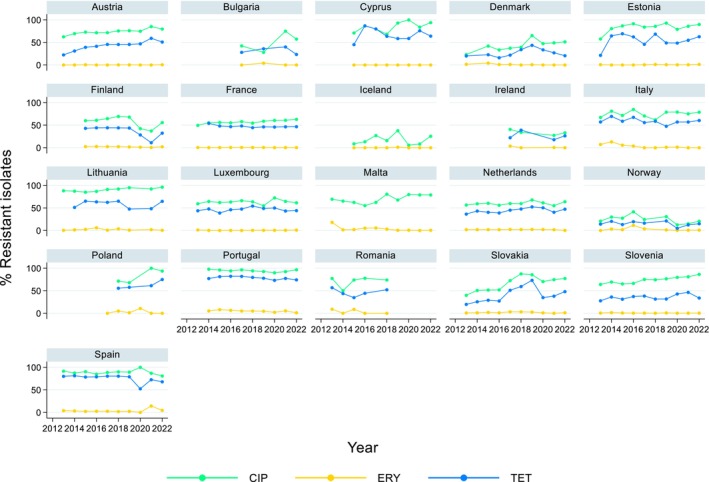
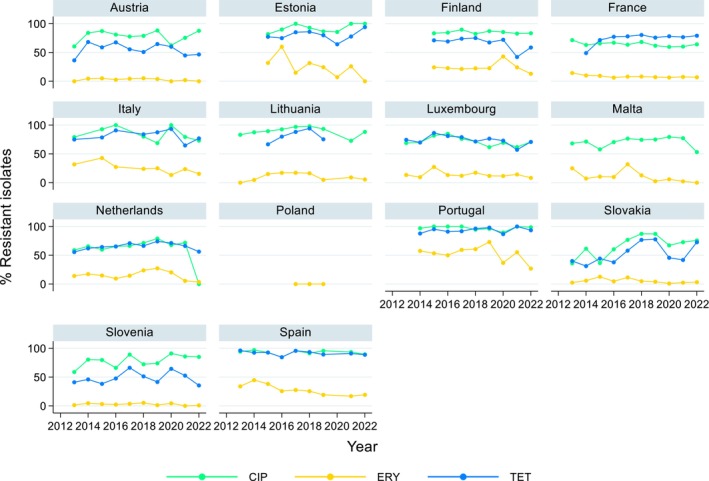
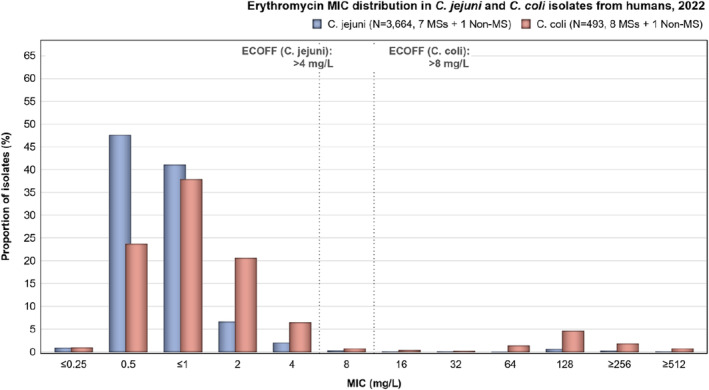
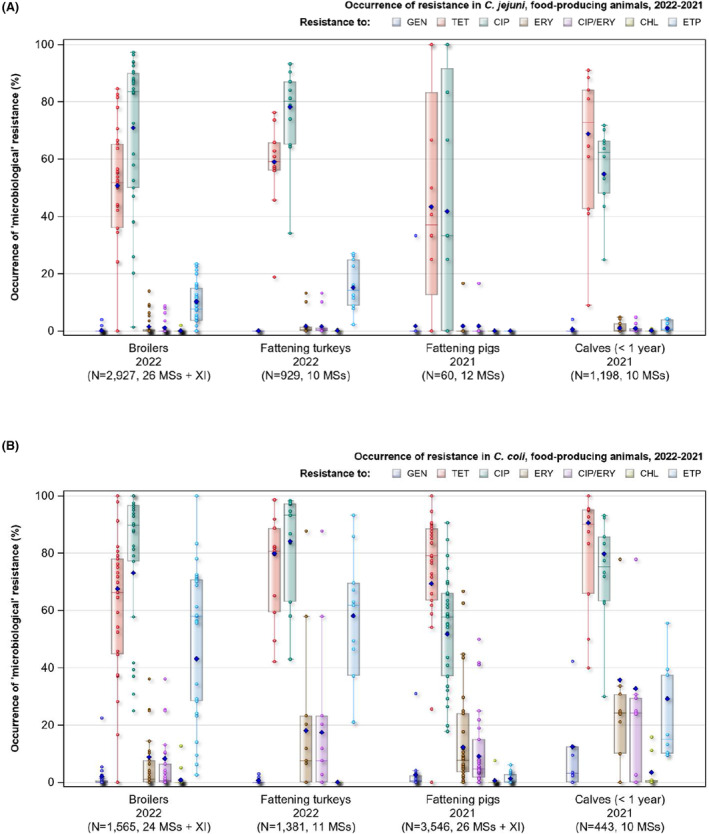
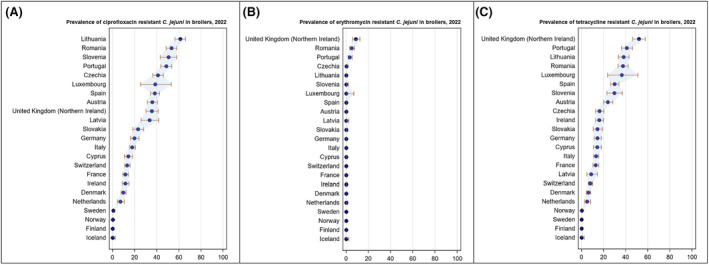
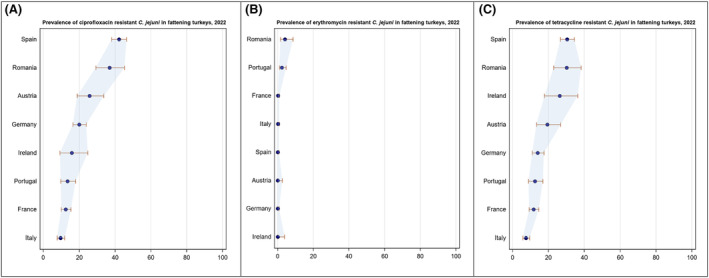
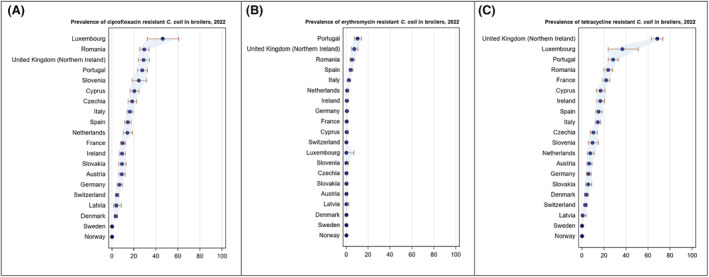
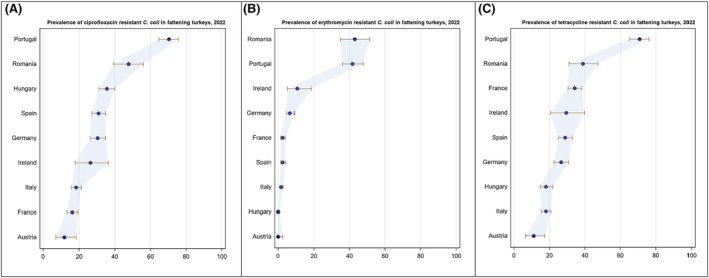
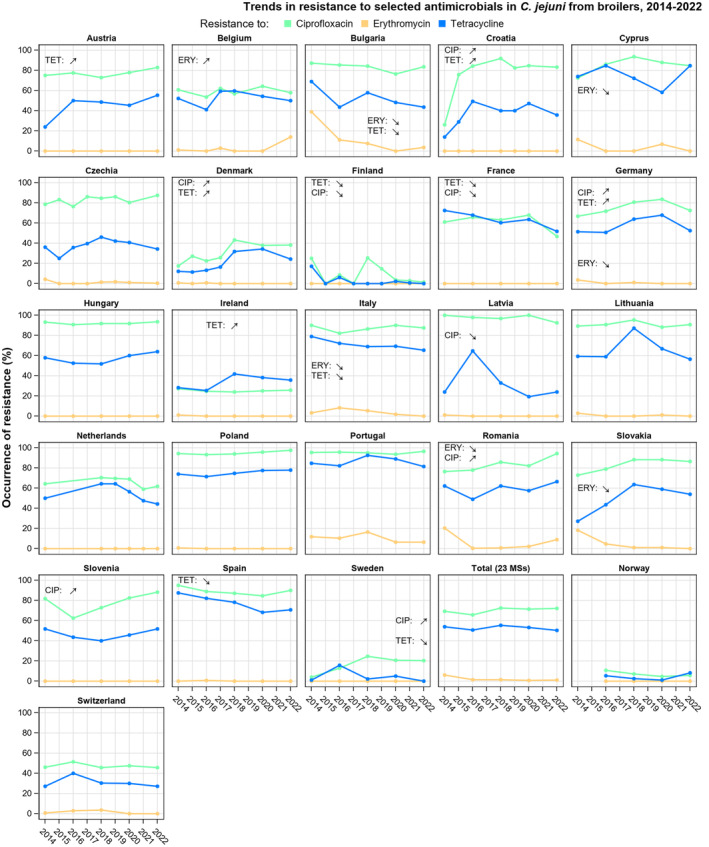
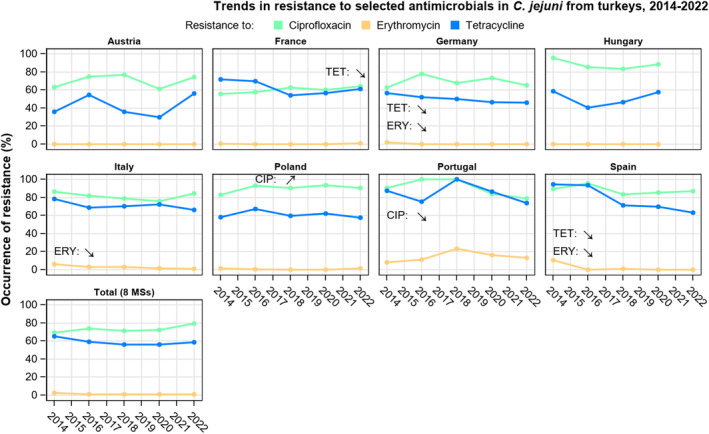
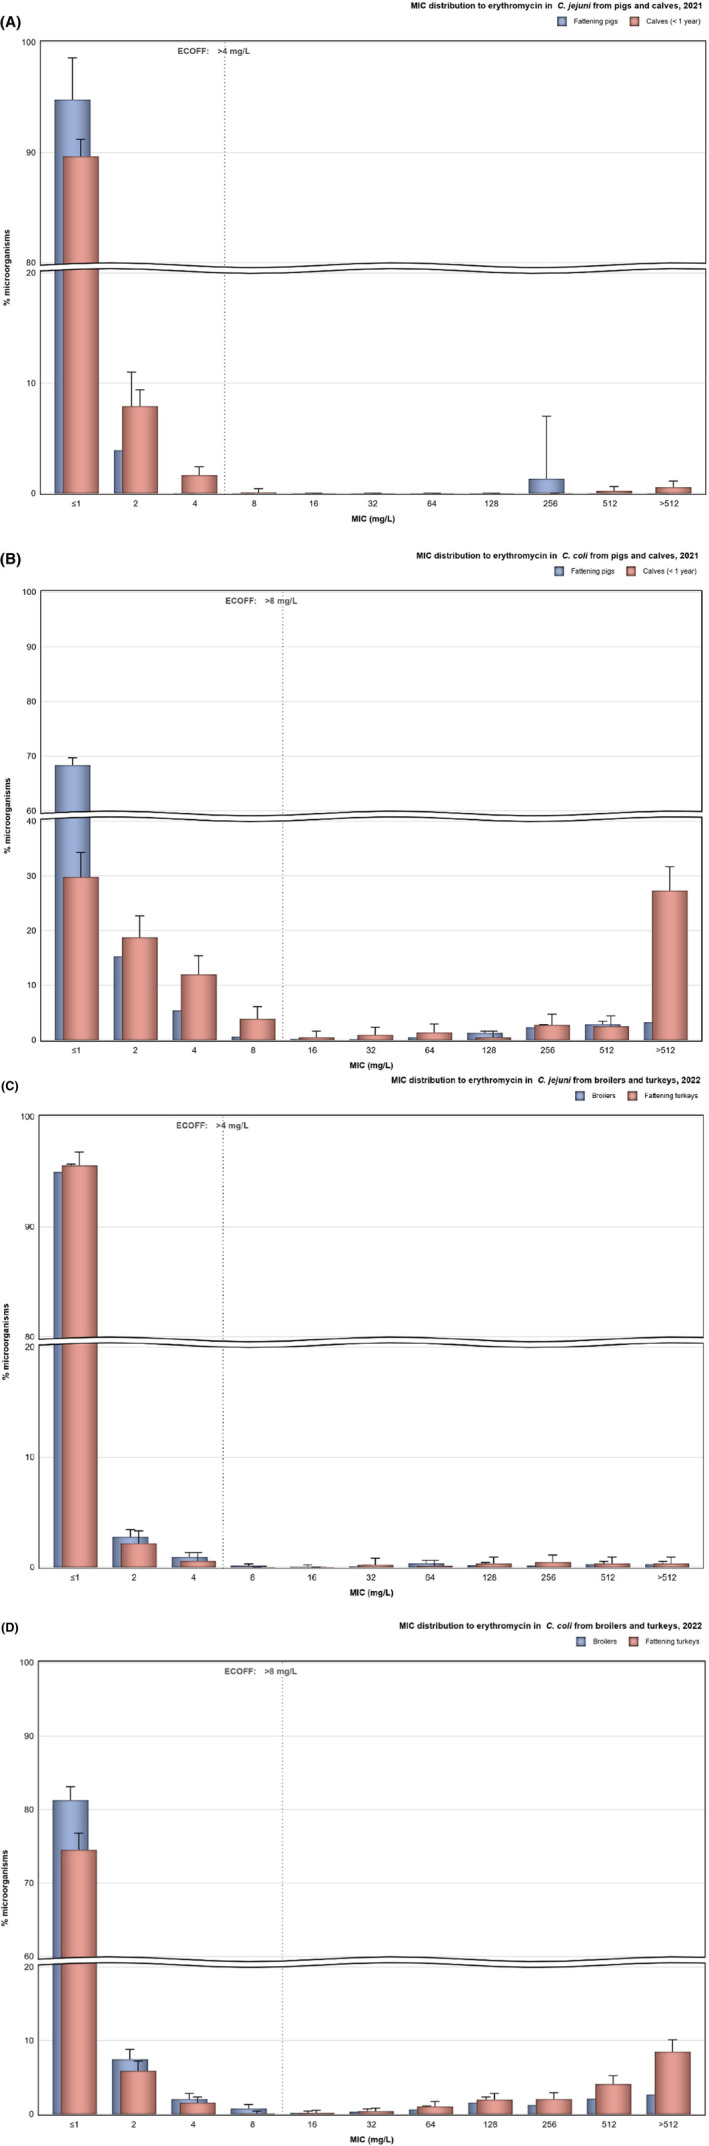
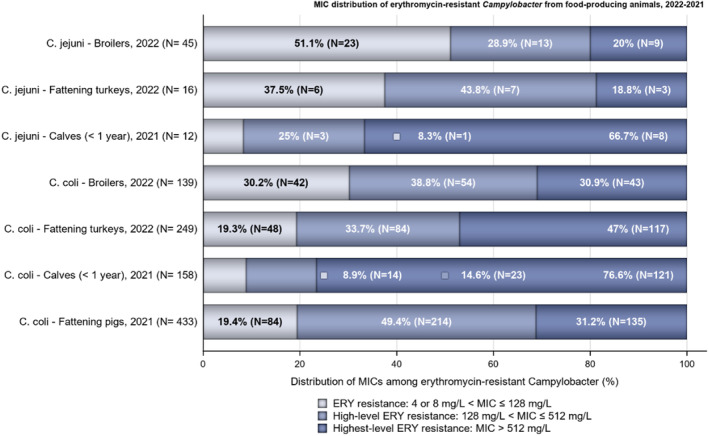
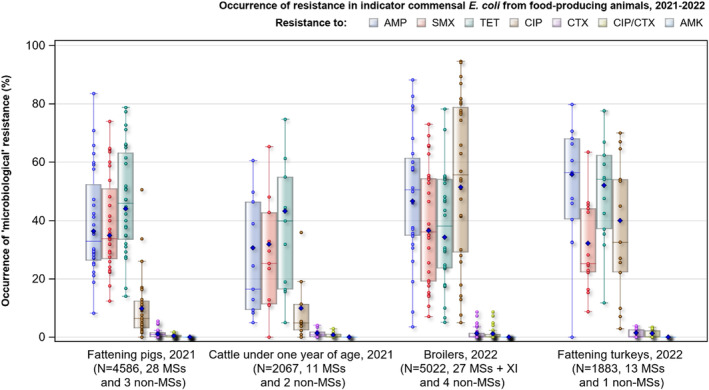
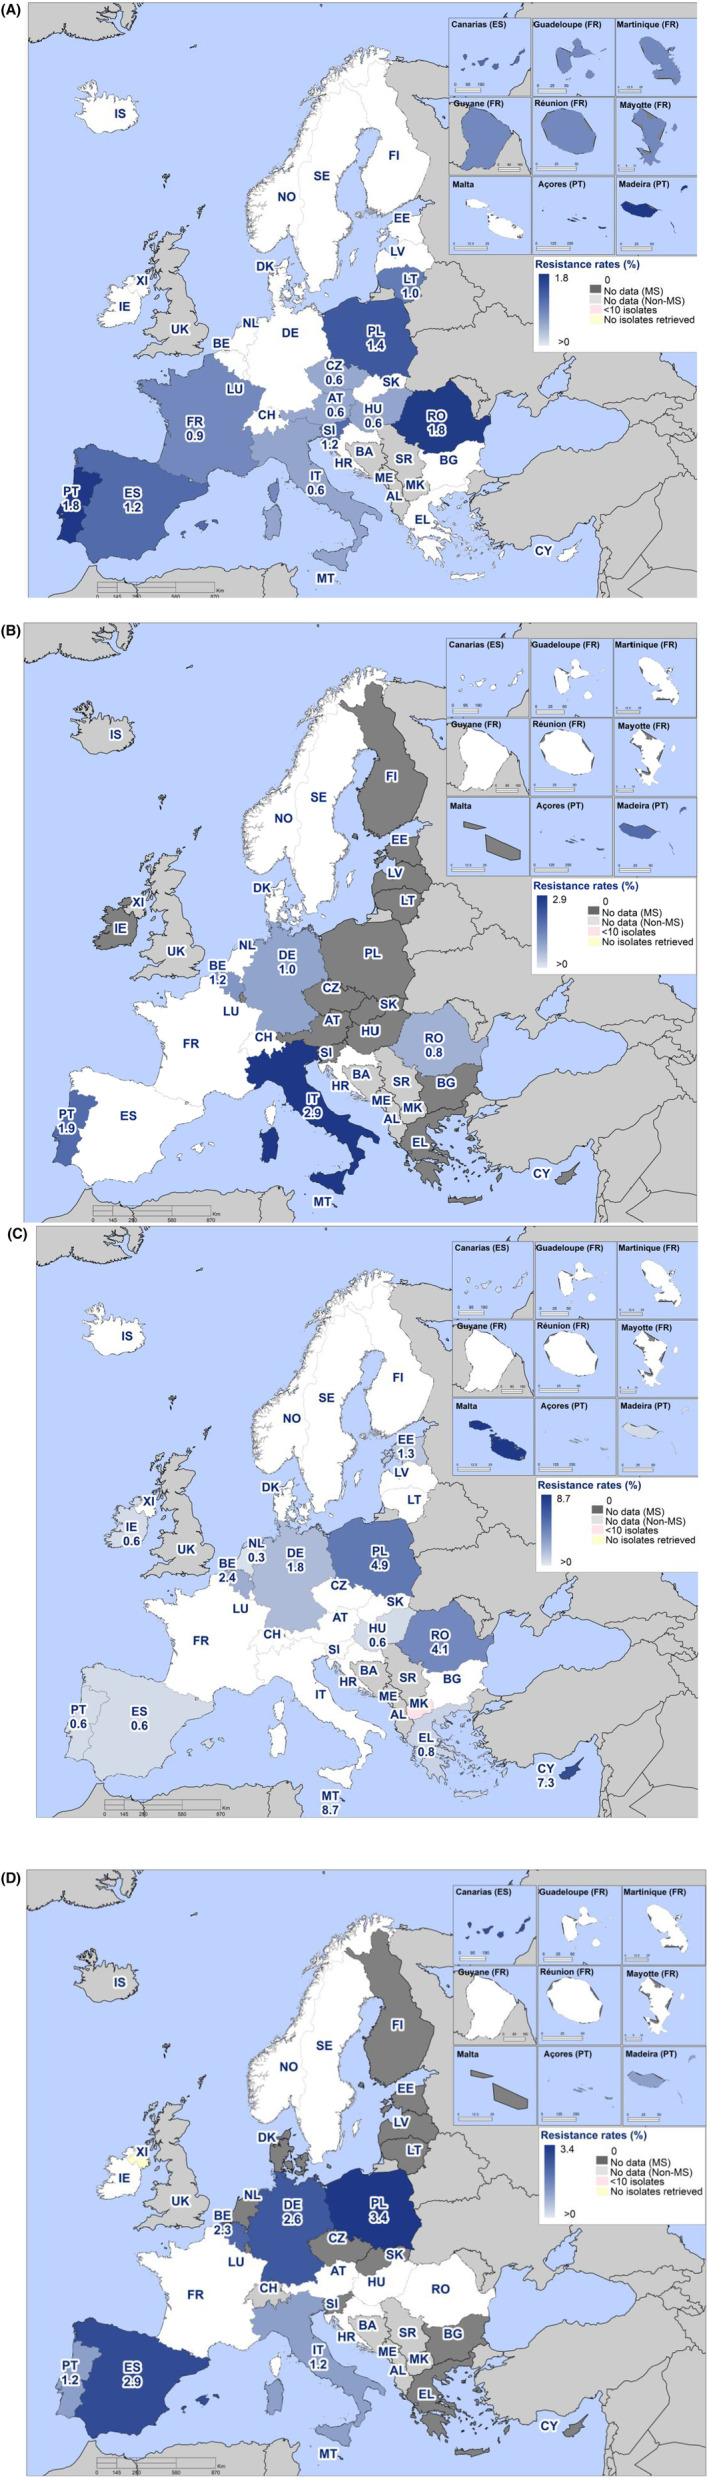
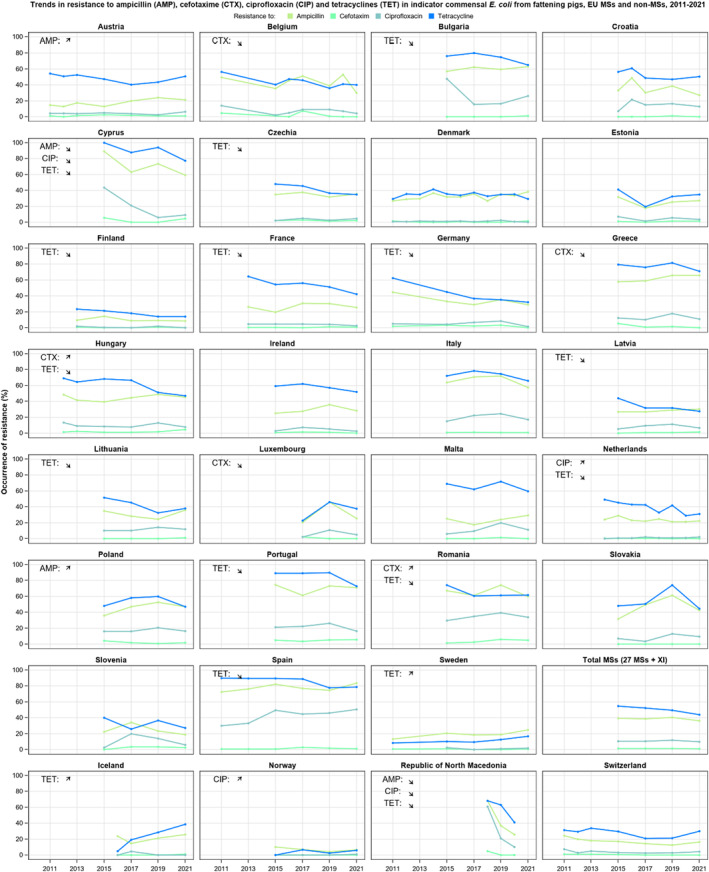
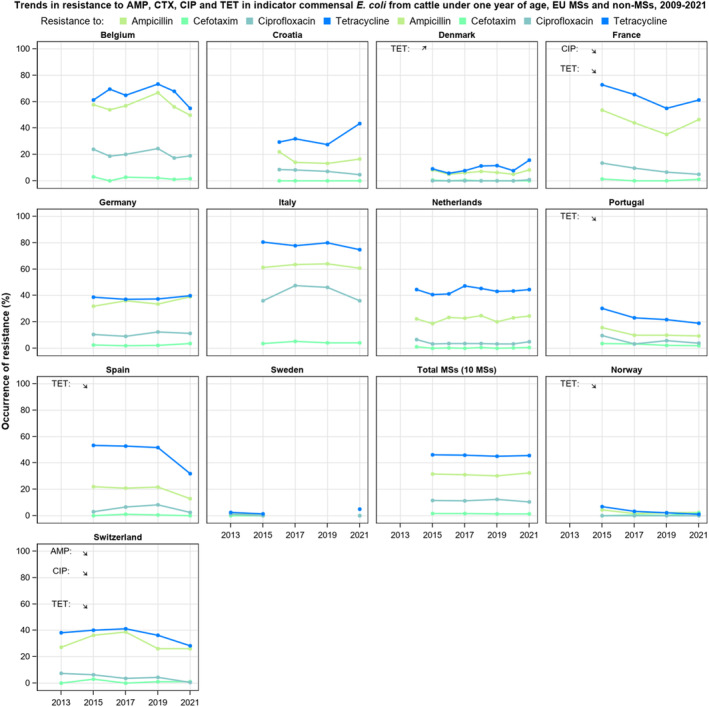
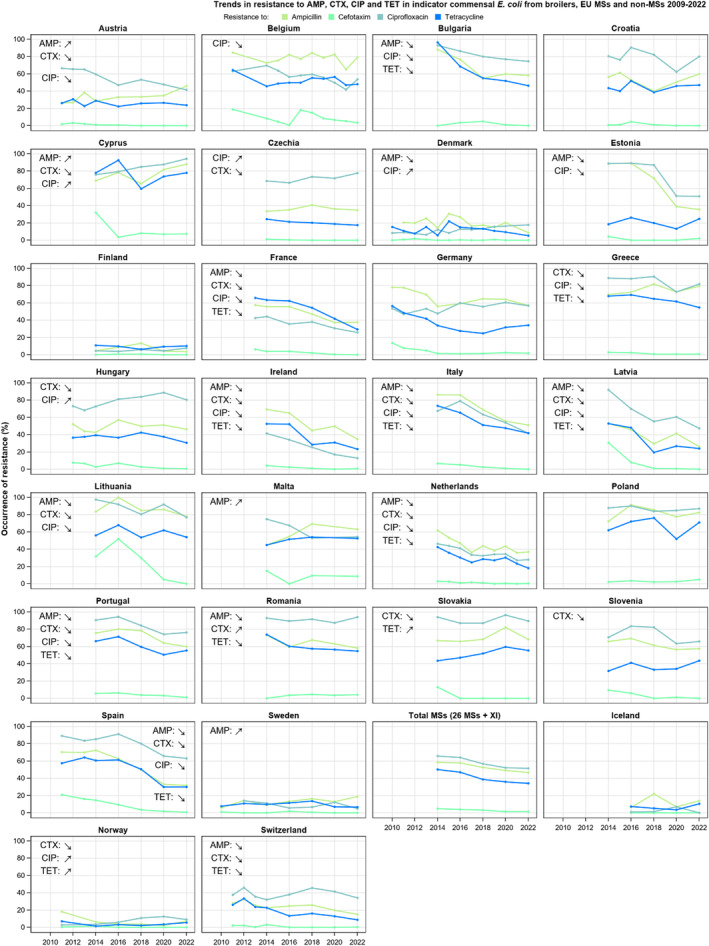
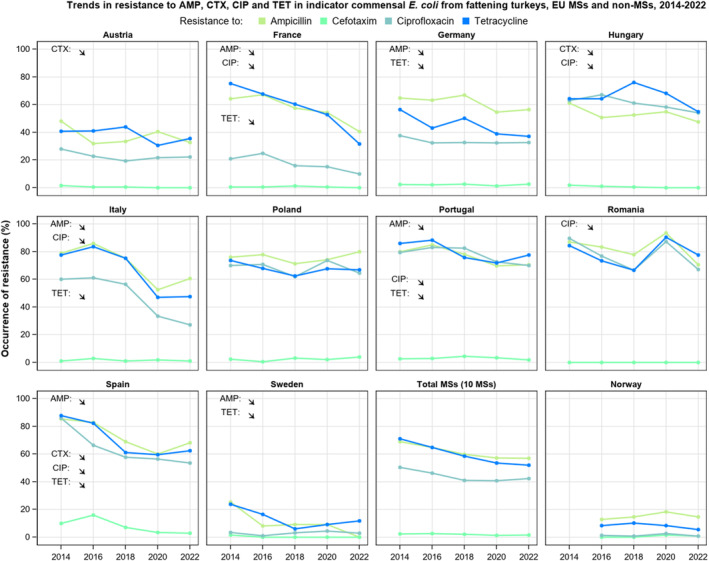
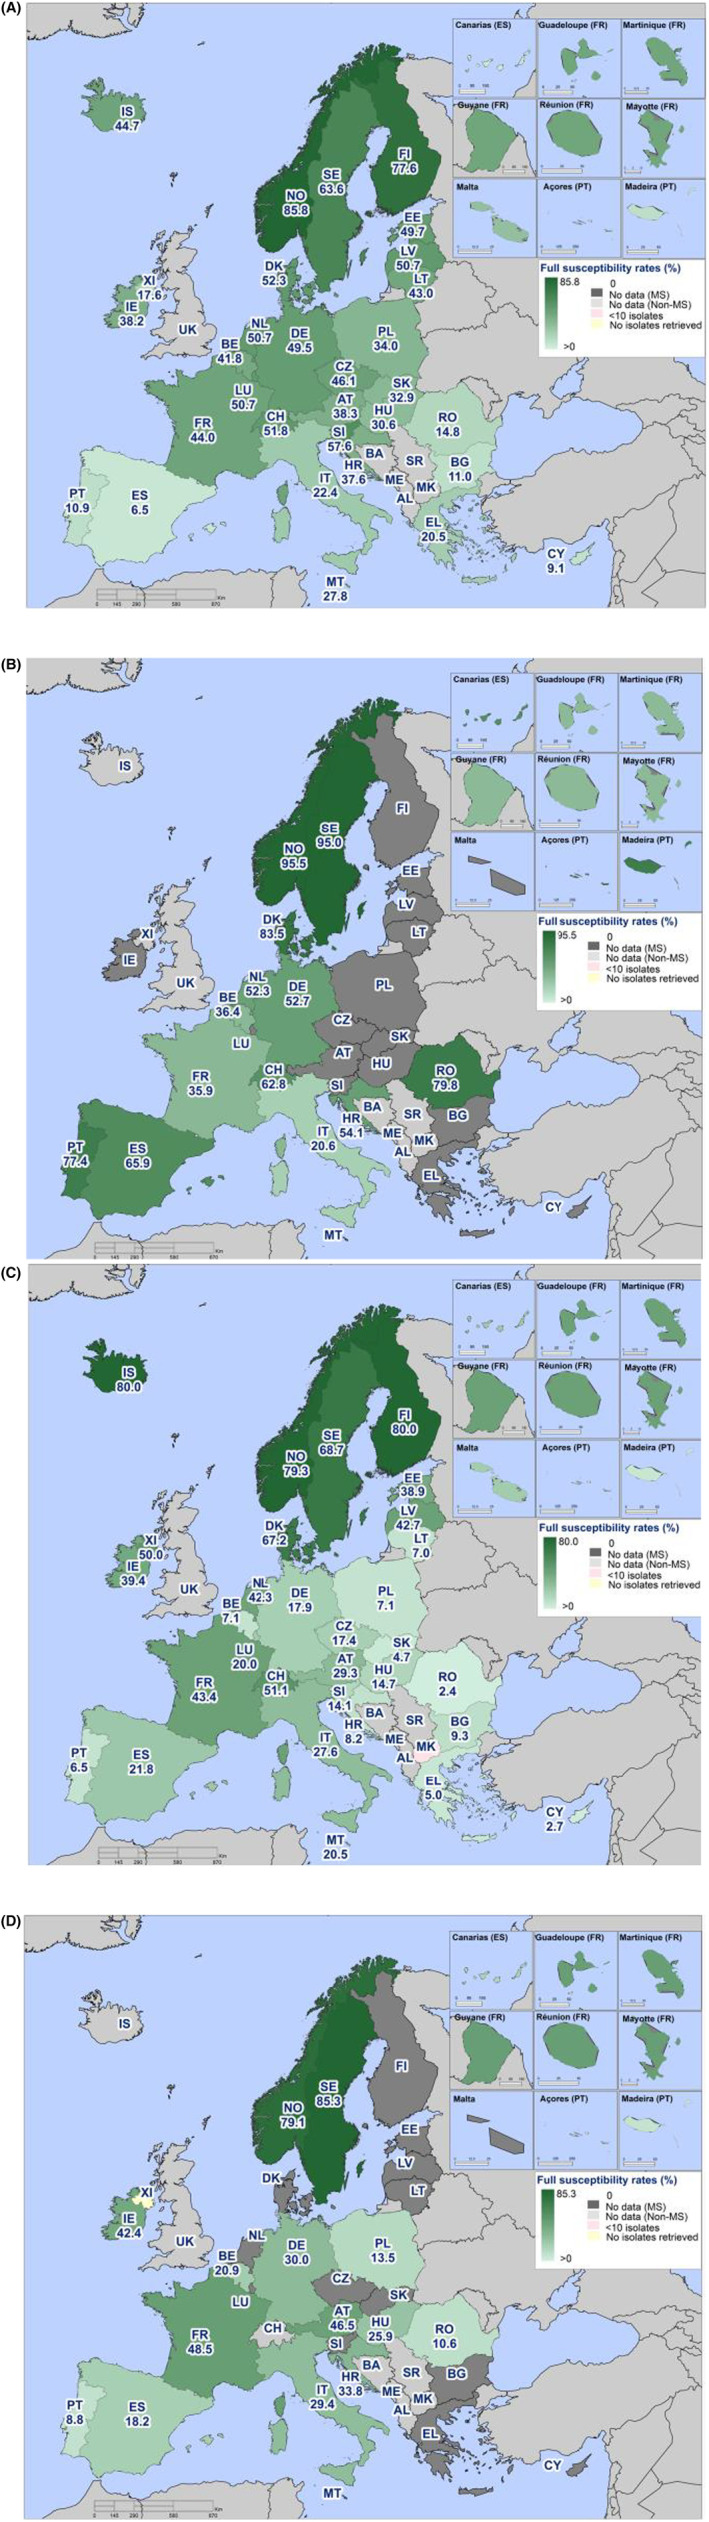
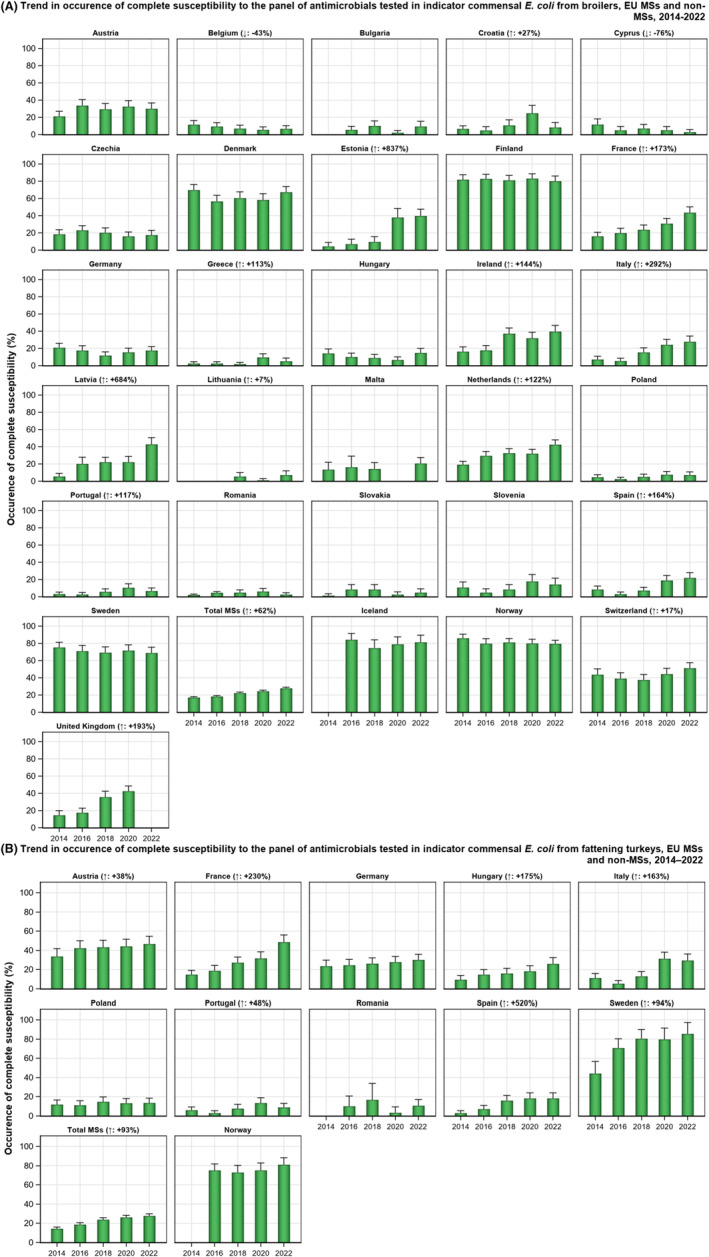
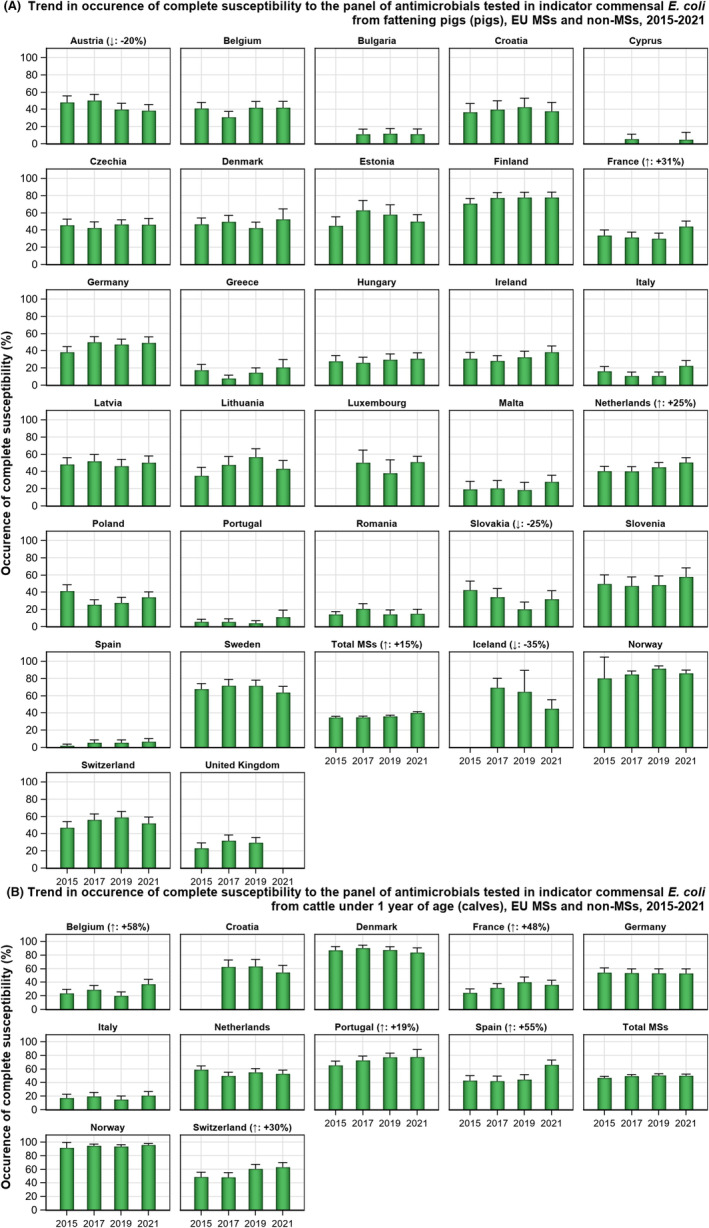
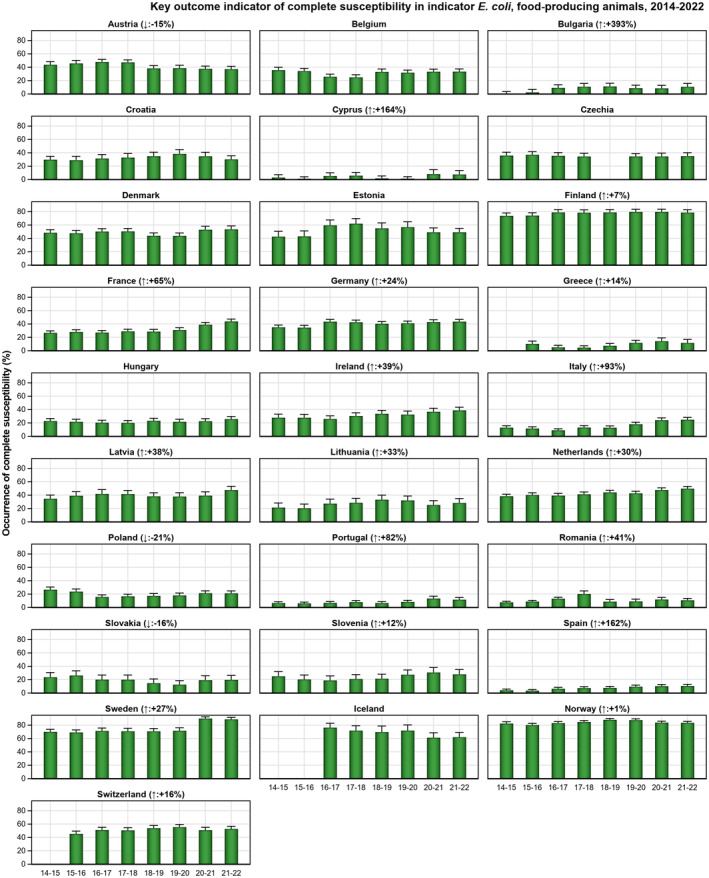
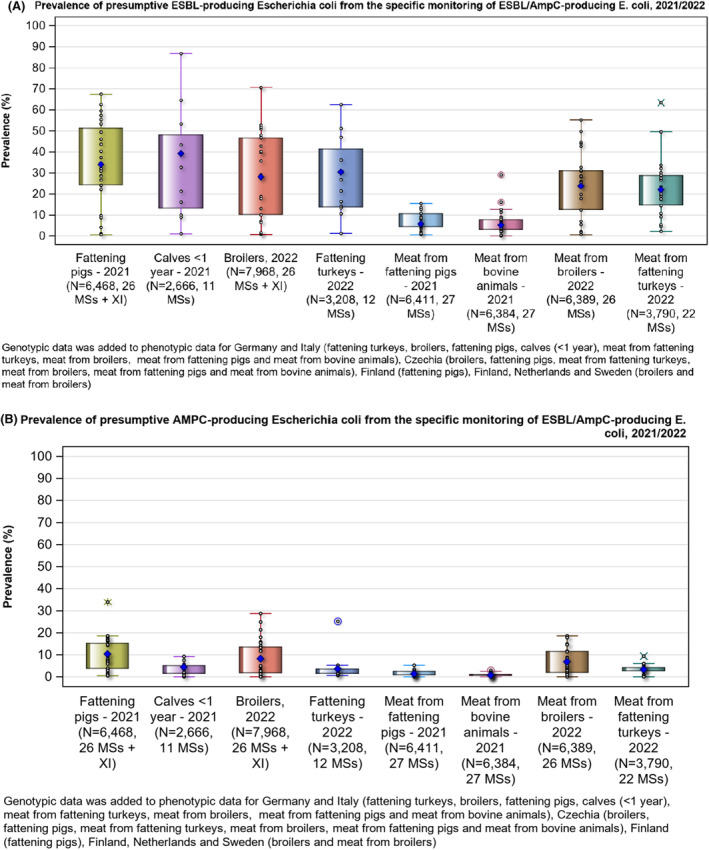
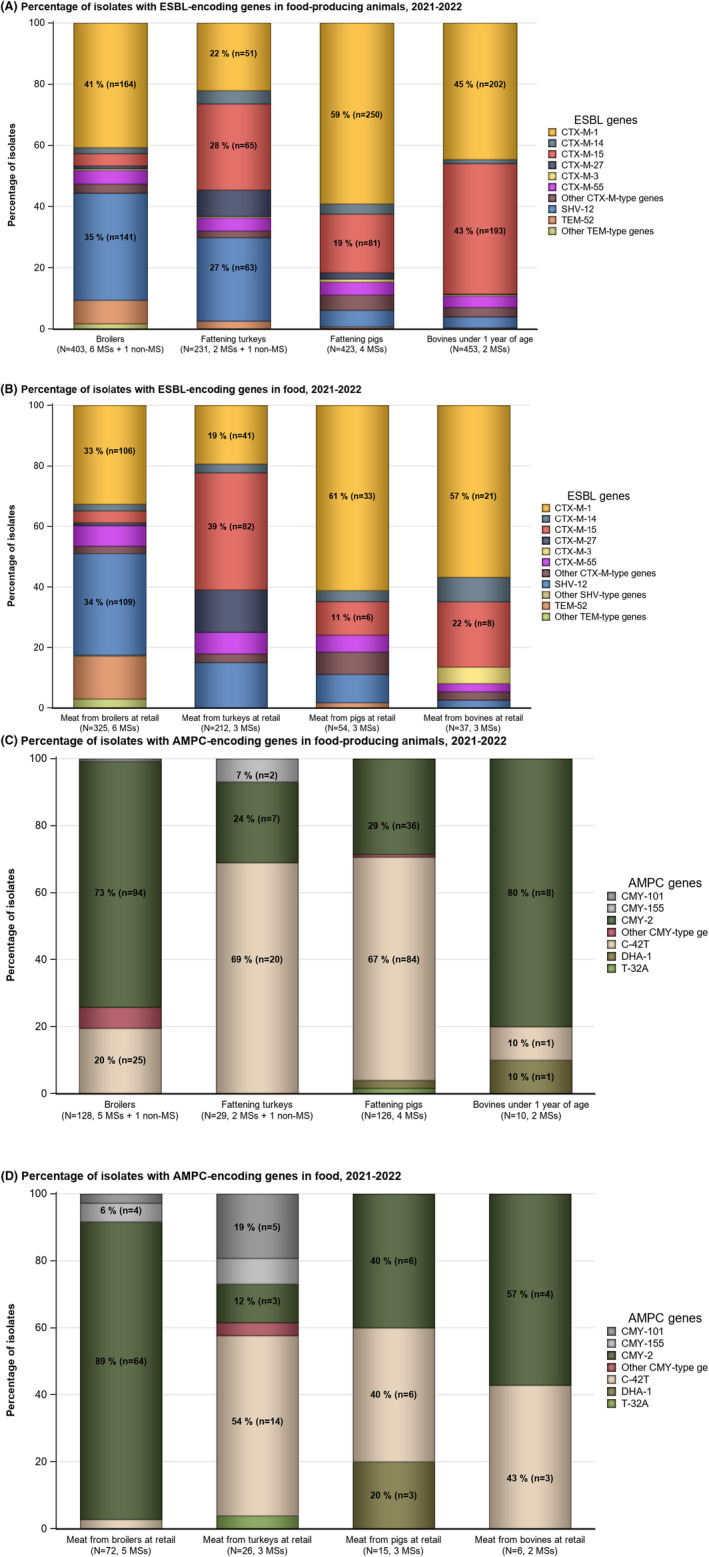
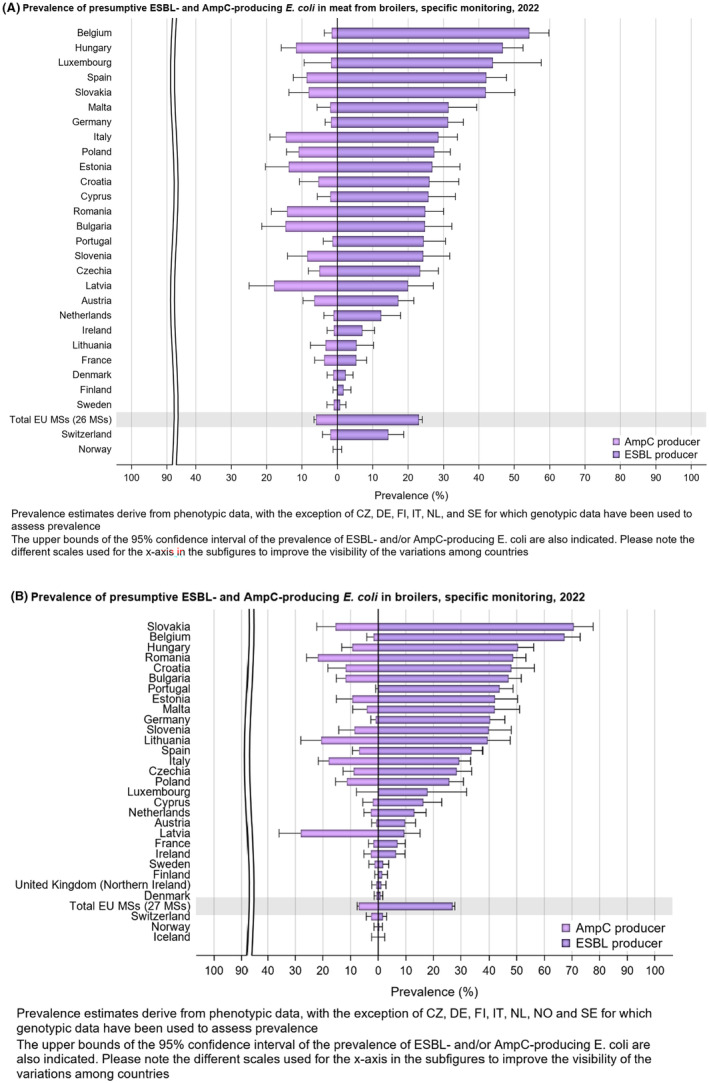
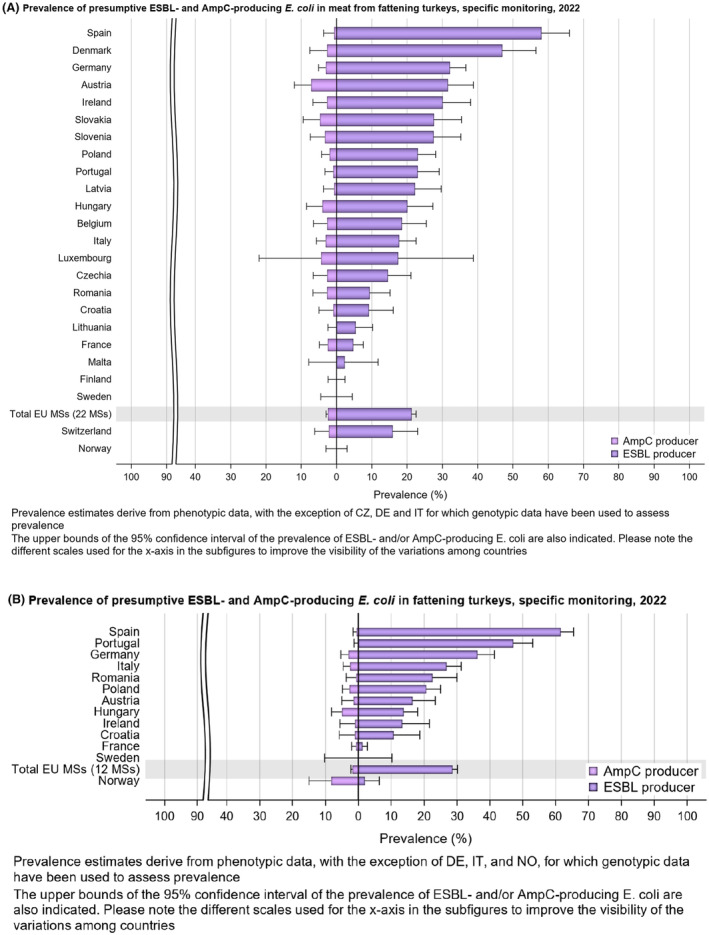
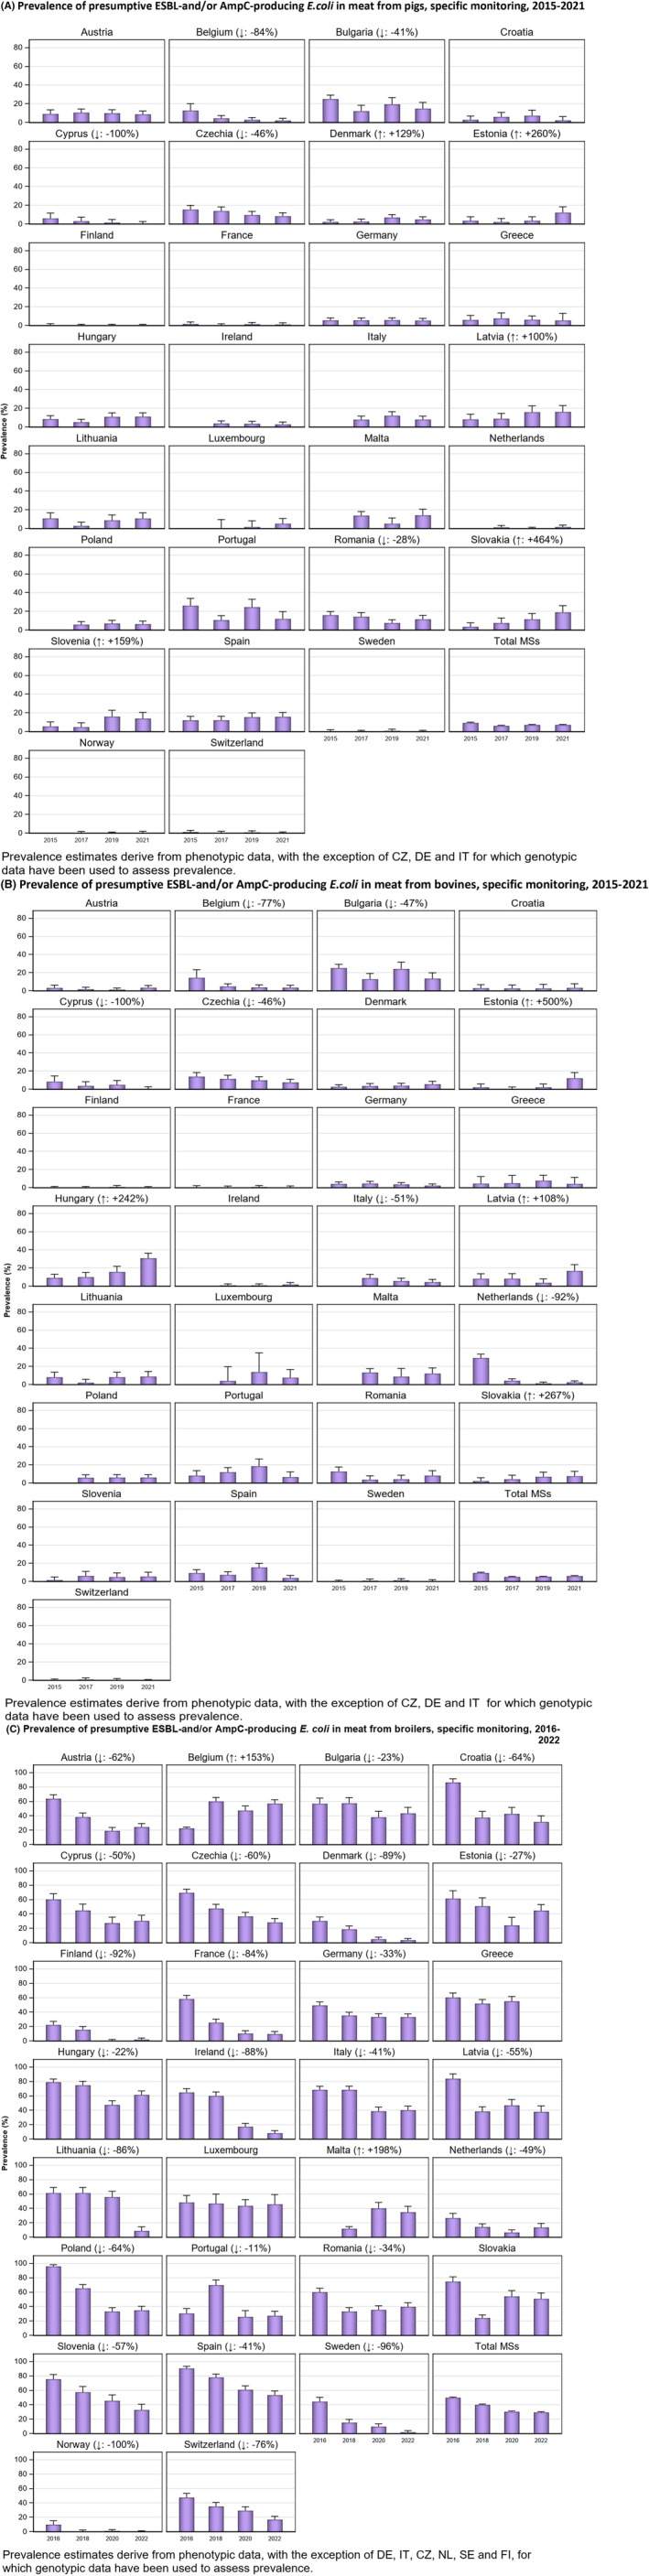
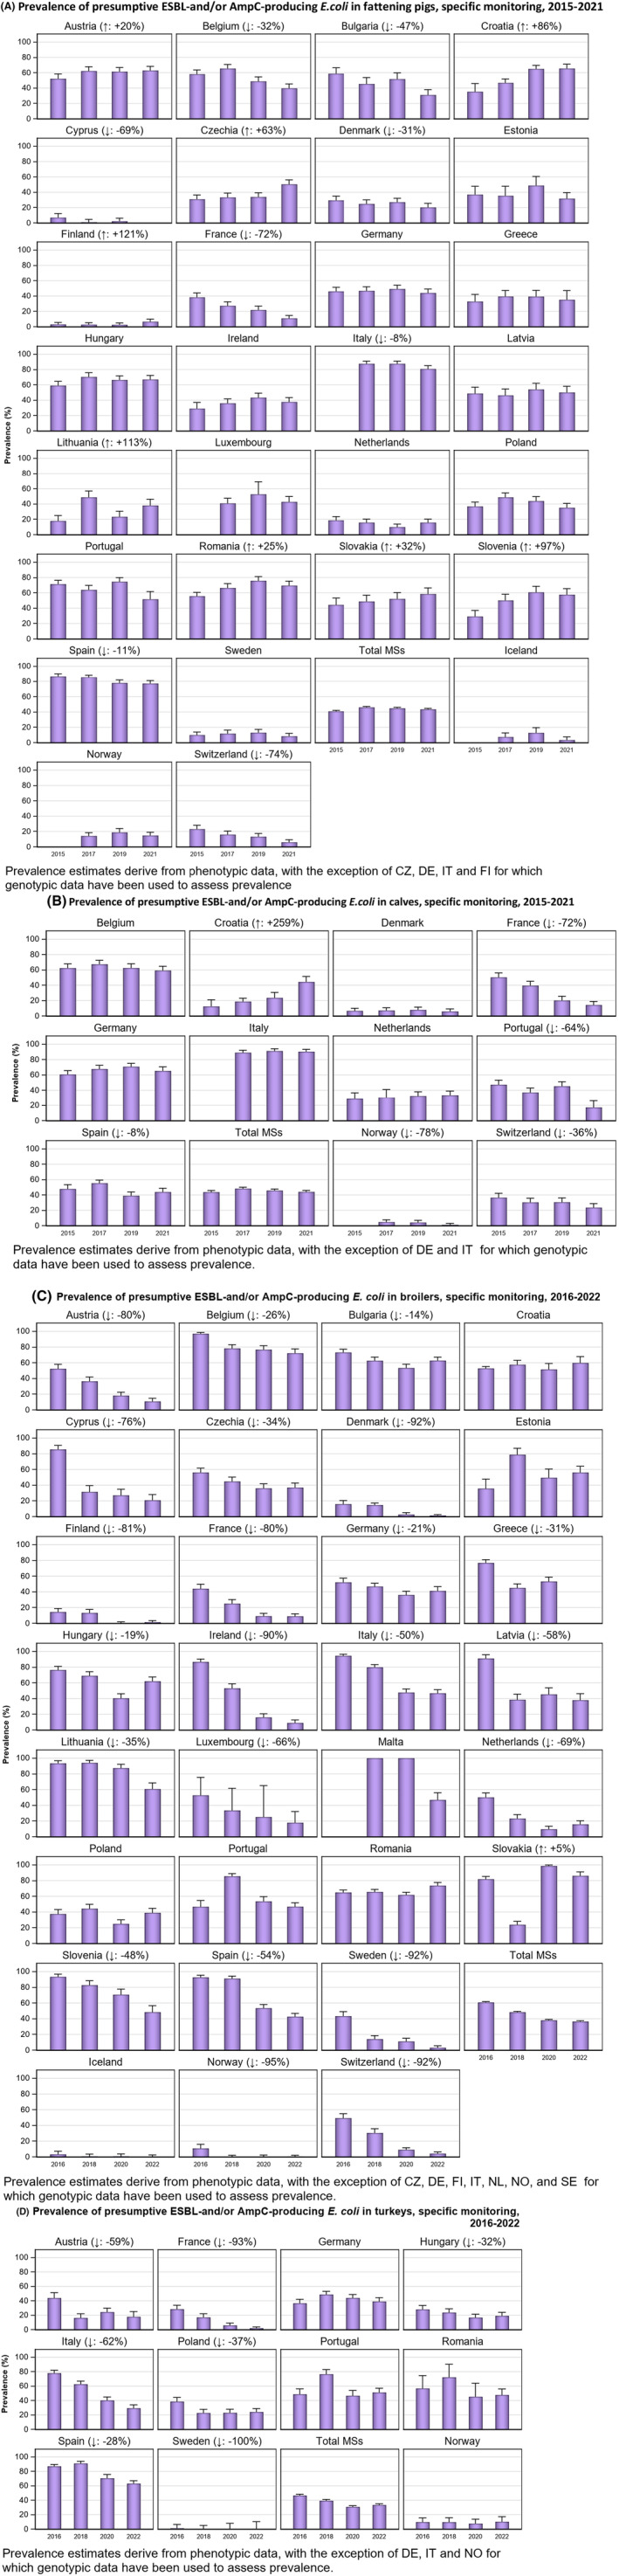
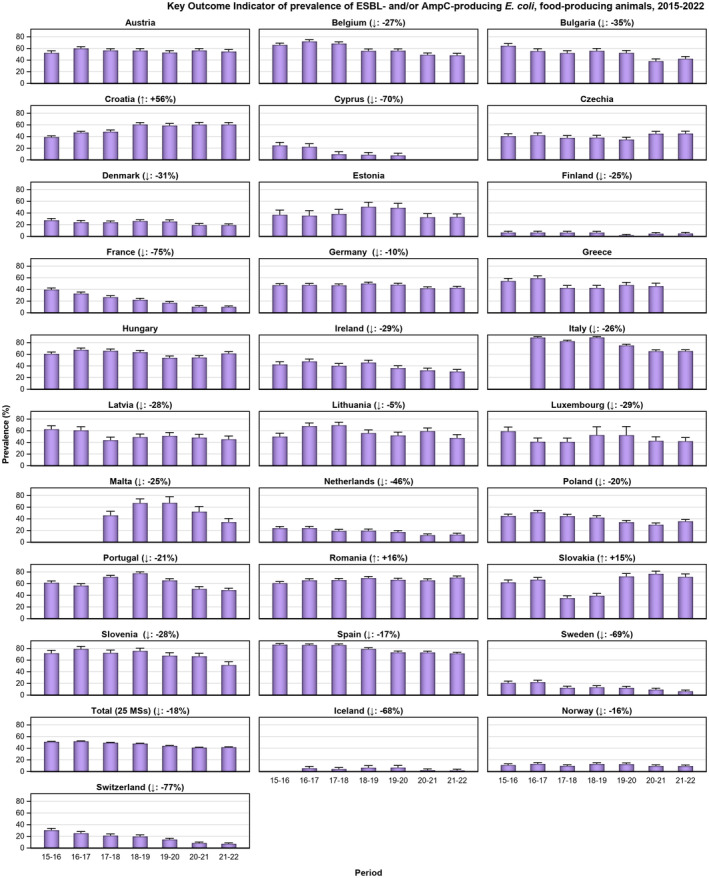
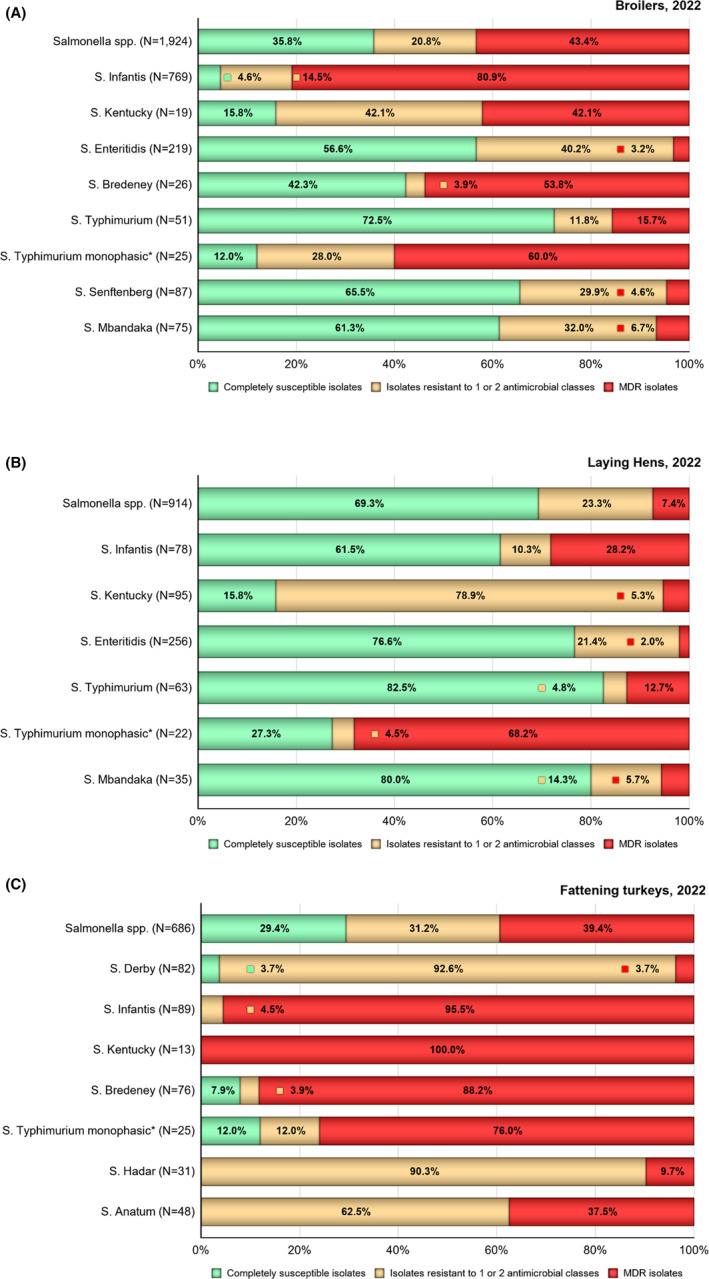
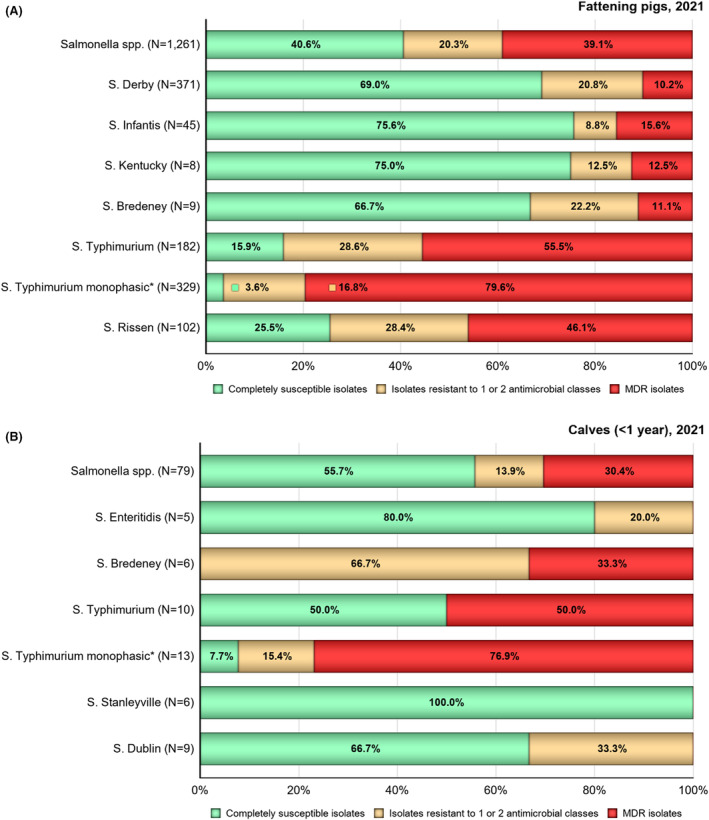
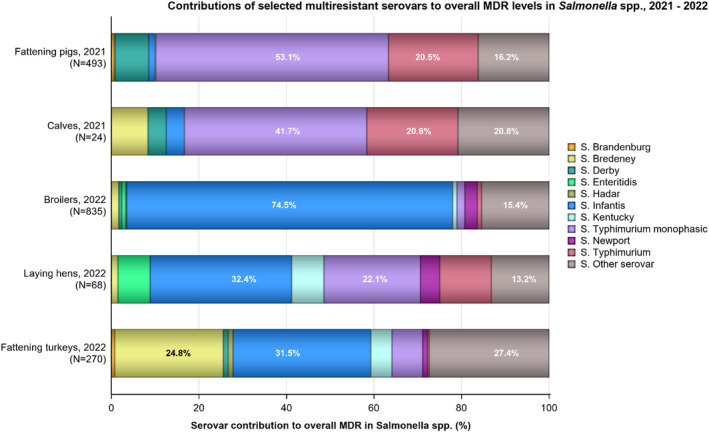
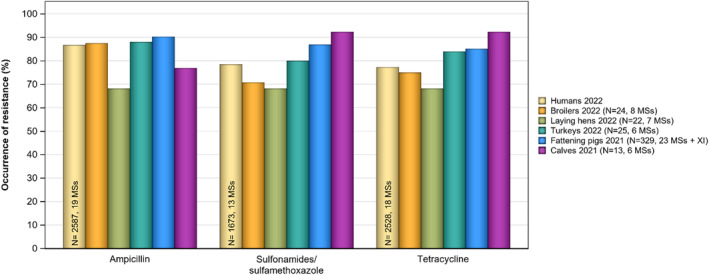
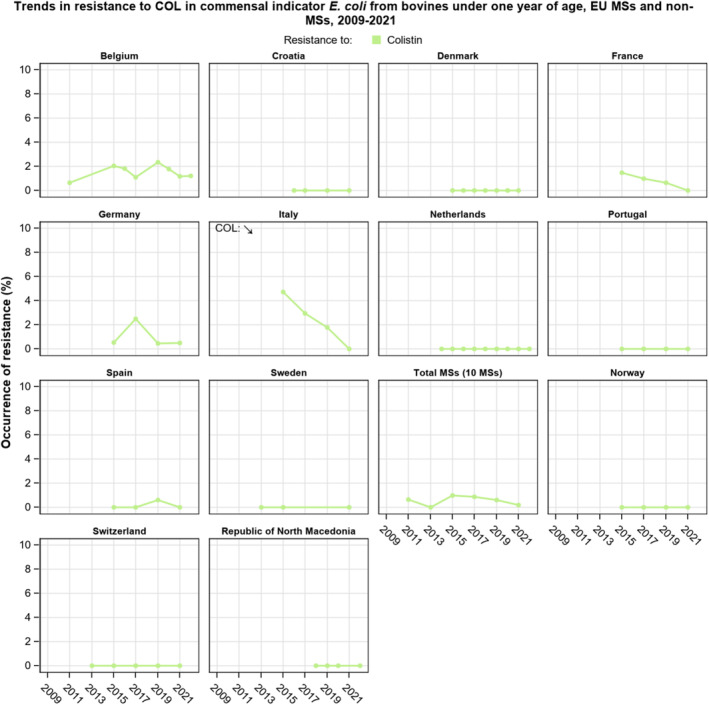
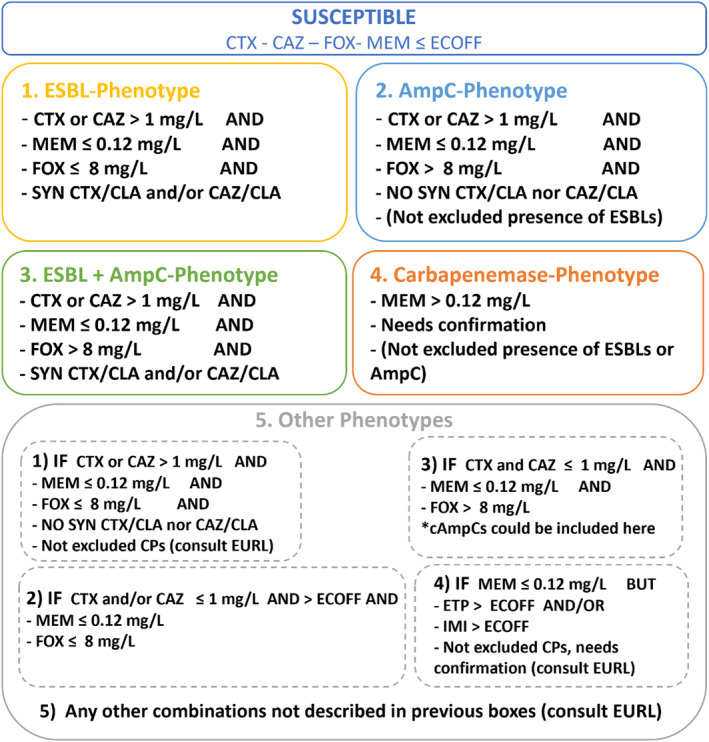
This report by the European Food Safety Authority and the European Centre for Disease prevention and Control, provides an overview of the main findings of the 2021-2022 harmonised Antimicrobial Resistance (AMR) monitoring in Salmonella spp., Campylobacter jejuni and C. coli from humans and food-producing animals (broilers, laying hens and fattening turkeys, fattening pigs and cattle under one year of age) and relevant meat thereof. For animals and meat thereof, AMR data on indicator commensal Escherichia coli, presumptive extended-spectrum beta-lactamases (ESBL)-/AmpC beta-lactamases (AmpC)-/carbapenemase (CP)-producing E. coli, and the occurrence of methicillin-resistant Staphylococcus aureus (MRSA) are also analysed. Generally, resistance levels differed greatly between reporting countries and antimicrobials. Resistance to commonly used antimicrobials was frequently found in Salmonella and Campylobacter isolates from humans and animals. In humans, increasing trends in resistance to one of two critically antimicrobials (CIA) for treatment was observed in poultry-associated Salmonella serovars and Campylobacter, in at least half of the reporting countries. Combined resistance to CIA was however observed at low levels except in some Salmonella serovars and in C. coli from humans and animals in some countries. While CP-producing Salmonella isolates were not detected in animals in 2021-2022, nor in 2021 for human cases, in 2022 five human cases of CP-producing Salmonella were reported (four harbouring bla OXA-48 or bla OXA-48-like genes). The reporting of a number of CP-producing E. coli isolates (harbouring bla OXA-48, bla OXA-181, bla NDM-5 and bla VIM-1 genes) in fattening pigs, cattle under 1 year of age, poultry and meat thereof by a limited number of MSs (5) in 2021 and 2022, requires a thorough follow-up. The temporal trend analyses in both key outcome indicators (rate of complete susceptibility and prevalence of ESBL-/AmpC-producers in E. coli) showed an encouraging progress in reducing AMR in food-producing animals in several EU MSs over the last 7 years.

Keywords: ESBL; MRSA; antimicrobial resistance; indicator bacteria; zoonotic bacteria.


Conflict of interest statement

If you wish to access the declaration of interests of any expert contributing to an EFSA scientific assessment, please contact interestmanagement@efsa.europa.eu.

Figures

FIGURE 1
FIGURE 1
Occurrence of resistance to selected and critically important antimicrobials in Salmonella spp. and selected serovars isolated from humans, 2022. Note: AMP, ampicillin; SMX, sulfamethoxazole; TET, tetracycline; CIP, ciprofloxacin; CTX, cefotaxime; CIP/CTX, combined ‘microbiological’ resistance to ciprofloxacin and cefotaxime; Blue diamond, resistance at the reporting MS group level; Horizontal lines represent median; Lower and upper box boundaries, 25th and 75th percentiles, respectively. Only MSs reporting data for 10 or more isolates are shown in the graph; however, all isolates are included in the calculation of resistance at the reporting MS group level.
FIGURE 2
FIGURE 2
Spatial distribution of combined ‘microbiological’ resistance to ciprofloxacin and cefotaxime among (A) Salmonella spp., (B) S. Infantis and (C) S. Kentucky isolated from human cases, 2022 (pink indicates fewer than ten isolates tested).
FIGURE 3
FIGURE 3
Proportion of Salmonella isolates from humans being completely susceptible, resistant to one and/or two antimicrobial classes or multidrug resistant (MDR) in 2022. Note: MDR and complete susceptibility are expressed as percentages; N, total number of isolates reported by MSs.
FIGURE 4
FIGURE 4
Trends in resistance to ampicillin, ciprofloxacin/pefloxacin/nalidixic acid, cefotaxime and tetracycline in Salmonella spp. from humans in 26 reporting countries, 2013–2022.
FIGURE 5
FIGURE 5
Occurrence of resistance to selected and critical important antimicrobials in Salmonella spp. recovered from broilers, laying hens, fattening turkeys in 2022, and fattening pigs and cattle under 1 year of age (calves) in 2021. Note: AMP, ampicillin; SMX, sulfamethoxazol; TET, tetracycline; CIP, ciprofloxacin; CTX, cefotaxime; CIP/CTX, combined 'microbiological' resistance to ciprofloxacin and cefotaxime; AMK, amikacin; N, total number of Salmonella spp. isolates reported by MSs; blue diamond shows resistance at the reporting MS group level. Horizontal lines represent media; Lower and upper box boundaries, 25th and 75th percentiles, respectively. Only MSs reporting data for 10 or more isolates are shown in the graph; however, all isolates are included in the calculation of resistance at the reporting‐MS group level.
FIGURE 6
FIGURE 6
Breakdown of the number of tigecycline‐resistant Salmonella isolates by serovar from broilers, fattening turkeys, laying hens in 2022 and fattening pigs and cattle under year old (calves) in 2021, using harmonised ECOFFs. Note: n, Total number of tigecycline‐resistant isolates reported by MSs; predominant serovars are also expressed as a percentage; *Monophasic S. Typhimurium includes all antigenic formulas; salmonellas in the legend are listed according to their predominance within all the animal/origins. The ECOFF used to determine tigecycline resistance was MIC > 0.5 mg/L.
FIGURE 7
FIGURE 7
Breakdown of the number of colistin‐resistant Salmonella isolates by serovar, where detected among the animal origins by reporting MSs in 2021/2022. Note: n, Total number of colistin‐resistant isolates reported by the MSs; predominant serovars are expressed as a percentage. Salmonellas in the legend are listed according to their predominance within all the animal origins.
FIGURE 8
FIGURE 8
MDR and CS Salmonella spp. isolates recovered from broilers, laying hens, fattening turkeys, fattening pigs and cattle under 1 year of age (calves) for all reporting MSs, 2021–2022, using harmonised EUCAST ECOFFs. Note: The MDR analysis of animal isolates included the following antimicrobials: amikacin/gentamicin, ampicillin, azithromycin, cefotaxime/ceftazidime, chloramphenicol, ciprofloxacin/nalidixic acid, meropenem, sulfamethoxazole, tetracycline/tigecycline and trimethoprim. MDR and complete susceptibility are expressed as percentages; N, total number of Salmonella spp. reported by MSs. Only MSs with 10 or more isolates are included in the MDR analysis. The ECOFFs used to determine microbiological resistance are from the current legislation (2020/1729/EU).
FIGURE 9
FIGURE 9
Spatial distributions of complete susceptibility to the selected antimicrobials tested among Salmonella spp. from (A) broilers, (B) laying hens and (C) fattening turkeys, (D) fattening pigs and (E) cattle under 1 year of age using harmonised ECOFFs, 2021–2022.
FIGURE 10
FIGURE 10
Distribution of MIC levels among ciprofloxacin‐resistant Salmonella spp. from broilers, laying hens, fattening turkeys, fattening pigs and cattle under 1 year of age (calves), for all reporting EU MSs, 2021–2022. Note: N, Total number of Salmonella isolates tested; n, number of ciprofloxacin resistant Salmonella isolates.
FIGURE 11
FIGURE 11
MDR and CS Salmonella spp. from selected serovars recovered from humans in 2022, broiler, turkey and laying hen flocks in 2022, and fattening pigs and cattle under 1 year of age (calves) in 2021. Note: The MDR analysis of animal isolates included the following antimicrobials: amikacin/gentamicin, ampicillin, azithromycin, cefotaxime/ceftazidime, chloramphenicol, ciprofloxacin/nalidixic acid, meropenem, sulfamethoxazole, tetracycline/tigecycline and trimethoprim. MDR and complete susceptibility are expressed as percentages; N: total number of Salmonella isolates reported by MSs. Only MSs with 10 or more isolates are included in the MDR analysis. The ECOFFs used to determine microbiological resistance are from the current legislation (2020/1729/EU).
FIGURE 12
FIGURE 12
Occurrence of resistance to selected antimicrobials in Salmonella spp. from humans (2022) and animal populations (2021–2022), all reporting MSs.
FIGURE 13
FIGURE 13
Boxplot of the occurrence of resistance to a selection of antimicrobials in Campylobacter jejuni and C. coli isolates from humans, 2022. Note: GEN, gentamicin; TET, tetracycline; CIP, ciprofloxacin; ERY, erythromycin; CIP/ERY, combined resistance to ciprofloxacin and erythromycin. Horizontal line represents the median; blue diamond: overall resistance in the EU. Only countries reporting ≥ 10 isolates per species are included in the graph.
FIGURE 14
FIGURE 14
Spatial distribution of combined resistance to ciprofloxacin and erythromycin in (A) Campylobacter jejuni and (B) C. coli isolates from humans, 2022.
FIGURE 15
FIGURE 15
Trends in ciprofloxacin (CIP), erythromycin (ERY) and tetracycline (TET) resistance in Campylobacter jejuni from humans in 21 reporting countries, 2013–2022.
FIGURE 16
FIGURE 16
Trends in ciprofloxacin (CIP), erythromycin (ERY) and tetracycline (TET) resistance in Campylobacter coli from humans in 14 reporting countries, 2013–2022.
FIGURE 17
FIGURE 17
Erythromycin minimum inhibitory concentration (MIC) distribution in Campylobacter jejuni and C. coli isolates from humans, 2022. Note: ≤ 1 mg/L could potentially include values smaller than or equal to 0.5 and 0.25 mg/L. ≥ 256 mg/L could potentially include values greater than or equal to 512 mg/L.
FIGURE 18
FIGURE 18
Occurrence of resistance to antimicrobials in (A) Campylobacter jejuni and (B) C. coli from food‐producing animals, 2021/2022. Note: GEN, gentamicin; TET, tetracycline; CIP, ciprofloxacin (CIP); ERY, erythromycin; CIP/ERY, combined resistance to ciprofloxacin and erythromycin; CHL, chloramphenicol; ETP, ertapenem. Horizontal line represents the median; blue diamond: overall resistance in the EU; dots represent resistance in the different countries.
FIGURE 19
FIGURE 19
Spatial distribution of combined resistance to ciprofloxacin and erythromycin in Campylobacter jejuni isolates from (A) broilers (26 MSs, the United Kingdom (Northern Ireland) and three non‐MSs, 2022); (B) fattening turkeys (10 EU MSs, 2022); (C) cattle under 1 year of age (10 EU MSs and two non‐MSs, 2021). Note: Maps are presented only when at least four Member States reported data. Countries that reported less than 10 isolates are displayed in pink (and their % of resistance is not shown).
FIGURE 20
FIGURE 20
Spatial distribution of combined resistance to ciprofloxacin and erythromycin in Campylobacter coli isolates from (A) broilers (24 MSs, the United Kingdom (Northern Ireland) and three non‐MS, 2022); (B) fattening turkeys (11 EU MSs, 2022); (C) fattening pigs (26 EU MSs, the United Kingdom (Northern Ireland), and three non‐MSs, 2021); and (D) cattle under 1 year of age (10 EU MSs, 2021). Note: Maps are presented only when at least four Member States reported data. Countries that reported less than 10 isolates are displayed in pink (and their % of resistance is not shown).
FIGURE 21
FIGURE 21
Prevalence of resistance to ciprofloxacin (A), erythromycin (B), tetracycline (C) and related 95% confidence intervals in Campylobacter jejuni from broilers, per reporting country, 2022. Note: Only countries reporting prevalence of Campylobacter at species level, i.e. prevalence of C. jejuni in broilers were included in the analysis.
FIGURE 22
FIGURE 22
Prevalence of resistance to ciprofloxacin (A), erythromycin (B), tetracycline (C) and related 95% confidence intervals in Campylobacter jejuni from fattening turkeys, per reporting country, 2022. Note: Only countries reporting prevalence of Campylobacter at species level, i.e. prevalence of C. jejuni in fattening turkeys were included in the analysis.
FIGURE 23
FIGURE 23
Prevalence of resistance to ciprofloxacin (A), erythromycin (B), tetracycline (C) and related 95% confidence intervals in Campylobacter coli from broilers, per reporting country, 2022. Note: Only countries reporting prevalence of Campylobacter at species level, i.e. prevalence of C. coli in broilers were included in the analysis. Republic of North Macedonia (not included in this graph) reported data only on five samples.
FIGURE 24
FIGURE 24
Prevalence of resistance to ciprofloxacin (A), erythromycin (B), tetracycline (C) and related 95% confidence intervals in Campylobacter coli from fattening turkeys, per reporting country, 2022. Note: Only countries reporting prevalence of Campylobacter at species level, i.e. prevalence of C. coli in fattening turkeys were included in the analysis.
FIGURE 25
FIGURE 25
Trends in ciprofloxacin (CIP), erythromycin (ERY) and tetracycline (TET) resistance in Campylobacter jejuni from broilers, 2014–2022. Note: Only countries that reported data fulfilling all inclusion criteria explained in the text are shown. Overall temporal trend (shown in box 'Total (23 MSs)') is presented only for Member States and for even years, when the monitoring of antimicrobial resistance in poultry population in EU is mandatory according to Decision (EU) 2020/1729.
FIGURE 26
FIGURE 26
Trends in ciprofloxacin (CIP), erythromycin (ERY) and tetracycline (TET) resistance in Campylobacter jejuni from fattening turkeys, 2014–2022. Note: Only countries that reported data fulfilling all inclusion criteria explained in the text are shown. Overall temporal trend (shown in box 'Total (8 MSs)') is presented only for Member States and for even years when the monitoring of antimicrobial resistance in EU in poultry population is mandatory according to Decision (EU) 2020/1729.
FIGURE 27
FIGURE 27
Distribution of minimum inhibitory concentration (MIC) values related to erythromycin resistance in (A) Campylobacter jejuni from fattening pigs and cattle under 1 year of age, (B) C. coli from fattening pigs and cattle under 1 year of age, (C) C. jejuni from broilers and fattening turkeys and (D) C. coli from broilers and fattening turkeys, in reporting EU MSs, the United Kingdom (Northern Ireland), and non‐EU MSs, 2021 and 2022.
FIGURE 28
FIGURE 28
Number of isolates (and proportion) exhibiting different levels of erythromycin resistance in broilers, fattening turkeys, fattening pigs and cattle under 1 year of age in reporting EU MSs, the United Kingdom (Northern Ireland) and non‐EU MSs, 2021–2022.
FIGURE 29
FIGURE 29
Comparison of clinical breakpoints (CBPs) and epidemiological cut‐off values (ECOFFs) used to interpret MIC data reported for Campylobacter spp. from humans and food‐producing animals.
FIGURE 30
FIGURE 30
Comparison of Campylobacter jejuni occurrence of resistance between humans and food‐producing animals, EU MSs, 2021/2022.
FIGURE 31
FIGURE 31
Comparison of Campylobacter coli occurrence of resistance between humans and food‐producing animals, EU MSs, 2021/2022.
FIGURE 32
FIGURE 32
Proportion of isolates completely susceptible, resistant to one or two antimicrobial classes and multidrug resistant (MDR) among Campylobacter jejuni and C. coli from humans, broilers, fattening turkeys, fattening pigs and cattle under 1 year of age, in reporting EU MSs, 2021–2022.
FIGURE 33
FIGURE 33
Distribution of the occurrence of resistance to selected antimicrobials in indicator commensal E. coli isolates recovered from fattening pigs and cattle under 1 year of age in 2021, and from broilers and fattening turkeys in 2022, from EU MSs, XI and non‐MSs, 2022. Note: AMP, ampicillin; SMX, sulfamethoxazol; TET, tetracycline; CIP, ciprofloxacin; CTX, cefotaxime; CIP/CTX, combined 'microbiological' resistance to ciprofloxacin and cefotaxime; AMK, amikacin; N, total number of indicator commensal E. coli isolates reported by MSs; blue diamond shows resistance at the reporting MS group level. Horizontal lines represent media; Lower and upper box boundaries, 25th and 75th percentiles, respectively.
FIGURE 34
FIGURE 34
Spatial distribution of microbiological combined resistance to cefotaxime and ciprofloxacin in indicator commensal E. coli from (A) fattening pigs, 2021; (B) cattle under 1 year of age, 2021; (C) broilers, 2022; and (D) fattening turkeys, 2022, EU MSs and non‐MSs.
FIGURE 35
FIGURE 35
Trends in resistance to ampicillin (AMP), cefotaxime (CTX), ciprofloxacin (CIP) and tetracyclines (TET) in indicator commensal E. coli from fattening pigs (pigs), EU MSs and non‐MSs, 2011–2021.
FIGURE 36
FIGURE 36
Trends in resistance to ampicillin (AMP), cefotaxime (CTX), ciprofloxacin (CIP) and tetracyclines (TET) in indicator commensal E. coli from cattle under 1 year of age, EU MSs and non‐MSs 2013–2021.
FIGURE 37
FIGURE 37
Trends in resistance to ampicillin (AMP), cefotaxime (CTX), ciprofloxacin (CIP) and tetracyclines (TET) in indicator commensal E. coli from broilers, EU MSs and non‐MSs, 2010–2022.
FIGURE 38
FIGURE 38
Trends in resistance to ampicillin (AMP), cefotaxime (CTX), ciprofloxacin (CIP) and tetracycline (TET) in indicator commensal E. coli from fattening turkeys (turkeys), EU MSs and non‐MSs, 2014–2022.
FIGURE 39
FIGURE 39
Spatial distribution of complete susceptibility to the antimicrobials tested in indicator commensal E. coli. (A) fattening pigs (pigs) 2021; (B) cattle under 1 year of age (calves) 2021; (C) broilers 2022; (D) fattening turkeys (turkeys) 2022, EU MSs and non‐EU MSs.
FIGURE 40
FIGURE 40
Trends in the occurrence of complete susceptibility to the panel of antimicrobials tested in indicator commensal E. coli from (A) broilers and (B) fattening turkeys (turkeys), EU MSs and non‐MSs, 2014–2022.
FIGURE 41
FIGURE 41
Trends in the occurrence of complete susceptibility to the panel of antimicrobials tested in indicator commensal E. coli from (A) fattening pigs and (B) cattle under 1 year of age, EU MSs and non‐MSs, 2015–2021.
FIGURE 42
FIGURE 42
Trends in the key outcome indicator of complete susceptibility (KOICS) in indicator commensal E. coli from food‐producing animals (broilers, fattening turkeys, fattening pigs and cattle under 1 year of age), 27 EU MSs and 3 non‐MSs, 2014–2022.
FIGURE 43
FIGURE 43
Prevalence of presumptive (A) ESBL‐producing and (B) AmpC‐producing Escherichia coli from the specific monitoring of ESBL‐/AmpC‐producing Escherichia coli, 2021/2022. Note: N, number of samples tested; diamonds with white outline are the data (one data point per country); blue diamond is Total EU. Outliers (> 1.5 IQR from 75 percentile) are spotted using a different symbol for each matrix (i.e. square for fattening turkeys).
FIGURE 44
FIGURE 44
Escherichia coli isolates harbouring (A) ESBL‐encoding genes in animals, (B) ESBL‐encoding genes in retail meat, (C) AmpC‐encoding genes and AmpC‐chromosomal point mutations in animals and (D) AmpC‐encoding genes and AmpC‐chromosomal point mutations in retail meat. Note: The figures include data from countries reporting WGS data to be used for analysis instead of MIC values. This excludes countries that provided both MIC results and WGS results voluntarily. ESBL, extended‐spectrum beta‐lactamase; AmpC, AmpC beta‐lactamase; N, number of isolates harbouring an ESBL or AmpC‐ encoding gene; n, number of isolates harbouring a specific gene.
FIGURE 45
FIGURE 45
Spatial distribution of the prevalence of presumptive ESBL‐ and/or AmpC‐producing Escherichia coli from (A) pig meat in 2021, (B) cattle meat in 2021, (C) broiler meat in 2022 and (D) turkey meat in 2022, EU MSs and non‐MSs, 2021/2022.
FIGURE 46
FIGURE 46
SpatialY distribution of the prevalence of presumptive ESBL‐ and/or AmpC‐producing Escherichia coli from (A) fattening pigs in 2021, (B) cattle under 1 year of age in 2021, (C) broilers in 2022 and (D) fattening turkeys in 2022, EU MSs and non‐MSs, 2021/2022.
FIGURE 47
FIGURE 47
Prevalence of presumptive ESBL‐producing versus AmpC‐producing Escherichia coli from (A) pig meat and (B) fattening pigs, EU MSs and non‐EU MSs, 2021.
FIGURE 48
FIGURE 48
Prevalence of presumptive ESBL‐producing versus AmpC‐producing Escherichia coli from (A) cattle meat and (B) cattle under 1 year of age, EU MSs and non‐EU MSs, 2021.
FIGURE 49
FIGURE 49
Prevalence of presumptive ESBL‐producing versus AmpC‐producing Escherichia coli from (A) broiler meat and (B) broilers, EU MSs and non‐EU MSs, 2022.
FIGURE 50
FIGURE 50
Prevalence of presumptive ESBL‐producing versus AmpC‐producing Escherichia coli from (A) turkey meat and (B) fattening turkeys, EU MSs and non‐ MSs, 2022.
FIGURE 51
FIGURE 51
Trends on the prevalence of presumptive ESBL‐ and/or AmpC‐producing Escherichia coli in (A) pig meat, (B) cattle meat and (C) broiler meat, EU MSs and non‐MSs, 2016–2022. Arrows (↓/↑): indicate statistically significant decreasing/increasing trends over the period.
FIGURE 52
FIGURE 52
Trends on the prevalence of presumptive ESBL and/or AmpC‐producing Escherichia coli in (a) fattening pigs, (b) cattle under 1 year of age and (c) broilers, (d) fattening turkeys, EU MSs and non‐MSs, 2016–2022. Arrows (↓/↑): indicate statistically significant decreasing/increasing trends over the period.
FIGURE 53
FIGURE 53
Changes in key outcome indicator of ESBL‐ and/or AmpC‐producing Escherichia coli (KOIESC), 27 MSs and 2 non‐MSs, 2015‐2022.
FIGURE 54
FIGURE 54
Methicillin‐resistant Staphylococcus aureus in food‐producing animals, 2021/2022. Note: Only food‐producing animal categories where positive isolates were obtained and countries investigating > 10 samples are presented in this graph. The isolation method used for detection of MRSA is not considered in this analysis. N, Total number of sample units tested; BE, Belgium; CH, Switzerland; NL, the Netherlands; SK, Slovakia. Blue: number of units negative for MRSA (%). Orange: number of units positive for MRSA (%). Clonal complexes and spa‐types (number of isolates):
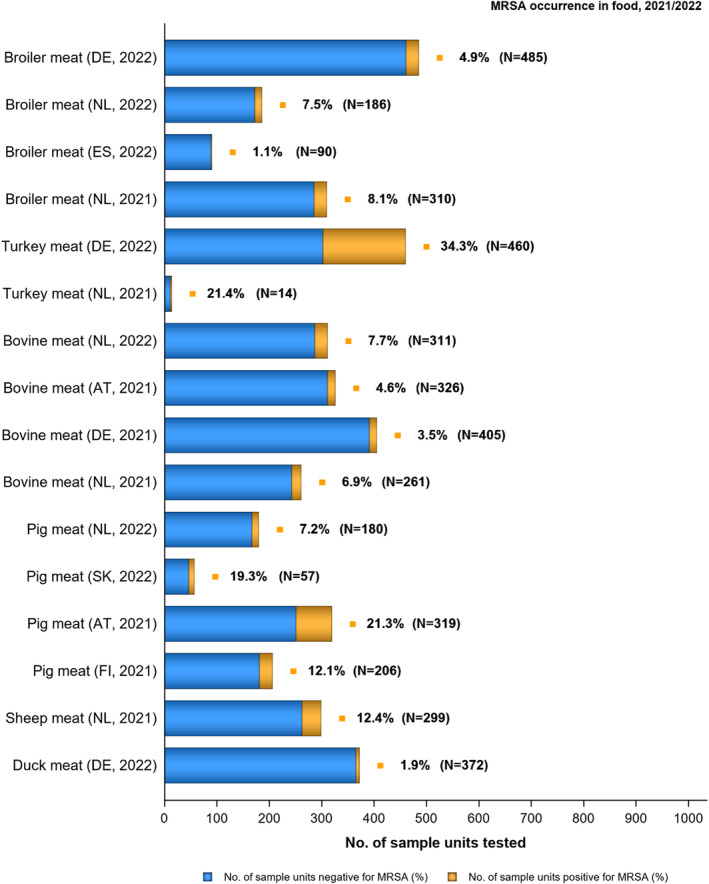
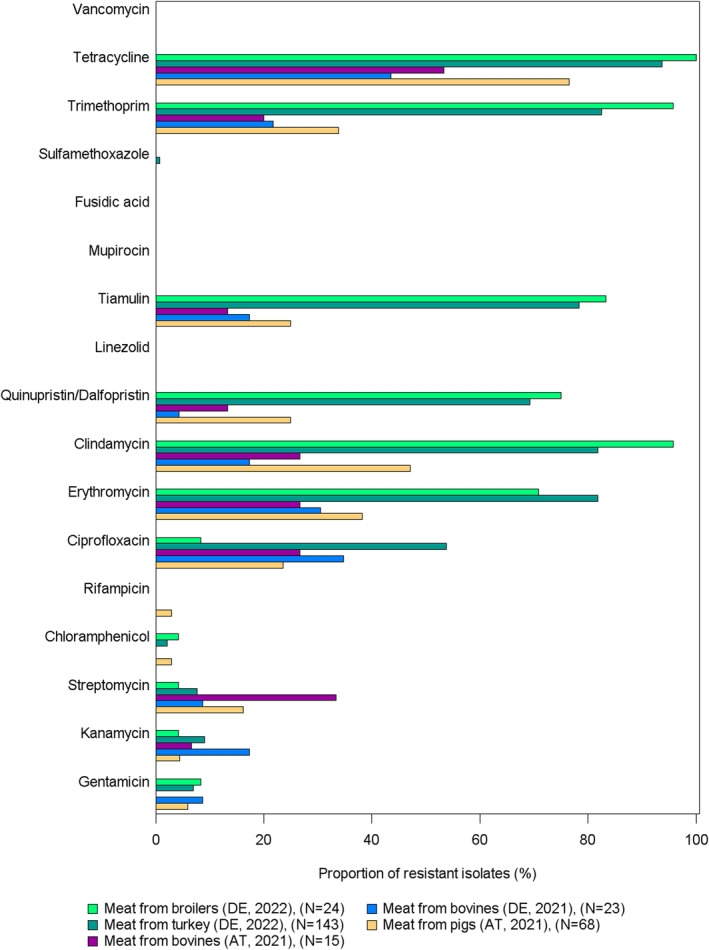
  1. Broiler meat (DE, 2022): t011 (2), t034 (17), t571 (2), t2011 (1), t 2330 (1), t10485 (1), all CC398

  2. Broiler meat (ES, 2022): CC398 spa‐type t6228 (1).

  3. Turkey meat (DE, 2022): t008 CC8 (1), t127 CC5 (1), CC398 spa‐types t011 (16), t034 (85), t899 (26), t1255 (1), t1422 (3), t1430 (3), t1580 (1), t2011 (2), t5452 (2), t10204 (2).

  4. Bovine meat (AT, 2021): CC45 spa‐type t095 (7), CC398 spa‐types t011 (4), t034 (2), CC121 spa‐type t898 (1), CC1 spa‐type t588 (1).

  5. Bovine meat (DE, 2021): CC1 spa‐types t174 (1), t559 (1), CC9 spa‐type t1430 (1), CC97 spa‐types t359 (1), CC130 spa‐type t843 mecC positive (1), CC9/CC398 spa‐type t899 (1), CC398 spa‐types t011 (4), t034 (4), t1451 (1).

  6. Pig meat (AT, 2021): CC9/CC398 spa‐type t899 (5), CC9 spa‐type t1430 (2), CC45 spa‐type t095 (11), CC398 spa‐types t011 (24), t034 (12), t1793 (1), t2576 (1), t9013 (1), t588 (1), t571 (1), no spa‐type reported (1).

  7. Pig meat (FI, 2021): CC45 spa‐type t728 (1), CC398 spa‐types t034 (14), t899 (1), t2741 (9), t4677 (1).

Note: sheep meat reported by NL in 2021 were from meat preparation (n = 44) and fresh meat (n = 255); bovine meat reported by NL in 2022 were from meat preparation (n = 147) and fresh meat (n = 164). In 2021, MRSA was also detected in meat from duck (n = 1). In 2022, MRSA was also detected in meat from wild gamebirds (n = 1), meat from farmed game‐land mammals (n = 2) and meat from other animal species or not specified (n = 1): as only a limited number of samples were collected and these categories are not included in the figure.
FIGURE 55
FIGURE 55
Methicillin‐resistant Staphylococcus aureus occurrence in food, 2021/2022. Note: Only food origins where positive isolates were obtained and countries investigating > 10 samples are presented in this graph. The isolation method used for detection of MRSA is not considered in this analysis. N, Total number of sample units tested; AT, Austria; DE, Germany; FI, Finland; NL, the Netherlands; ES, Spain. Blue: number of units negative for MRSA (%). Orange: number of units positive for MRSA (%). Clonal complexes and spa‐types (number of isolates):
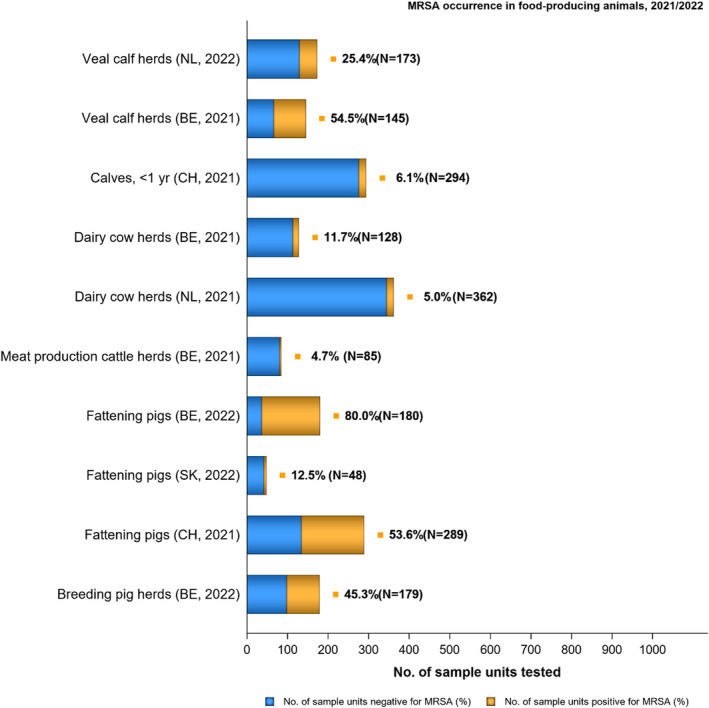
  1. Veal calves (BE, 2021): CC1 spa‐type t386 (1), CC398 spa‐types t011 (65), t034 (6), t1451 (1), t1456 (1), t2346 (1), t2370 (1), t3423 (1), t5210 (1), t6228 (1).

  2. Dairy cows (BE, 2021): CC8 spa‐type t037 (3), CC398 spa‐types t011 (10), t034 (2).

  3. Production cattle (BE, 2021): CC8 spa‐type t037 (2), CC398 spa‐type t011 (2).

  4. Fattening pigs (BE, 2022): CC398 spa‐types t011 (63), t034 (26), t779 (1), t1255 (1), t1451 (1), t1580 (2), t2011 (2), t3423 (1), no spa‐type reported (1). Breeding pigs (BE, 2022): CC398 spa‐types t011 (46), t034 (16), t588 (1), t1451 (1), t1457 (1), t2011 (3), t3423 (1), t5104 (1), t6575 (1), t15528 (1).

Note: Norway tested a high number of pig herds in 2021 (n = 763) and 2022 (n = 591), but no MRSA were detected.
FIGURE 56
FIGURE 56
Methicillin‐resistant Staphylococcus aureus types reported from food and animals in 2021 and 2022, inferred from molecular typing data. Note: N, number of reported isolates with typing data. HA‐MRSA, hospital‐associated MRSA; CA‐MRSA, community‐associated MRSA; LA‐MRSA, livestock‐associated MRSA; CC: clonal complex. The category ‘likely LA‐MRSA’ includes CC692 associated with birds (Monecke et al., 2016). The category ‘non‐CC398, LA‐MRSA’ includes CC9, CC97, CC121 and CC130 (Bal et al., 2016). One CC130 isolate categorised as ‘non‐CC398, LA‐MRSA’, carried the mecC gene. The category ‘HA‐MRSA’ includes CC5, CC8 ST247, CC8 t008, CC8 t009 and CC45 (Bal et al., ; Boost et al., ; Cuny et al., 2016). The category ‘CA‐MRSA’ includes CC1 and CC8 ST72 (Bal et al., ; Earls et al., 2021). Molecular typing data included spa‐type information, except for one isolate from pigs in Belgium, two isolates from turkey meat in Germany, nine isolates from pig meat in Austria, 17 isolates from cattle under 1 year of age from Switzerland and 155 isolates from pigs in Switzerland where only information on CC and/or ST was provided. If data on CC was not provided, the CC was inferred based on findings in the literature. Detailed information on mec‐genes, spa‐types, STs and CCs reported and CCs inferred are shown in Tables 8, 9 in Annex E.
FIGURE 57
FIGURE 57
Antimicrobial resistance in methicillin‐resistant Staphylococcus aureus in food, 2021 and 2022. Note: AT: Austria; DE: Germany; ES: Spain. All isolates were resistant to penicillin and cefoxitin.
FIGURE A.1
FIGURE A.1
Resistance levels among MDR Salmonella Kentucky isolates exhibiting high‐level ciprofloxacin resistance from food‐producing animals, reported by MSs in 2021–2022.
FIGURE A.2
FIGURE A.2
Number of Salmonella isolates displaying high‐level ciprofloxacin resistance by serovar, reported from the different food‐producing animal populations by MSs in 2021–2022.
FIGURE B.1
FIGURE B.1
Commonly reported Salmonella serovars recovered from broilers, laying hens, fattening turkeys, fattening pigs and cattle under 1 year of age (calves), for all reporting countries, 2021–2022. Note: *Monophasic S. Typhimurium includes all antigenic formulas; serovars in the legend are listed according to their predominance within all the animal origins.
FIGURE B.2
FIGURE B.2
Proportions of isolates completely susceptible (green), resistant to one or two antimicrobial classes (gold) and MDR (red) in Salmonella spp. and certain serovars recovered from (A) broilers, (B) laying hens and (C) fattening turkeys for all reporting countries, 2022. Note: N, total number of Salmonella spp. isolates or total number of particular serovars tested; *monophasic S. Typhimurium includes antigenic formulas. The MDR analysis of animal isolates included the following antimicrobials: ampicillin, cefotaxime/ceftazidime, chloramphenicol, ciprofloxacin/nalidixic acid, gentamicin/amikacin, meropenem, sulfamethoxazole, tetracycline/ tigecycline and trimethoprim.
FIGURE B.3
FIGURE B.3
Proportions of isolates completely susceptible (green), resistant to one or two antimicrobial classes (gold) and MDR (red) in Salmonella spp. and certain serovars recovered from (A) fattening pigs, and (B) cattle under 1 year of age (calves), for all reporting countries, 2021. Note: N, total number of Salmonella spp. isolates or total number of particular serovars tested; *monophasic S. Typhimurium includes antigenic formulas. The MDR analysis of animal isolates included the following antimicrobials: ampicillin, cefotaxime/ceftazidime, chloramphenicol, ciprofloxacin/nalidixic acid, gentamicin/amikacin, meropenem, sulfamethoxazole, tetracycline/tigecycline and trimethoprim.
FIGURE B.4
FIGURE B.4
Proportions of certain serovars exhibiting multidrug resistance to overall MDR levels in Salmonella spp. recovered from each of the food‐producing animal populations, for all reporting countries in 2021–2022. Note: N: Total number of Salmonella isolates exhibiting MDR; serovars contributing the highest levels of MDR to overall MDR levels in Salmonella spp. are illustrated with a percentage; *monophasic S. Typhimurium includes antigenic formulas; serovars in the legend are listed according to their predominance within all the animal origins.
FIGURE C.1
FIGURE C.1
Comparison of CBPs and ECOFFs used to interpret MIC data reported for Salmonella spp. from humans, animals or food. Note: EFSA Manual for reporting 2022 antimicrobial resistance data within the framework of Directive 2003/99/EC and Decision 2020/1729/EU. Only R category included.
FIGURE C.2
FIGURE C.2
Occurrence of resistance to selected antimicrobials in S.Infantis from humans (2022) and animal populations reporting ≥ 10 isolates (2021–2022), all reporting MSs.
FIGURE C.3
FIGURE C.3
Occurrence of resistance to selected antimicrobials in S. Enteritidis from humans (2022) and animal populations reporting ≥ 10 isolates (2021–2022), all reporting MSs.
FIGURE C.4
FIGURE C.4
Occurrence of resistance to selected antimicrobials in Salmonella Kentucky from humans (2022) and animal populations reporting ≥ 10 isolates (2021–2022), all reporting MSs.
FIGURE C.5
FIGURE C.5
Occurrence of resistance to selected antimicrobials in Salmonella Typhimurium from humans (2022) and animal populations reporting ≥ 10 isolates (2021–2022), all reporting MSs.
FIGURE C.6
FIGURE C.6
Occurrence of resistance to selected antimicrobials in monophasic Salmonella Typhimurium from humans (2022) and animal populations reporting ≥ 10 isolates (2021–2022), all reporting MSs.
FIGURE D.1
FIGURE D.1
Temporal trends in resistance to colistin in indicator commensal E. coli from caecal samples from broilers, 26 EU MSs and 3 non‐MSs, 2009–2022.
FIGURE D.2
FIGURE D.2
Temporal trends in resistance to colistin in indicator commensal E. coli from caecal samples from fattening turkeys (turkeys), eight EU MSs and one non‐MS, 2014–2022.
FIGURE D.3
FIGURE D.3
Temporal trends in resistance to colistin in indicator commensal E. coli from caecal samples from fattening pigs, 27 EU MSs and 4 non‐MSs, 2009–2021.
FIGURE D.4
FIGURE D.4
Temporal trends in resistance to colistin in indicator commensal E. coli from caecal samples from cattle under 1 year of age, 10 EU MSs and 3 non‐MSs, 2009–2021.
FIGURE F.1
FIGURE F.1
Phenotypes inferred based on the resistance to the beta‐lactams included in Panel 2.

Similar articles

Cited by

References

    1. Abdullahi, I. N. , Fernández‐Fernández, R. , Juárez‐Fernández, G. , Martínez‐Álvarez, S. , Eguizábal, P. , Zarazaga, M. , Lozano, C. , & Torres, C. (2021). Wild animals are reservoirs and sentinels of Staphylococcus aureus and MRSA clones: A problem with “one health” concern. Antibiotics, 10(12), 1556. 10.3390/antibiotics10121556 - DOI - PMC - PubMed
    1. Adur, M. A. , Châtre, P. , Métayer, V. , Drapeau, A. , Pillonetto, M. , Penkal, M. L. , Lopes, J. K. , Beirão, B. C. B. , Madec, J.‐Y. , Freitas de Macedo, R. E. , & Haenni, M. (2022). Escherichia coli ST224 and IncF/blaCTX‐M‐55 plasmids drive resistance to extended‐spectrum cephalosporins in poultry flocks in Parana, Brazil. International Journal of Food Microbiology, 380(109885). 10.1016/j.ijfoodmicro.2022.109885 - DOI - PubMed
    1. Agersø, Y. , Torpdahl, M. , Zachariasen, C. , Seyfarth, A. , Hammerum, A. M. , & Nielsen, E. M. (2012). Tentative colistin epidemiological cut‐off value for salmonella spp. Foodborne Pathogens and Disease, 9(4), 367–369. 10.1089/fpd.2011.1015 - DOI - PubMed
    1. Alba, P. , Feltrin, F. , Cordaro, G. , Porrero, M. C. , Kraushaar, B. , Argudín, M. A. , Nykäsenoja, S. , Monaco, M. , Stegger, M. , Aarestrup, F. M. , Butaye, P. , Franco, A. , & Battisti, A. (2015). Livestock‐associated methicillin resistant and methicillin susceptible Staphylococcus aureus sequence type (CC)1 in European farmed animals: High genetic relatedness of isolates from Italian cattle herds and humans. PLoS One, 10(8), e0137143. 10.1371/journal.pone.0137143 - DOI - PMC - PubMed
    1. Alba, P. , Leekitcharoenphon, P. , Carfora, V. , Amoruso, R. , Cordaro, G. , Di Matteo, P. , Ianzano, A. , Iurescia, M. , Diaconu, E. L. , Engage‐Eurl‐Ar Network Study Group , Pedersen, S. K. , Guerra, B. , Hendriksen, R. S. , Franco, A. , & Battisti, A. (2020). Molecular epidemiology of salmonella Infantis in Europe: Insights into the success of the bacterial host and its parasitic pESI‐like megaplasmid. Microbial. Genomics, 6(5), e000365. 10.1099/mgen.0.000365 - DOI - PMC - PubMed

LinkOut - more resources