

Genomic analysis of fruit size and shape traits in apple: unveiling candidate genes through GWAS analysis
- PMID: 38419968
- PMCID: PMC10901474
- DOI: 10.1093/hr/uhad270
Genomic analysis of fruit size and shape traits in apple: unveiling candidate genes through GWAS analysis
Abstract
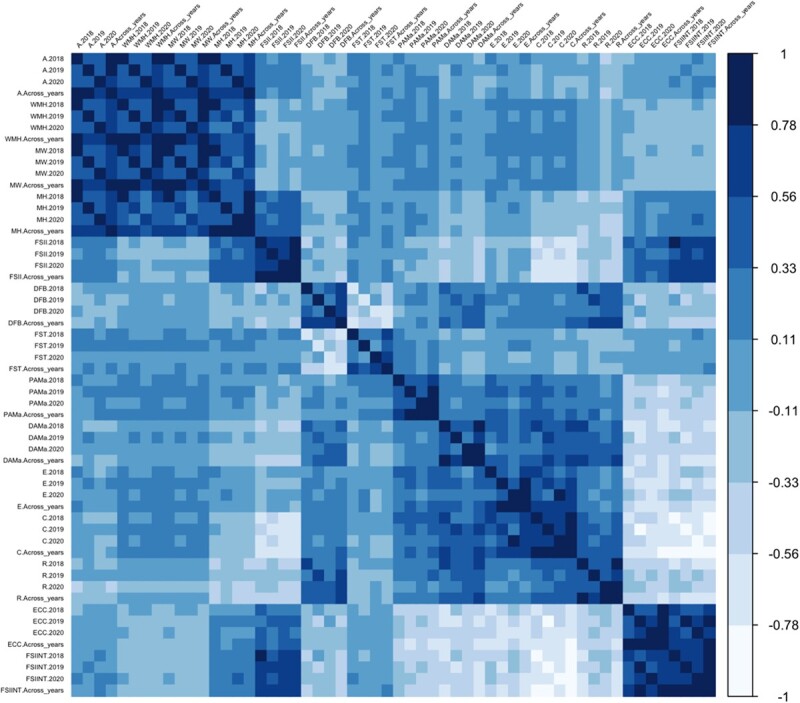
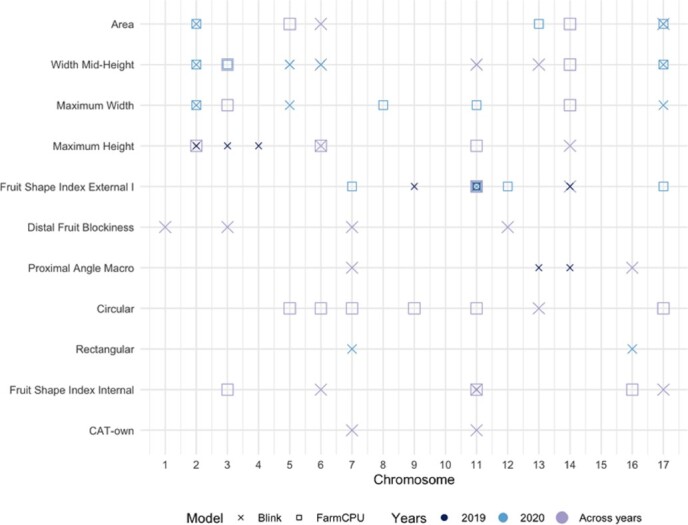
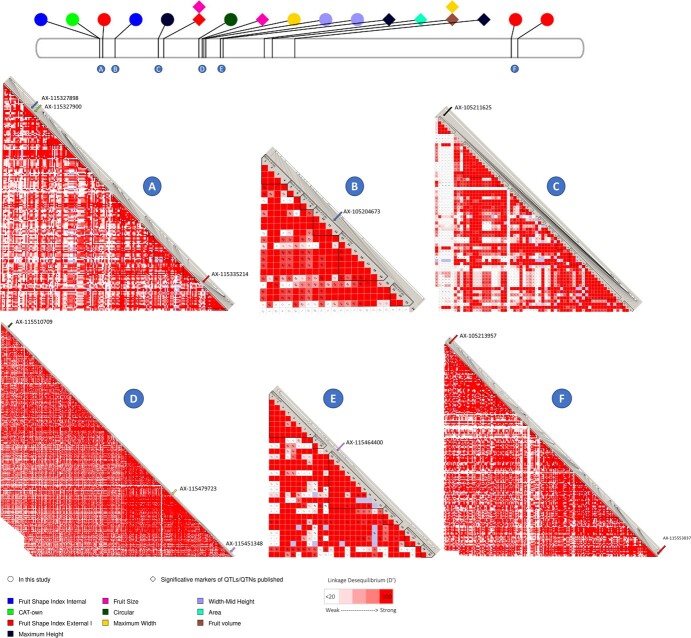
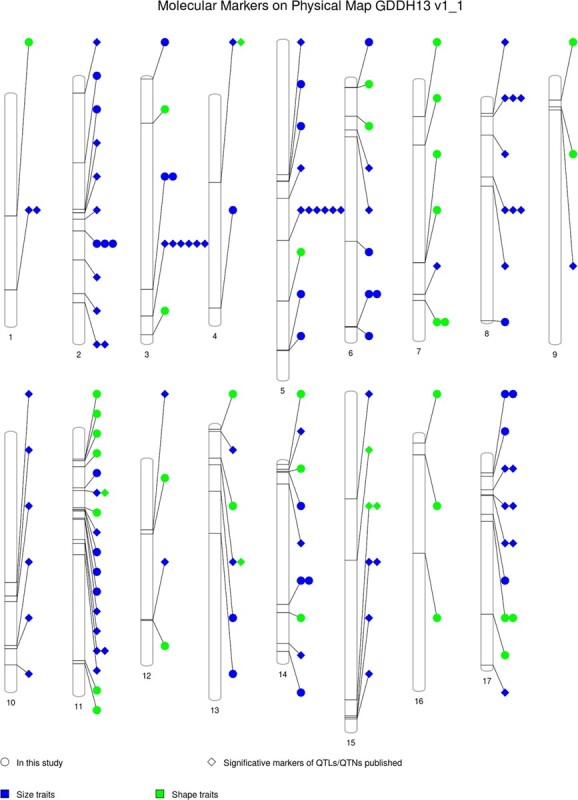
Genomic tools facilitate the efficient selection of improved genetic materials within a breeding program. Here, we focus on two apple fruit quality traits: shape and size. We utilized data from 11 fruit morphology parameters gathered across three years of harvest from 355 genotypes of the apple REFPOP collection, which serves as a representative sample of the genetic variability present in European-cultivated apples. The data were then employed for genome-wide association studies (GWAS) using the FarmCPU and the BLINK models. The analysis identified 59 SNPs associated with fruit size and shape traits (35 with FarmCPU and 45 with BLINK) responsible for 71 QTNs. These QTNs were distributed across all chromosomes except for chromosomes 10 and 15. Thirty-four QTNs, identified by 27 SNPs, were related for size traits, and 37 QTNs, identified by 26 SNPs, were related to shape attributes. The definition of the haploblocks containing the most relevant SNPs served to propose candidate genes, among them the genes of the ovate family protein MdOFP17 and MdOFP4 that were in a 9.7kb haploblock on Chromosome 11. RNA-seq data revealed low or null expression of these genes in the oblong cultivar "Skovfoged" and higher expression in the flat "Grand'mere." The Gene Ontology enrichment analysis support a role of OFPs and hormones in shape regulation. In conclusion, this comprehensive GWAS analysis of the apple REFPOP collection has revealed promising genetic markers and candidate genes associated with apple fruit shape and size attributes, providing valuable insights that could enhance the efficiency of future breeding programs.
© The Author(s) 2024. Published by Oxford University Press on behalf of Nanjing Agricultural University.
Conflict of interest statement
None declared.
Figures


Similar articles
-
The genetic basis of apple shape and size unraveled by digital phenotyping.G3 (Bethesda). 2024 May 7;14(5):jkae045. doi: 10.1093/g3journal/jkae045. G3 (Bethesda). 2024. PMID: 38441135 Free PMC article.
-
Exploring Genomic Regions Associated with Fruit Traits in Pepper: Insights from Multiple GWAS Models.Int J Mol Sci. 2024 Nov 4;25(21):11836. doi: 10.3390/ijms252111836. Int J Mol Sci. 2024. PMID: 39519386 Free PMC article.
-
GWAS and genomic prediction for pre-harvest sprouting tolerance involving sprouting score and two other related traits in spring wheat.Mol Breed. 2023 Feb 20;43(3):14. doi: 10.1007/s11032-023-01357-5. eCollection 2023 Mar. Mol Breed. 2023. PMID: 37313293 Free PMC article.
-
Research Progress on Genetic Basis of Fruit Quality Traits in Apple (Malus × domestica).Front Plant Sci. 2022 Jul 14;13:918202. doi: 10.3389/fpls.2022.918202. eCollection 2022. Front Plant Sci. 2022. PMID: 35909724 Free PMC article. Review.
-
[Genome-wide association analysis of agronomic traits related to eggplant fruits: a review].Sheng Wu Gong Cheng Xue Bao. 2024 Jan 25;40(1):94-103. doi: 10.13345/j.cjb.230159. Sheng Wu Gong Cheng Xue Bao. 2024. PMID: 38258634 Review. Chinese.
Cited by
-
Comprehensive genetic diversity and genome-wide association studies revealed the genetic basis of avocado fruit quality traits.Front Plant Sci. 2024 Aug 13;15:1433436. doi: 10.3389/fpls.2024.1433436. eCollection 2024. Front Plant Sci. 2024. PMID: 39193209 Free PMC article.
-
The genetic basis of apple shape and size unraveled by digital phenotyping.G3 (Bethesda). 2024 May 7;14(5):jkae045. doi: 10.1093/g3journal/jkae045. G3 (Bethesda). 2024. PMID: 38441135 Free PMC article.
-
A genome-wide association study identified SNP markers and candidate genes associated with morphometric fruit quality traits in mangoes.BMC Genomics. 2025 Feb 7;26(1):120. doi: 10.1186/s12864-025-11278-6. BMC Genomics. 2025. PMID: 39920570 Free PMC article.
References
-
- Daccord N, Celton JM, Linsmith G. et al. . High-quality de novo assembly of the apple genome and methylome dynamics of early fruit development. Nat Genet. 2017;49:1099–106 - PubMed
-
- Gross BL, Henk AD, Richards CM. et al. . Genetic diversity in Malus×domestica (Rosaceae) through time in response to domestication. Am J Bot. 2014;101:1770–9 - PubMed
LinkOut - more resources
Full Text Sources
