

Social determinants of spatial inequalities in COVID-19 outcomes across England: A multiscale geographically weighted regression analysis
- PMID: 38420111
- PMCID: PMC10899060
- DOI: 10.1016/j.ssmph.2024.101621
Social determinants of spatial inequalities in COVID-19 outcomes across England: A multiscale geographically weighted regression analysis
Abstract
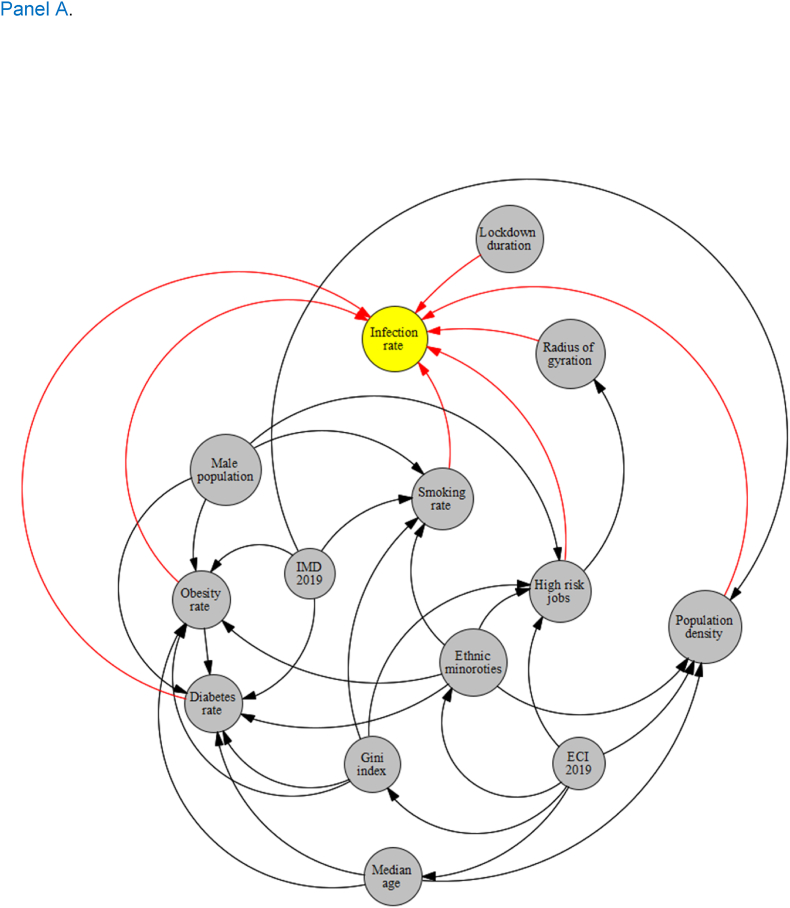
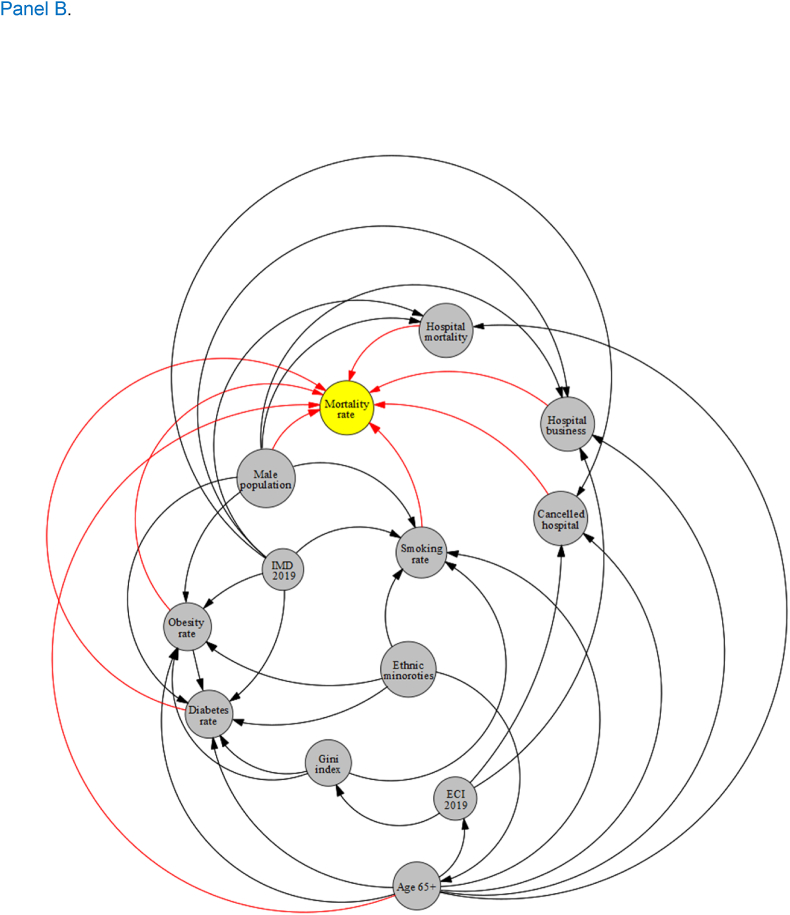
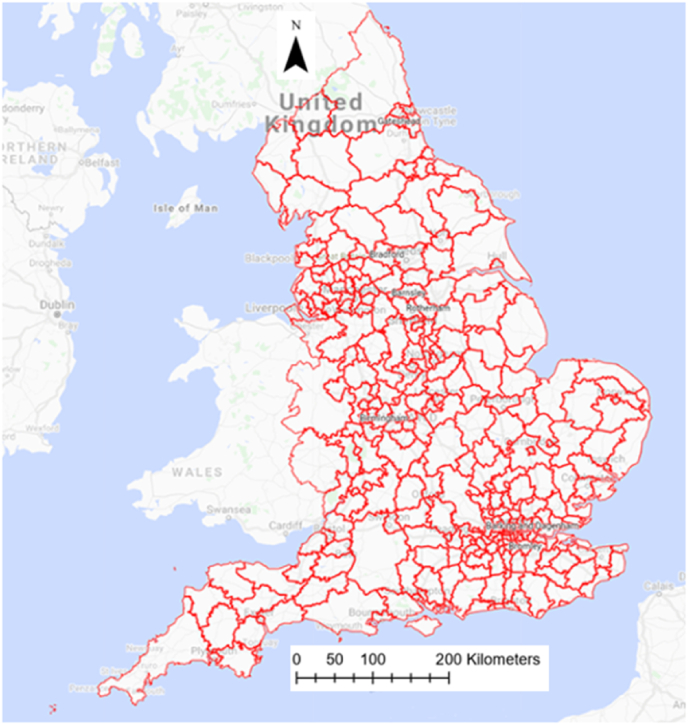
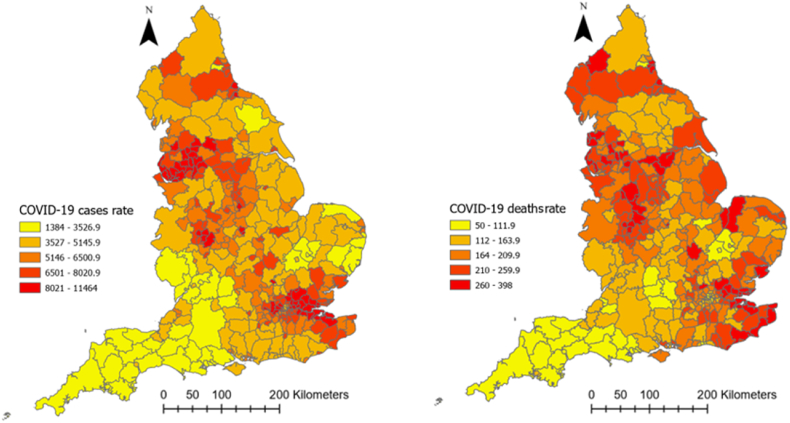
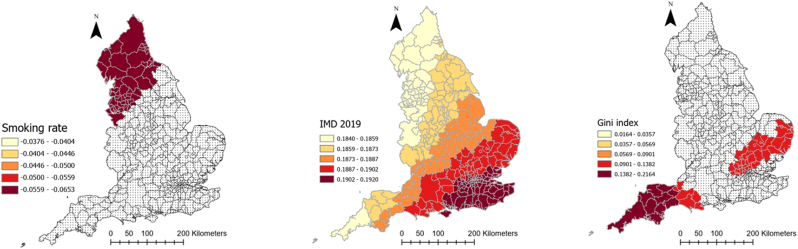
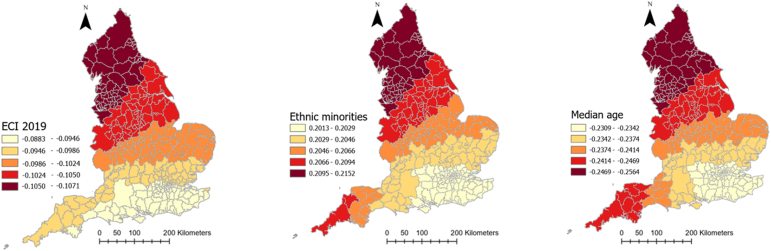
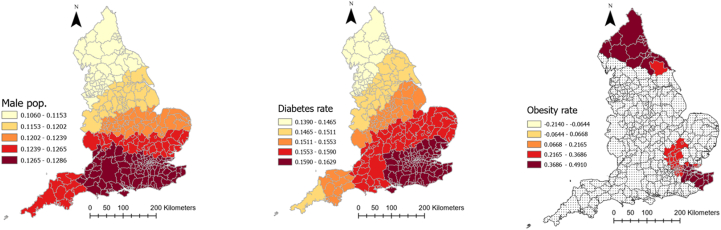
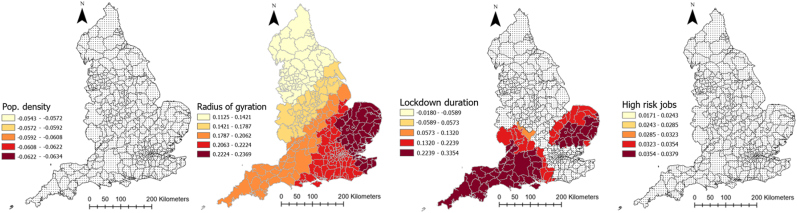
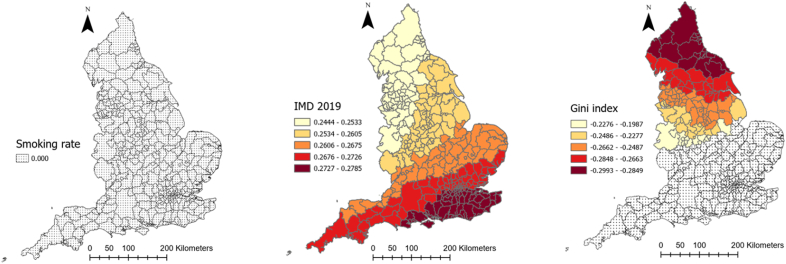
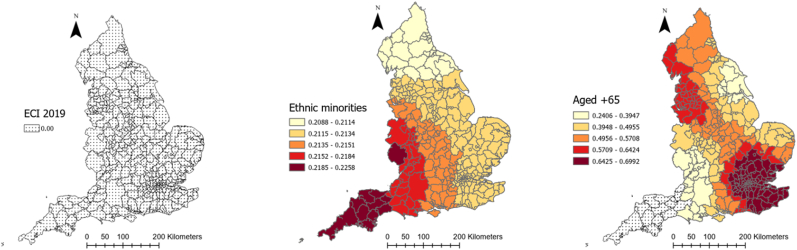
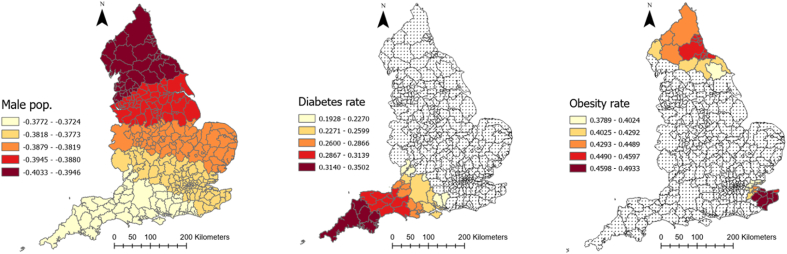
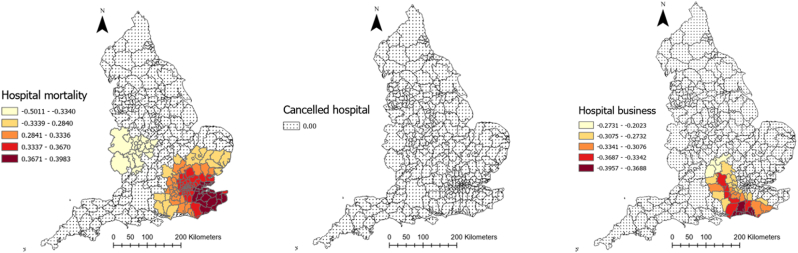
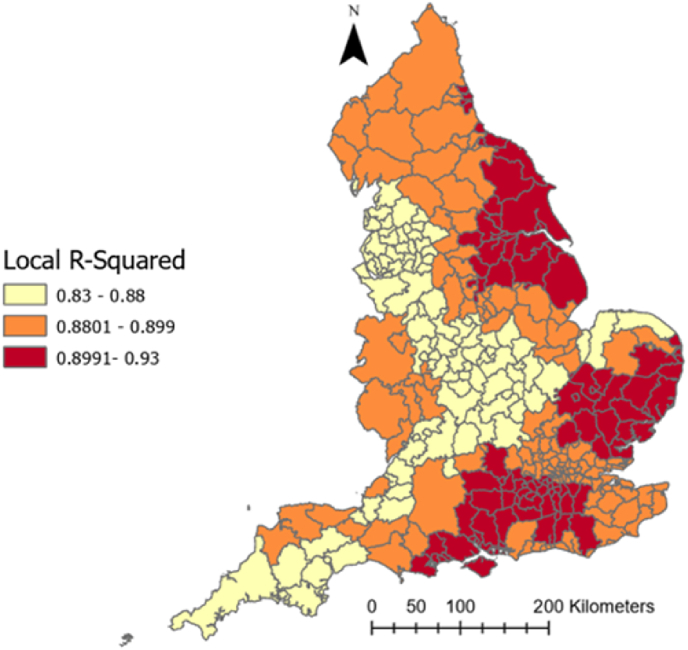
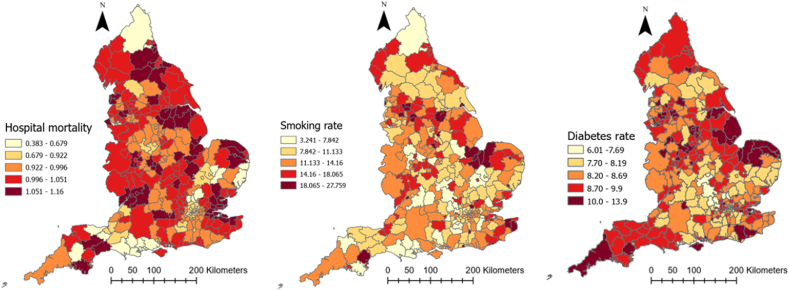
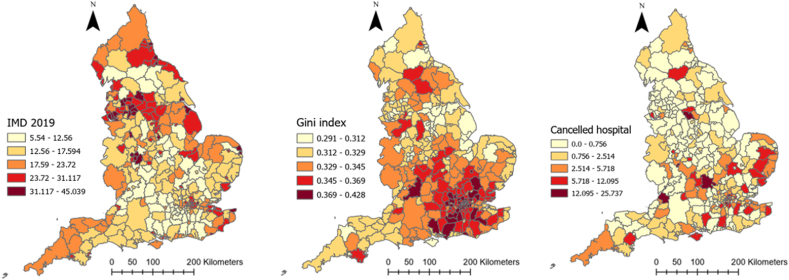
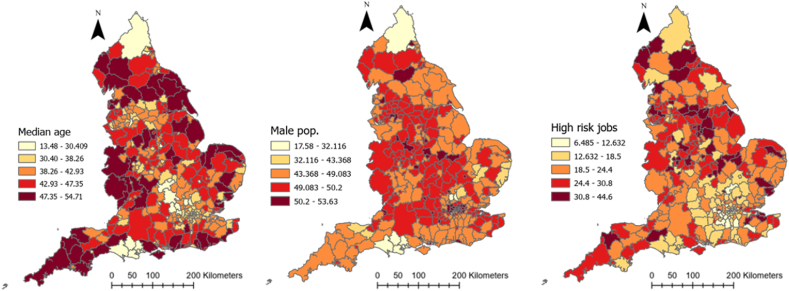
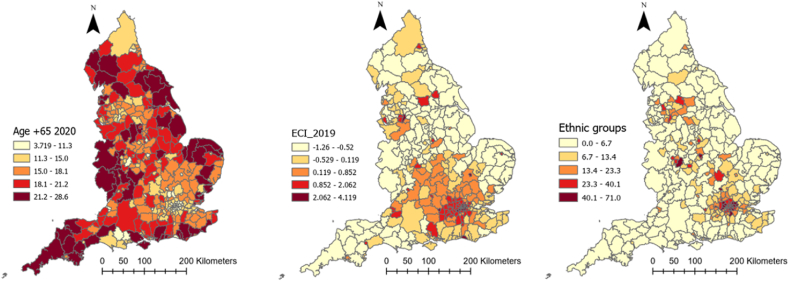
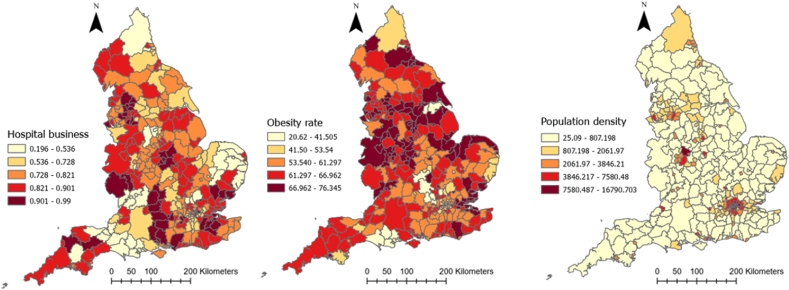
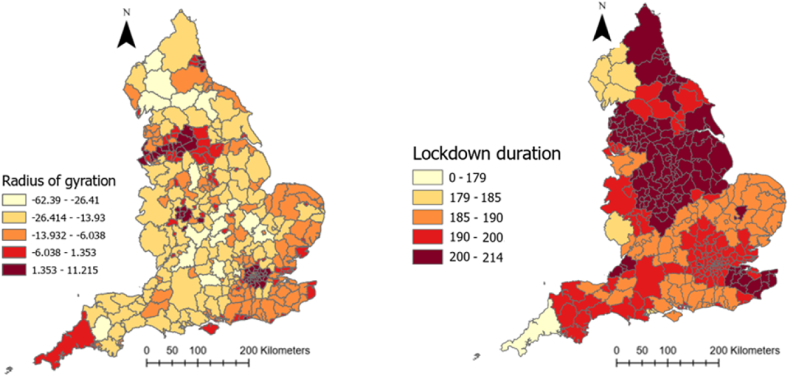
A variety of factors are associated with greater COVID-19 morbidity or mortality, due to how these factors influence exposure to (in the case of morbidity) or severity of (in the case of mortality) COVID-19 infections. We use multiscale geographically weighted regression to study spatial variation in the factors associated with COVID-19 morbidity and mortality rates at the local authority level across England (UK). We investigate the period between March 2020 and March 2021, prior to the rollout of the COVID-19 vaccination program. We consider a variety of factors including demographic (e.g. age, gender, and ethnicity), health (e.g. rates of smoking, obesity, and diabetes), social (e.g. Index of Multiple Deprivation), and economic (e.g. the Gini coefficient and economic complexity index) factors that have previously been found to impact COVID-19 morbidity and mortality. The Index of Multiple Deprivation has a significant impact on COVID-19 cases and deaths in all local authorities, although the effect is the strongest in the south of England. Higher proportions of ethnic minorities are associated with higher levels of COVID-19 mortality, with the strongest effect being found in the west of England. There is again a similar pattern in terms of cases, but strongest in the north of the country. Other factors including age and gender are also found to have significant effects on COVID-19 morbidity and mortality, with differential spatial effects across the country. The results provide insights into how national and local policymakers can take account of localized factors to address spatial health inequalities and address future infectious disease pandemics.
Keywords: COVID-19; Deprivation; Multiscale geographically weighted regression; Spatial inequalities; United Kingdom.
© 2024 The Authors.
Conflict of interest statement
The authors declare that they have no known competing financial interests or personal relationships that could have appeared to influence the work reported in this paper.
Figures
Similar articles
-
Spatial patterns of COVID-19 and non-COVID-19 mortality across waves of infection in England, Wales, and Scotland.Soc Sci Med. 2023 Dec;338:116330. doi: 10.1016/j.socscimed.2023.116330. Epub 2023 Oct 17. Soc Sci Med. 2023. PMID: 37907058
-
Continuing inequalities in COVID-19 mortality in England and Wales, and the changing importance of regional, over local, deprivation.Health Place. 2022 Jul;76:102848. doi: 10.1016/j.healthplace.2022.102848. Epub 2022 Jun 21. Health Place. 2022. PMID: 35759952 Free PMC article.
-
Spatial determinants of excess all-cause mortality during the first wave of the COVID-19 epidemic in France.BMC Public Health. 2021 Nov 24;21(1):2157. doi: 10.1186/s12889-021-12203-8. BMC Public Health. 2021. PMID: 34819057 Free PMC article.
-
Inequalities in excess premature mortality in England during the COVID-19 pandemic: a cross-sectional analysis of cumulative excess mortality by area deprivation and ethnicity.BMJ Open. 2021 Dec 23;11(12):e052646. doi: 10.1136/bmjopen-2021-052646. BMJ Open. 2021. PMID: 34949618 Free PMC article.
-
Impact of a social prescribing intervention in North East England on adults with type 2 diabetes: the SPRING_NE multimethod study.Public Health Res (Southampt). 2023 Mar;11(2):1-185. doi: 10.3310/AQXC8219. Public Health Res (Southampt). 2023. PMID: 37254700
Cited by
-
A comparative analysis of COVID-19 seroprevalence rates, observed infection rates, and infection-related mortality.Front Public Health. 2025 Jan 28;13:1504524. doi: 10.3389/fpubh.2025.1504524. eCollection 2025. Front Public Health. 2025. PMID: 39980922 Free PMC article.
References
-
- Bollyky T.J., Hulland E.N., Barber R.M., Collins J.K., Kiernan S., Moses M., et al. Pandemic preparedness and COVID-19: an exploratory analysis of infection and fatality rates, and contextual factors associated with preparedness in 177 countries, from Jan 1, 2020, to Sept 30. The Lancet. 2022;399(10334):1489–1512. - PMC - PubMed
-
- Bourdin S., Levratto N. The spatial footprint of COVID-19 and local policy answers. Regional Studies. 2023:1–8.
LinkOut - more resources
Full Text Sources
