. 2024 Feb 13:15:1325024.
doi: 10.3389/fimmu.2024.1325024. eCollection 2024.

Chicken γδ T cells proliferate upon IL-2 and IL-12 treatment and show a restricted receptor repertoire in cell culture

Affiliations

Chicken γδ T cells proliferate upon IL-2 and IL-12 treatment and show a restricted receptor repertoire in cell culture

Antonia E Linti et al. Front Immunol. .

Abstract

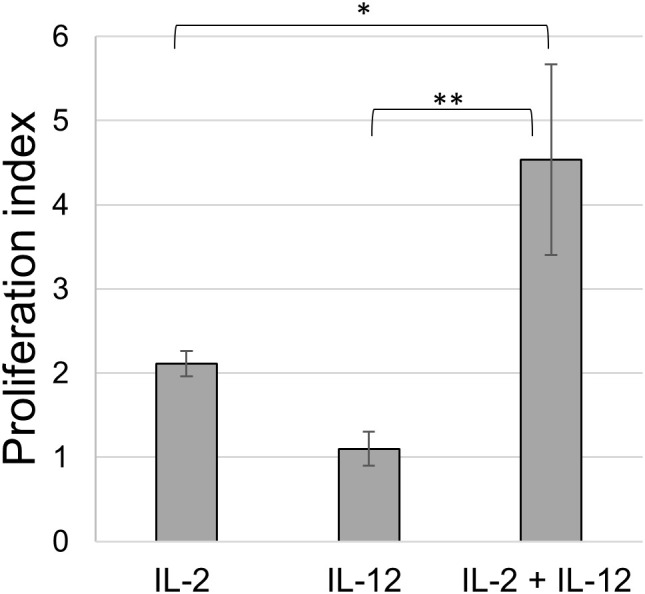
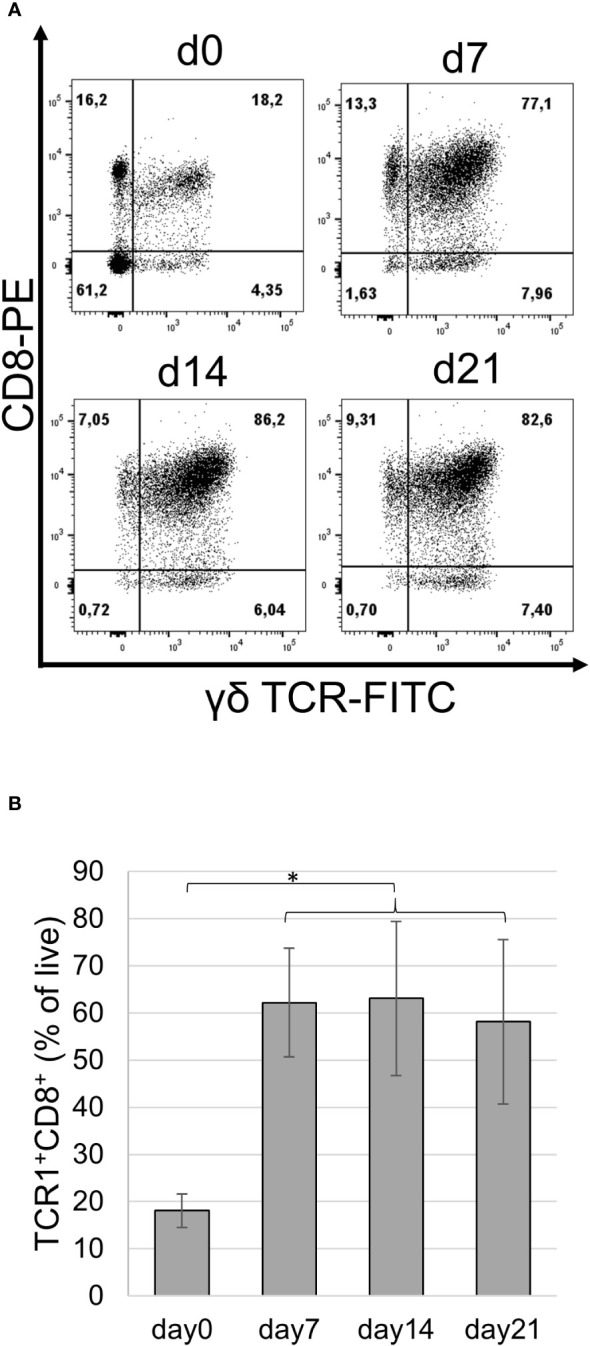
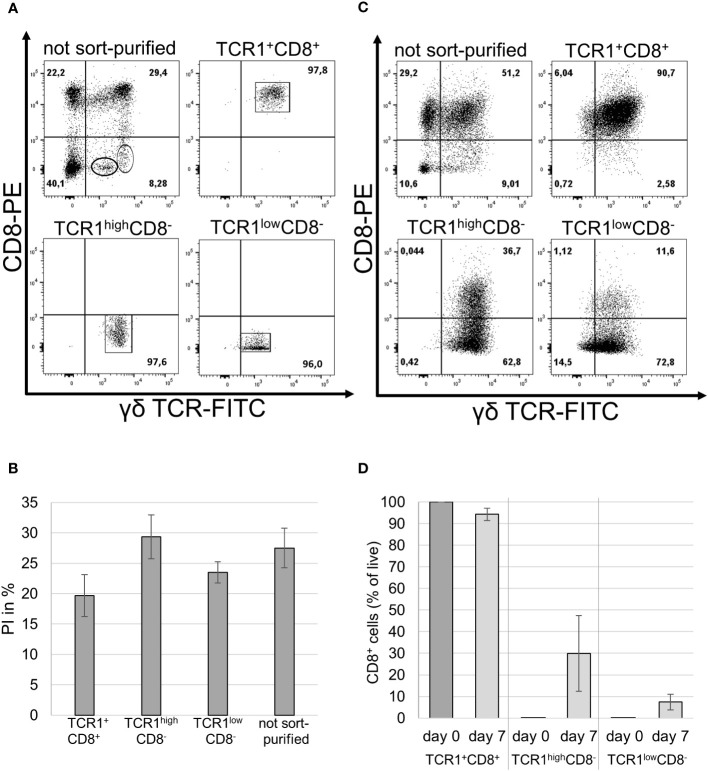
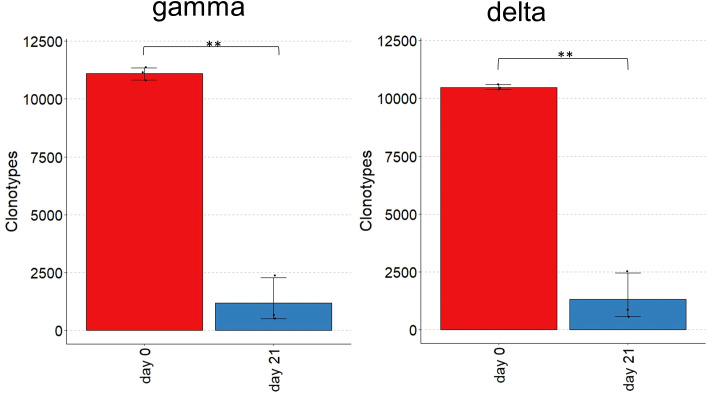
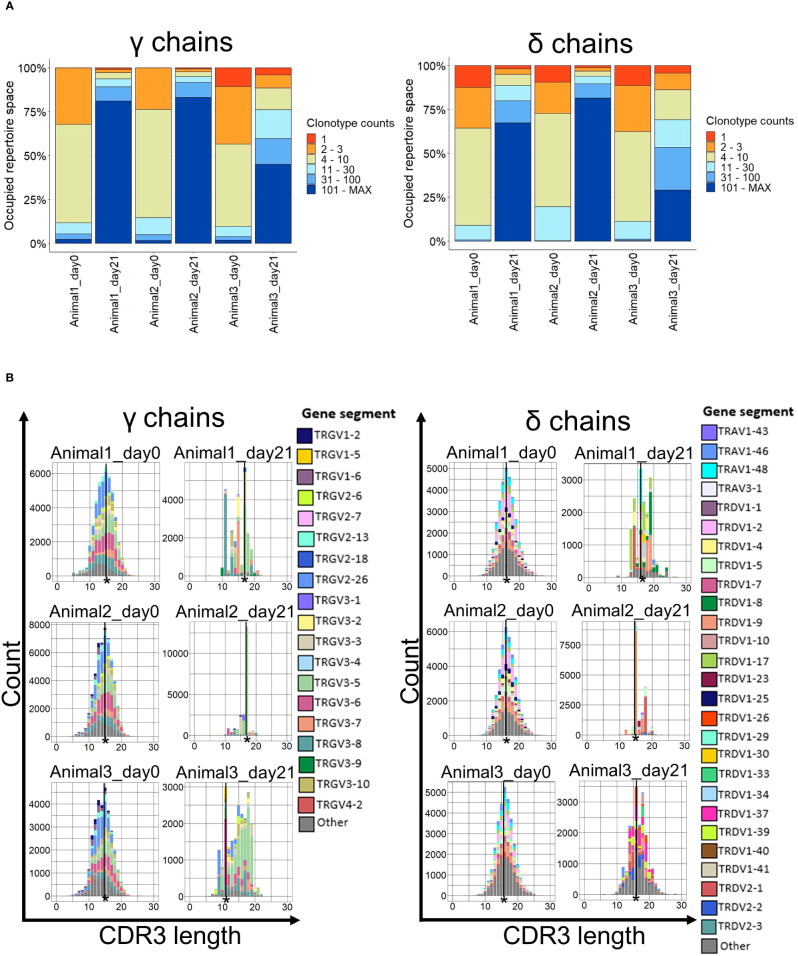
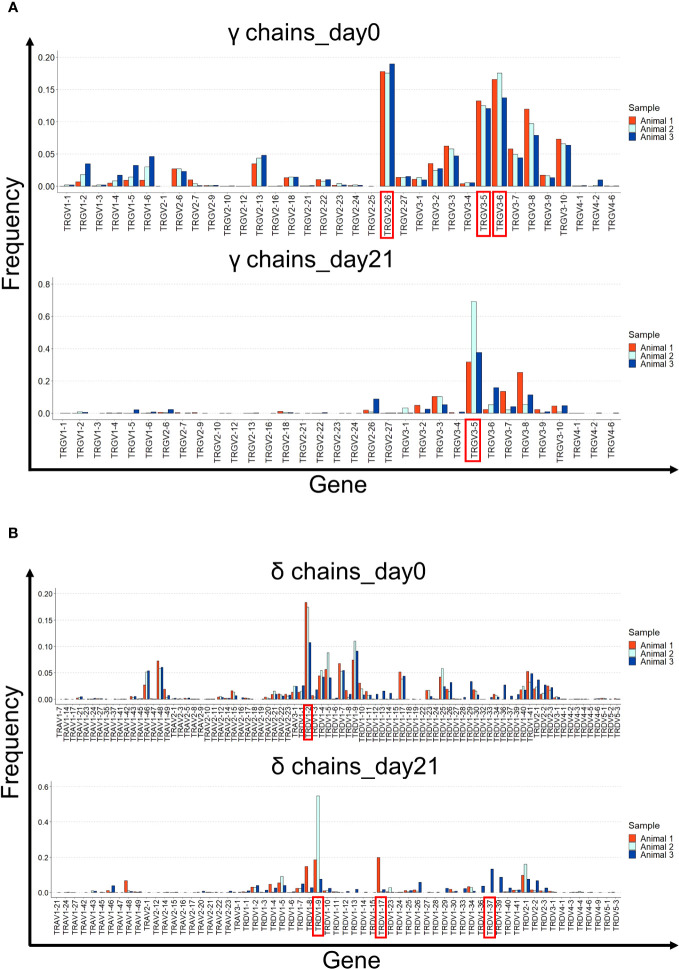
In chickens, γδ T cells represent a large fraction of peripheral T cells; however, their function remains largely unknown. Here, we describe the selective in vitro expansion of γδ T cells from total splenocytes by stimulation with the cytokines IL-2 and IL-12. Under these conditions, γδ T cells proliferated preferentially and reached frequencies of >95% within three weeks. Although IL-2 alone also triggered proliferation, an increased proliferation rate was observed in combination with IL-12. Most of the expanded cells were γδ TCR and CD8 double-positive. Splenocytes sorted into TCR1+CD8+, TCR1highCD8-, and TCR1lowCD8- subsets proliferated well upon dual stimulation with IL-2/IL-12, indicating that none of the three γδ T cell subsets require bystander activation for proliferation. TCR1+CD8+ cells maintained CD8 surface expression during stimulation, whereas CD8- subpopulations showed varied levels of CD8 upregulation, with the highest upregulation observed in the TCR1high subset. Changes in the γδ T-cell receptor repertoire during cell culture from day 0 to day 21 were analyzed by next-generation sequencing of the γδ variable regions. Overall, long-term culture led to a restricted γ and δ chain repertoire, characterized by a reduced number of unique variable region clonotypes, and specific V genes were enriched at day 21. On day 0, the δ chain repertoire was highly diverse, and the predominant clonotypes differed between animals, while the most frequent γ-chain clonotypes were shared between animals. However, on day 21, the most frequent clonotypes in both the γ and δ chain repertoires were different between animals, indicating that selective expansion of dominant clonotypes during stimulation seems to be an individual outcome. In conclusion, IL-2 and IL-12 were sufficient to stimulate the in vitro outgrowth of γδ T cells. Analyses of the TCR repertoire indicate that the culture leads to an expansion of individual T cell clones, which may reflect previous in vivo activation. This system will be instrumental in studying γδ T cell function.

Keywords: IL-12; IL-2; TCR repertoire analysis; chicken γδ TCR; in vitro culture; γδ T cell subsets.


Conflict of interest statement

The authors declare that the research was conducted in the absence of any commercial or financial relationships that could be construed as a potential conflict of interest.

Figures

Figure 1
Figure 1
Proliferation of splenocytes upon cytokine stimulation. BrdU assay of splenocytes stimulated with IL-2 alone (1:800), IL-12 alone (1:80) and of a combination of both (IL-2 1:800 and IL-12 1:80); animals = 3. Mean ± SD. p-values as indicated, *p ≤0.05, **p ≤0.01.
Figure 2
Figure 2
Phenotype of IL-2/IL-12 stimulated splenocytes. Splenocytes were stained with TCR1 and CT8 mAbs before culture and on days 7, 14, and 21 (d0, d7, d14, and d21) following repetitive cytokine stimulation. (A) Frequency of cell populations as a percentage of live single cells is indicated. Data from one female chicken representative of three experiments are shown. (B) Frequency of TCR1+CD8+ cells over time in cultured splenocytes from three different animals. Mean ± SD; p-values as indicated, *p ≤0.05.
Figure 3
Figure 3
Phenotype of IL-2/IL-12 stimulated sort-purified γδ T cell populations. (A) Purified splenocytes were stained prior to sorting using TCR1 and CT8 mAbs (top left panel) and the purity of the three sorted γδ T cell populations after sort-purification (other panels). One representative experiment is shown, with the frequencies indicated. n = 3 biological replicates. (B) The BrdU assay of sort-purified and unpurified cells stimulated with IL-2/-12. PI was expressed as the percentage of total proliferation. Mean ± SD; n = 3 biological replicates; p-values after statistical analysis of the rlu/s of the stimulated sorted and unsorted populations showed no significant differences in their proliferation capacities (p >0.05 = ns). (C) Frequency of IL-2/IL-12 stimulated sort-purified and unpurified populations stained after 7 days in cell culture using TCR1 and CT8 mAbs. One representative of three experiments is shown. (D) Frequency of TCR1+CD8+ cells in the three sorted subpopulations on day 0 and after 7 days in cell culture with IL-2 and IL-12. n = 3 male animals. Mean ± SD.
Figure 4
Figure 4
Number of unique clonotypes in TCR γ and δ repertoires of cultured splenocytes. Barplot showing the number of unique clonotypes before and after IL-2/IL-12 stimulation of splenocytes on days 0 and 21. n = 3 biological replicates; p-values as indicated, ** = p ≤0.01.
Figure 5
Figure 5
Clonality and CDR3 spectratypes of TCR γ and δ repertoires. (A) The occupied repertoire space of clonotype groups based on the total count of each unique clonotype in percent. n = 3 biological replicates; (B) CDR3 spectratypes (Histograms of the CDR3 lengths in amino acids with the number of occurrences on the y-axis) of the γ and δ chains on days 0 and 21. n = 3 biological replicates. The most common CDR3 length is indicated (*).
Figure 6
Figure 6
V gene usage in the γ and δ chain repertoires of cultured splenocytes. (A) Gene usage of the different Vγ segments is shown for the three animals on days 0 and 21 of cell culture. (B) Gene usage of the different Vδ segments is shown for the three animals on days 0 and 21 of cell culture. The most prevalent Vγ and Vδ segments are shown in red.

Similar articles

Cited by

References

    1. Davis MM, Bjorkman PJ. T-cell antigen receptor genes and T-cell recognition. Nature (1988) 334(6181):395–402. doi: 10.1038/334395a0 - DOI - PubMed
    1. Cooper MD, Chen CL, Bucy RP, Thompson CB. Avian T cell ontogeny. Adv Immunol (1991) 50:87–117. doi: 10.1016/s0065-2776(08)60823-8 - DOI - PubMed
    1. Chen CH, Six A, Kubota T, Tsuji S, Kong FK, Göbel TW, et al. . T cell receptors and T cell development. Curr Top Microbiol Immunol (1996) 212:37–53. doi: 10.1007/978-3-642-80057-3_5 - DOI - PubMed
    1. Liu F, Li J, Lin IYC, Yang X, Ma J, Chen Y, et al. . The genome resequencing of TCR loci in gallus gallus revealed their distinct evolutionary features in avians. Immunohorizons (2020) 4(1):33–46. doi: 10.4049/immunohorizons.1900095 - DOI - PubMed
    1. Zhang T, Liu G, Wei Z, Wang Y, Kang L, Jiang Y, et al. . Genomic organization of the chicken TCRβ locus originated by duplication of a Vβ segment combined with a trypsinogen gene. Vet Immunol Immunopathol (2020) 219:109974. doi: 10.1016/j.vetimm.2019.109974 - DOI - PubMed

Publication types