. 2024 Feb 14:15:1333995.
doi: 10.3389/fimmu.2024.1333995. eCollection 2024.

Exploring candidate biomarkers for rheumatoid arthritis through cardiovascular and cardiometabolic serum proteome profiling

Affiliations

Exploring candidate biomarkers for rheumatoid arthritis through cardiovascular and cardiometabolic serum proteome profiling

Laura Cuesta-López et al. Front Immunol. .

Abstract

Introduction: RA patients are at higher risk of cardiovascular disease, influenced by therapies. Studying their cardiovascular and cardiometabolic proteome can unveil biomarkers and insights into related biological pathways.

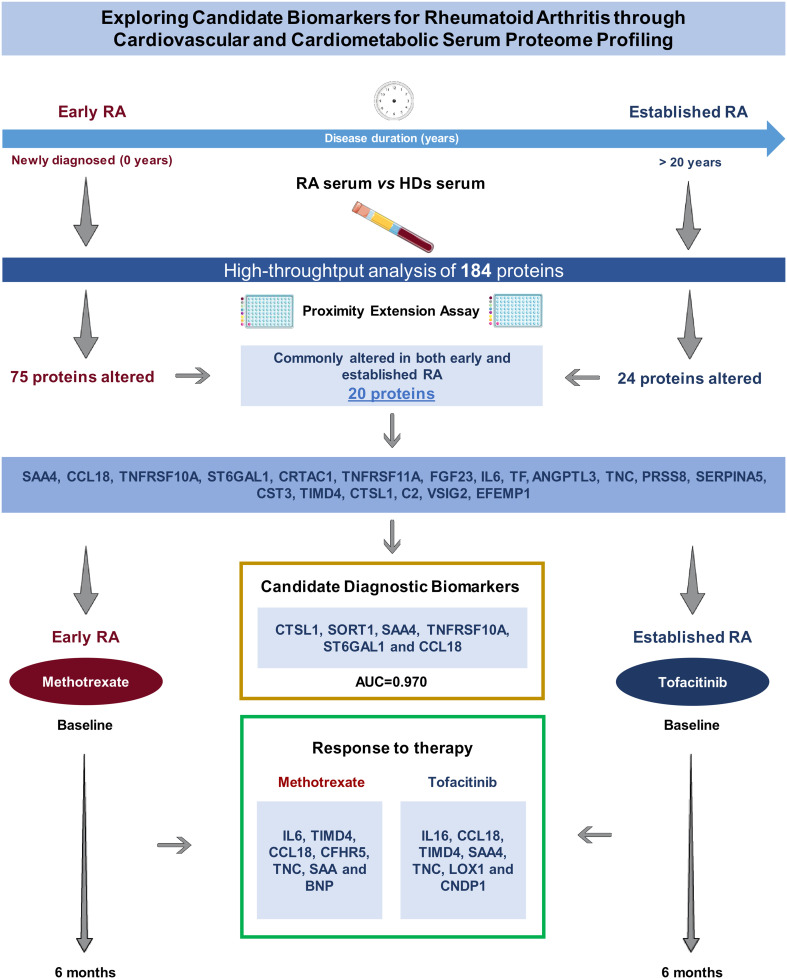
Methods: This study included two cohorts of RA patients: newly diagnosed individuals (n=25) and those with established RA (disease duration >25 years, n=25). Both cohorts were age and sex-matched with a control group (n=25). Additionally, a longitudinal investigation was conducted on a cohort of 25 RA patients treated with methotrexate and another cohort of 25 RA patients treated with tofacitinib for 6 months. Clinical and analytical variables were recorded, and serum profiling of 184 proteins was performed using the Olink technology platform.

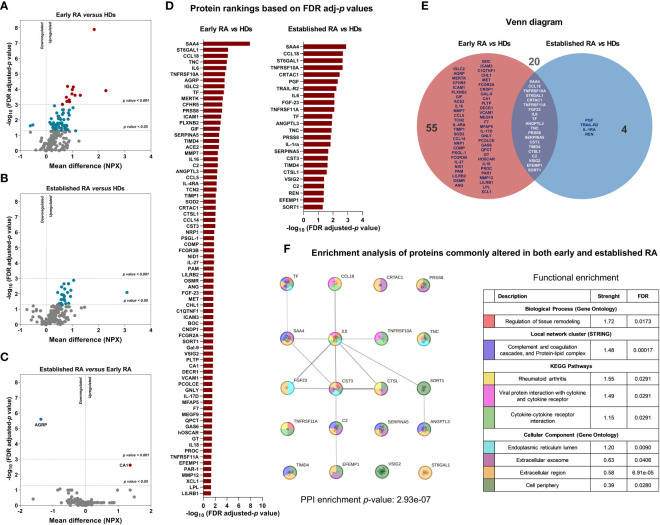
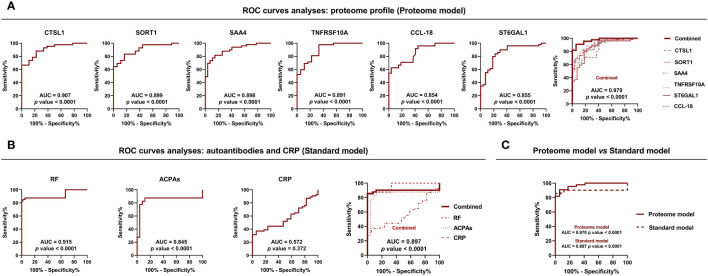
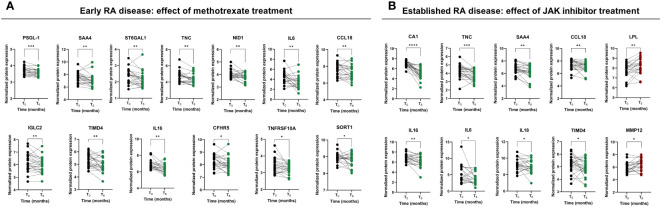
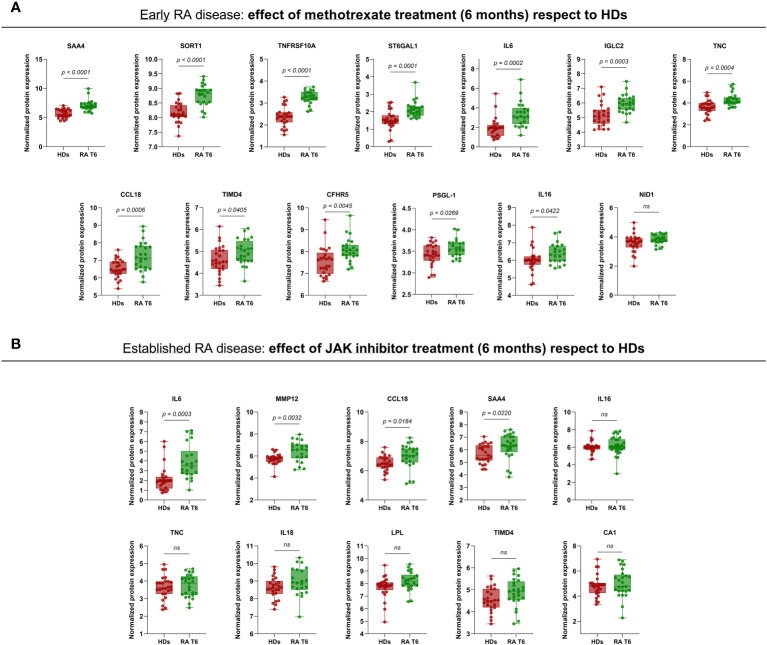
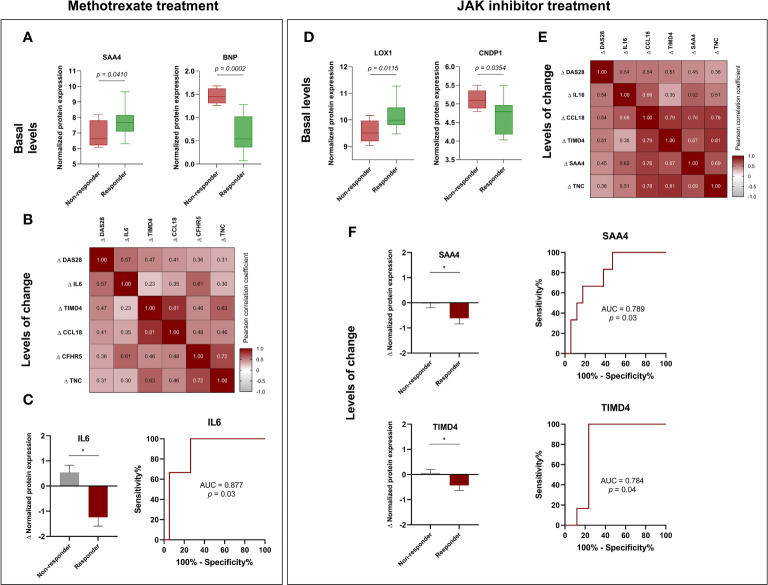
Results: RA patients exhibited elevated levels of 75 proteins that might be associated with cardiovascular disease. In addition, 24 proteins were increased in RA patients with established disease. Twenty proteins were commonly altered in both cohorts of RA patients. Among these, elevated levels of CTSL1, SORT1, SAA4, TNFRSF10A, ST6GAL1 and CCL18 discriminated RA patients and HDs with high specificity and sensitivity. Methotrexate treatment significantly reduced the levels of 13 proteins, while tofacitinib therapy modulated the expression of 10 proteins. These reductions were associated with a decrease in DAS28. Baseline levels of SAA4 and high levels of BNP were associated to the non-response to methotrexate. Changes in IL6 levels were specifically linked to the response to methotrexate. Regarding tofacitinib, differences in baseline levels of LOX1 and CNDP1 were noted between non-responder and responder RA patients. In addition, response to tofacitinib correlated with changes in SAA4 and TIMD4 levels.

Conclusion: In summary, this study pinpoints molecular changes linked to cardiovascular disease in RA and proposes candidate protein biomarkers for distinguishing RA patients from healthy individuals. It also highlights how methotrexate and tofacitinib impact these proteins, with distinct alterations corresponding to each drug's response, identifying potential candidates, as SAA4, for the response to these therapies.

Keywords: Olink; biomarkers; methotrexate; proximity extension assay (PEA); rheumatoid arthritis; tofacitinib.


Conflict of interest statement

CP-S, NB, YH, and J-MM-M were co-founders of Cobiomic Biosciences S.L. The remaining authors declare that the research was conducted in the absence of any commercial or financial relationships that could be construed as a potential conflict of interest.

Figures

Figure 1
Figure 1
CVD and cardiometabolic serum proteome profile of RA patients in early and established disease. (A) Volcano plot of CVD and cardiometabolic proteome profile (184 proteins) in early RA (n=25) respect to HDs (n=25). (B) Volcano plot of CVD and cardiometabolic proteome profile (184 proteins) in established RA (n=25) respect to HDs (n=25). (C) Volcano plot of CVD and cardiometabolic proteome profile (184 proteins) in established RA (n=25) respect to early RA (n=25). (D) Significant protein rankings based on FDR adjusted p-values in early RA and established RA compared to HDs. (E) Venn diagram illustrating the proteins commonly altered in both early RA and established RA in comparison to HDs. (F) Enrichment analysis of proteins commonly altered in both early and established RA using STRING platform (version 12.0, STRING CONSORTIUM 2023). CVD, cardiovascular disease; RA, rheumatoid arthritis, HDs, healthy donors. Annotated names of abbreviated proteins are displayed in Supplementary Table 1 .
Figure 2
Figure 2
Prospective serum biomarkers with diagnostic potential in RA. (A) ROC curve analysis of proteins significantly altered in both early and established disease in the whole cohort of RA patients with the best capacity to identify RA (n=50) vs HDs (n=25) (Proteome model). (B) ROC curve analysis of commonly used diagnostic markers for RA, such as ACPAs, RF, and CRP (n=50) vs HDs (n=25) (Standard model). (C) Comparison of the ability to differentiate between RA patients and HDs using proteomic and standard models. RA, rheumatoid arthritis; HDs, healthy donors; ACPAs, antibodies to citrullinated protein antigens; RF, rheumatoid factor; CRP, C-reactive protein; ROC, receiver operating characteristic; AUC, area under the curve. Annotated names of abbreviated proteins ( Supplementary Table 1 ).
Figure 3
Figure 3
Effect of methotrexate and JAK inhibitor treatments on the serum proteome profile in early and established RA patients, respectively. (A) CVD and cardiometabolic-related proteins modulated by the treatment with methotrexate after six months in early RA. (B) CVD and cardiometabolic-related proteins modulated by the treatment with methotrexate after six months in established RA. RA, rheumatoid arthritis; CVD, cardiovascular disease; ROC, receiver operating characteristic. Annotated names of abbreviated proteins ( Supplementary Table 1 ). Graphs of symbols and lines represent levels of analyzed proteins before and after the treatments. Statistical significance levels were designated as follows: (****) <0.0001 p-value; (***) <0.001 p-value; (**) <0.01 p-value; (*) <0.05 p-value.
Figure 4
Figure 4
Comparison of serum protein levels at 6 months with levels in healthy individuals. (A) Levels of proteins influenced by methotrexate in early RA patients compared to serum levels in healthy individuals. (B) Levels of proteins influenced by tofacitinib in established RA patients compared to serum levels in healthy individuals. RA, rheumatoid arthritis; RA T6, rheumatoid arthritis time 6 months; HDs, healthy donors; JAK, janus kinase. Annotated names of abbreviated proteins ( Supplementary Table 1 ). Box and whiskers plots represent median and minimum and maximum values of analyzed proteins. The adjusted p-values are presented using the Benjamini-Hochberg procedure.
Figure 5
Figure 5
Potential biomarkers for predicting response to methotrexate in early RA and JAK inhibitor treatment in established RA. (A) Baseline levels of SAA4 and BNP in methotrexate-treated patients: a comparison between responders and non-responders. (B) Correlation heatmap of changes in DAS28 and proteins after six months of treatment with methotrexate. (C) Comparison of changes (Δ) in IL6 levels in responders and non-responders RA patients and ROC curve of changes in IL6 levels to discriminate responders or non-responders RA patients after six months of treatment with methotrexate. (D) Baseline levels of LOX1 and CNDP1 in JAK inhibitor-treated patients: a comparison between responders and non-responders. (E) Correlation heatmap of changes (Δ) in DAS28 and proteins after six months of treatment with JAK inhibitor. (F) Comparison of changes (Δ) in SAA4 and TIMD4 levels in responders and non-responders RA patients after the treatment with JAK inhibitor and ROC curve analyses. RA, rheumatoid arthritis; ROC, receiver operating characteristic. Annotated names of abbreviated proteins ( Supplementary Table 1 ). Box and whiskers plots represent median and minimum and maximum values of basal proteins. Correlation heatmap represent significant correlations between disease activity and proteins. Numbers in correlation heatmaps include Pearson correlation coefficient (r). Bar graphs represent mean with standard deviation (error bars). *Significant differences: p<0.05. The adjusted p-values for the box plots did not demonstrate statistical significance, except in the case of the BNP protein, where the adjusted p-value was 0.037.
Figure 6
Figure 6
Study summary: A high-throughput analysis of 184 proteins across diverse stages of RA (early and established disease) uncovered a consistently altered pattern, indicating potential diagnostic biomarkers, including CTSL1, SORT1, SAA4, TNFRSF10A, ST6GAL1, and CCL18. Methotrexate was administered to early RA patients, while tofacitinib was employed for established RA cases. Post a 6-month treatment period, the levels of proteins exhibiting alterations in both early and established RA were modulated, pinpointing susceptible proteins that may serve as candidate biomarkers indicative of the response to therapy. Annotated names of abbreviated proteins ( Supplementary Table 1 ). RA, rheumatoid arthritis; HDs, healthy donors; AUC, area under the curve.

References

    1. Han C, Robinson DW, Jr, Hackett MV, Paramore LC, Fraeman KH, Bala MV. Cardiovascular disease and risk factors in patients with rheumatoid arthritis, psoriatic arthritis, and ankylosing spondylitis. J Rheumatol (2006) 33:2167–72. - PubMed
    1. Figus FA, Piga M, Azzolin I, McConnell R, Iagnocco A. Rheumatoid arthritis: Extra-articular manifestations and comorbidities. Autoimmun Rev (2021) 20:102776. doi: 10.1016/j.autrev.2021.102776 - DOI - PubMed
    1. Karvounaris SA, Sidiropoulos PI, Papadakis JA, Spanakis EK, Bertsias GK, Kritikos HD, et al. . Metabolic syndrome is common among middle-to-older aged Mediterranean patients with rheumatoid arthritis and correlates with disease activity: a retrospective, cross-sectional, controlled, study. Ann Rheum Dis (2007) 66:28–33. doi: 10.1136/ard.2006.053488 - DOI - PMC - PubMed
    1. Chung CP, Oeser A, Solus JF, Avalos I, Gebretsadik T, Shintani A, et al. . Prevalence of the metabolic syndrome is increased in rheumatoid arthritis and is associated with coronary atherosclerosis. Atherosclerosis (2008) 196:756–6. doi: 10.1016/j.atherosclerosis.2007.01.004 - DOI - PubMed
    1. de la Rosa IA, Escudero-Contreras A, Rodríguez-Cuenca S, Ruiz-Ponce M, Jiménez-Gómez Y, Ruiz-Limón P, et al. . Defective glucose and lipid metabolism in rheumatoid arthritis is determined by chronic inflammation in metabolic tissues. J Intern Med (2018) 248:61–77. doi: 10.1111/joim.12743 - DOI - PubMed

Publication types

MeSH terms