. 2024 Feb 28;5(3):e503.
doi: 10.1002/mco2.503. eCollection 2024 Mar.

Reticulon 3 deficiency ameliorates post-myocardial infarction heart failure by alleviating mitochondrial dysfunction and inflammation

Affiliations

Reticulon 3 deficiency ameliorates post-myocardial infarction heart failure by alleviating mitochondrial dysfunction and inflammation

Bingchao Qi et al. MedComm (2020). .

Abstract

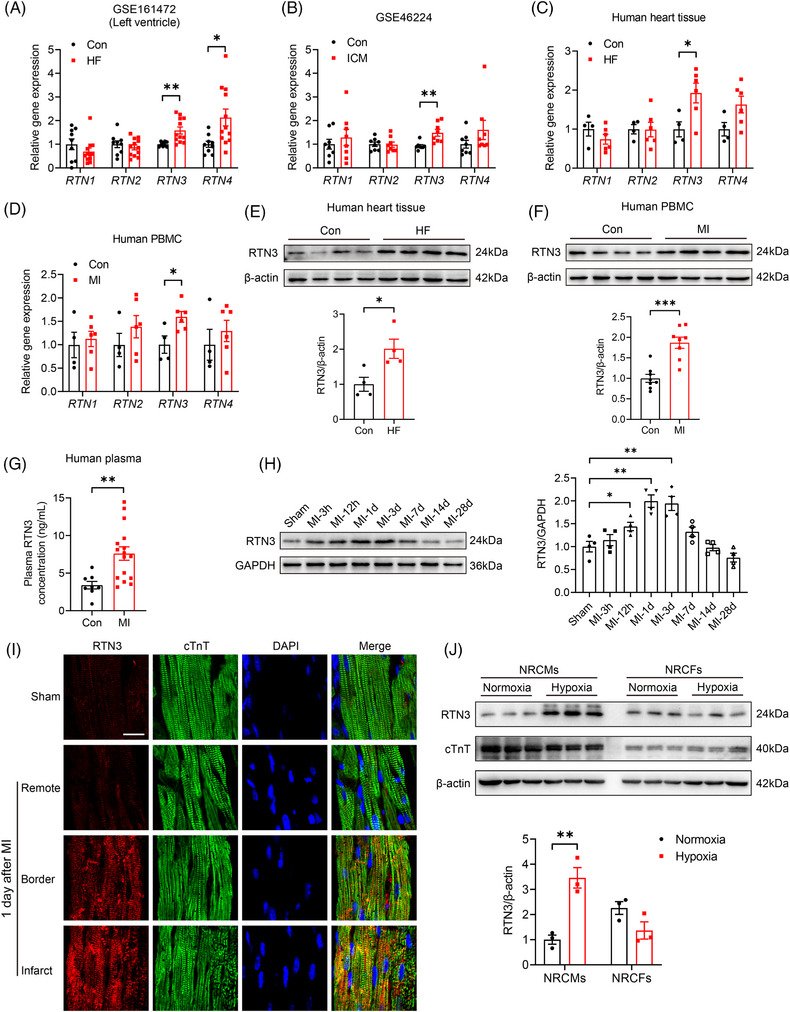
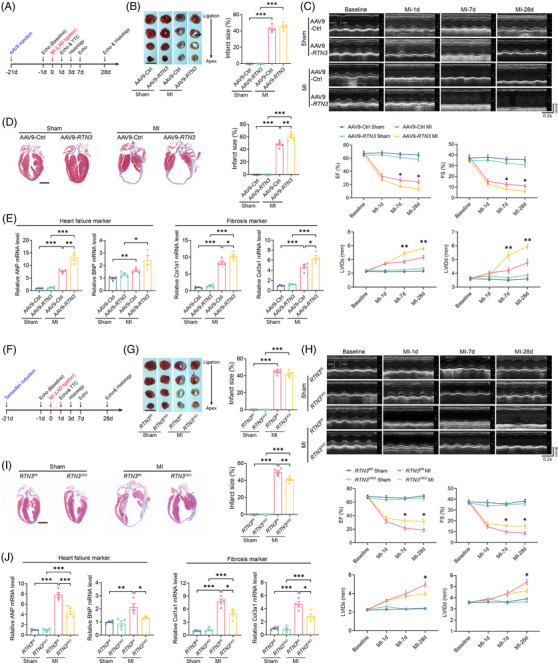
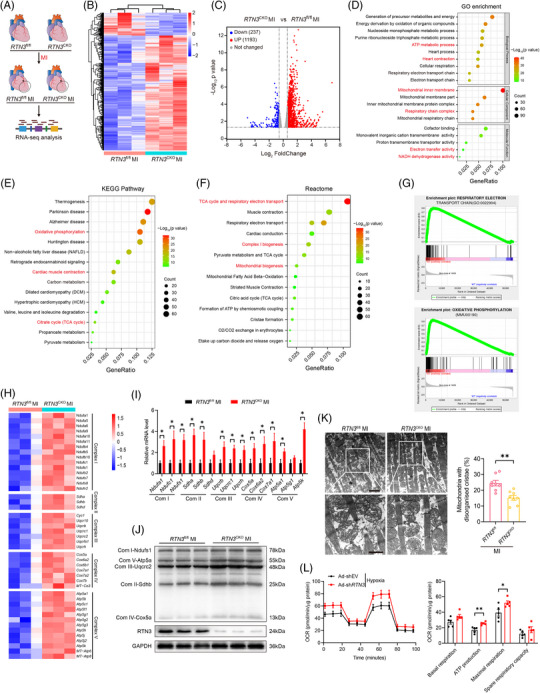
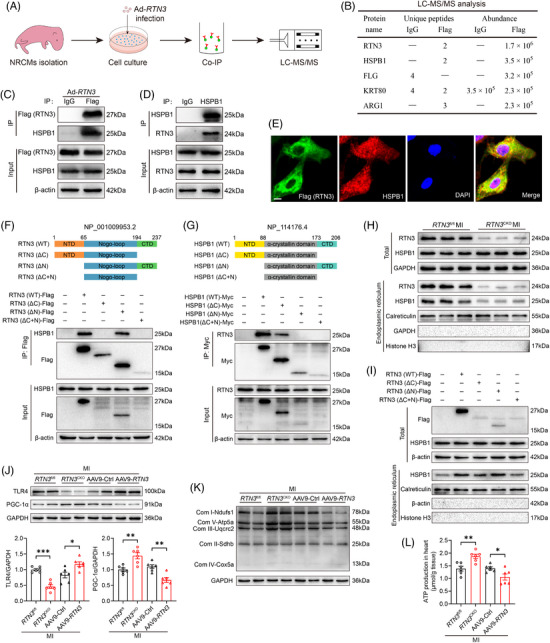
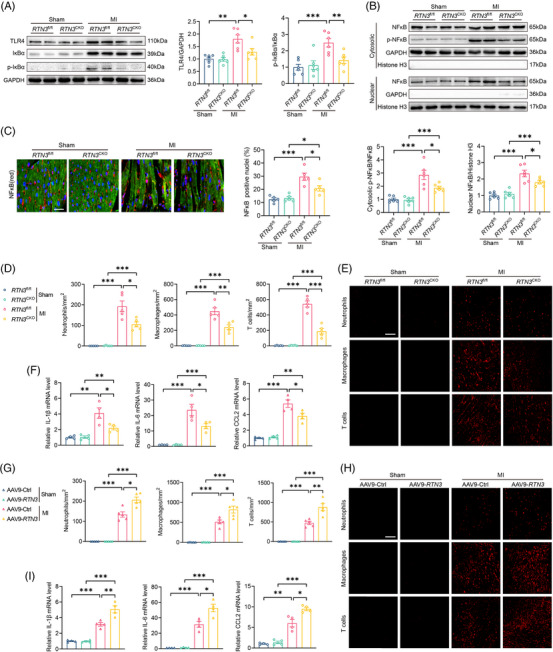
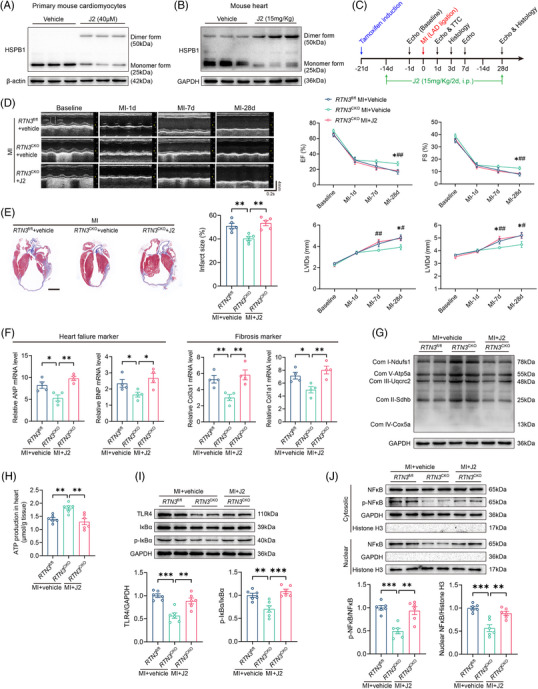
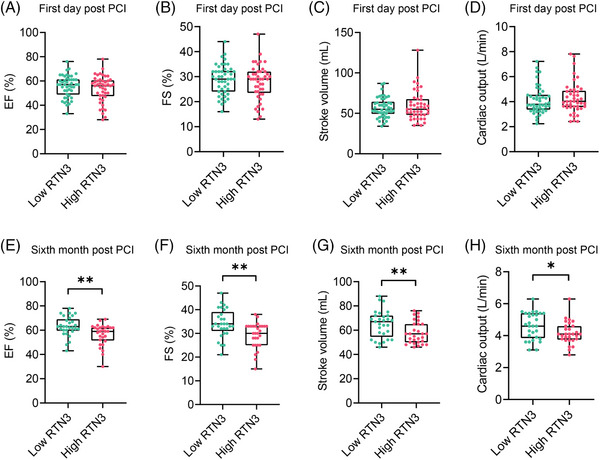
Multiple molecular mechanisms are involved in the development of heart failure (HF) after myocardial infarction (MI). However, interventions targeting these pathological processes alone remain clinically ineffective. Therefore, it is essential to identify new therapeutic targets for alleviating cardiac dysfunction after MI. Here, gain- and loss-of-function approaches were used to investigate the role of reticulon 3 (RTN3) in HF after MI. We found that RTN3 was elevated in the myocardium of patients with HF and mice with MI. Cardiomyocyte-specific RTN3 overexpression decreased systolic function in mice under physiological conditions and exacerbated the development of HF induced by MI. Conversely, RTN3 knockout alleviated cardiac dysfunction after MI. Mechanistically, RTN3 bound and mediated heat shock protein beta-1 (HSPB1) translocation from the cytosol to the endoplasmic reticulum. The reduction of cytosolic HSPB1 was responsible for the elevation of TLR4, which impaired mitochondrial function and promoted inflammation through toll-like receptor 4 (TLR4)/peroxisome proliferator-activated receptor gamma coactivator-1 alpha(PGC-1α) and TLR4/Nuclear factor-kappa B(NFκB) pathways, respectively. Furthermore, the HSPB1 inhibitor reversed the protective effect of RTN3 knockout on MI. Additionally, elevated plasma RTN3 level is associated with decreased cardiac function in patients with acute MI. This study identified RTN3 as a critical driver of HF after MI and suggests targeting RTN3 as a promising therapeutic strategy for MI and related cardiovascular diseases.

Keywords: heart failure; inflammation; mitochondrial function; myocardial infarction; reticulon 3.


Conflict of interest statement

The authors declare they have no conflicts of interest.

Figures

FIGURE 1
FIGURE 1
Reticulon 3 (RTN3) expression is increased in the myocardium of patients with heart failure (HF) and mice with myocardial infarction (MI). (A) Transcriptional expression of RTN1, RTN2, RTN3, and RTN4 in the left ventricle samples RNA sequencing (RNA‐seq) data (GSE161472) including normal subjects (n = 9) and patients with HF (n = 12). (B) Transcriptional expression of RTN1, RTN2, RTN3, and RTN4 in human RNA‐seq data (GSE46224), including normal subjects and patients with ischemic cardiomyopathy (ICM) (n = 8 per group). (C) Relative mRNA levels of RTN1, RTN2, RTN3, and RTN4 in hearts of normal subjects (n = 4) and patients with HF (n = 6). (D) Relative mRNA levels of RTN1, RTN2, RTN3, and RTN4 in peripheral blood mononuclear cells (PBMCs) of normal subjects (n = 4) and patients with MI (n = 6). (E) Representative western blots and quantitative results of RTN3 levels in hearts of normal subjects and patients with HF (n = 4 per group). (F) Representative western blots and quantitative results of RTN3 levels in PBMCs of normal subjects and patients with MI (n = 8 per group). (G) Plasma RTN3 levels in normal subjects (n = 8) and patients with MI (n = 16). (H) Representative western blots and quantitative analysis of RTN3 protein in mouse hearts at the indicated time points post‐MI (n = 4 per group). (I) Immunofluorescence images of RTN3 expression in different areas of mouse hearts 1 day after MI. Cardiac troponin T (cTnT) (green) was used as a cardiomyocyte marker, and 4'‐6‐diamidino‐2‐phenylindole(DAPI, blue) was used to stain the nuclei. Scale bar = 20 μm. (J) Representative western blots and quantitative results of RTN3 levels in neonatal rat primary cardiomyocytes (NRCMs) and neonatal rat cardiac fibroblasts (NRCFs) subjected to hypoxia for 6 h (n = 3 per group). Data are presented as mean ± standard error of the mean (SEM). Data in (H) were analyzed by one‐way analysis of variance (ANOVA) with a Bonferroni post hoc test. Others were analyzed by unpaired Student's t test. * < 0.05, ** < 0.01.
FIGURE 2
FIGURE 2
Cardiomyocyte‐specific reticulon 3 (RTN3) overexpression aggravates cardiac dysfunction and RTN3 knockout alleviates heart failure (HF) after myocardial infarction (MI). (A) The timeline of the experimental design for RTN3 overexpression in mice after MI. (B) Infarct size was evaluated by triphenyl tetrazolium chloride (TTC) staining 24 h post‐MI (n = 5 per group). Scale bar = 5 mm. (C) Representative M‐mode echocardiography images at the indicated time points post‐MI. Echocardiography parameters, including ejection fraction (EF), fractional shortening (FS), left ventricular internal dimension at systolic phase (LVIDs), and left ventricular internal dimension at diastolic phase (LVIDd), were calculated (n = 8 per group). (D) Representative Masson trichrome staining images and quantification of infarct size 28 days post‐MI (n = 5 per group). Scale bar = 2 mm. (E) Relative mRNA levels of ANP, BNP, Col1a1, and Col3a1 in hearts 28 days post‐MI (n = 4 per group). (F) The timeline of the experimental design for RTN3 knockout in mice after MI. (G) Infarct size was evaluated by TTC staining 24 h post‐MI (n = 5 per group). Scale bar = 5 mm. (H) Representative M‐mode echocardiography images at the indicated time points post‐MI. Echocardiography parameters, including EF, FS, LVIDs, and LVIDd, were calculated (n = 8 per group). (I) Representative Masson trichrome staining images and quantification of infarct size 28 days post‐MI (n = 5 per group). Scale bar = 2 mm. (J) Relative mRNA levels of ANP, BNP, Col1a1, and Col3a1 in hearts 28 days post‐MI (n = 4 per group). Data are presented as mean ± standard error of the mean (SEM). Statistical significance was assessed by one‐way analysis of variance (ANOVA) with a Bonferroni post hoc test. * < 0.05, ** < 0.01, *** < 0.001.
FIGURE 3
FIGURE 3
Reticulon 3 (RTN3) deficiency rescues mitochondrial electron transport chain (ETC) dysfunction in the myocardium after myocardial infarction (MI). (A) Schematic diagram showing the experimental design of RNA sequencing (RNA‐seq). (B) Hierarchical cluster analysis of differentially expressed genes (DEGs) in RTN3 CKO versus RTN3 fl/fl mice post‐MI as assessed by RNA‐seq (fold change > 1.5, < 0.05). (C) Volcano plot of DEGs in indicated mouse hearts (fold change > 1.5, < 0.05). (D–F) Gene Ontology (GO), Kyoto Encyclopedia of Genes and Genomes (KEGG), and Reactome enrichment analysis of DEGs in indicated mouse hearts using the Database for Annotation and Visualization and Integrated Discovery (DAVID) tools. (G) Gene Set Enrichment Analysis (GSEA) analysis of metabolic‐related enrichment plots which upregulated in RTN3 CKO mice compared with RTN3 fl/fl mice after MI. (H) Heatmap showing differentially expressed mitochondrial ETC complex subunit genes in RNA‐seq data. (I) Quantitative polymerase chain reaction (PCR) analysis of mRNA levels of mitochondrial ETC complex subunit genes (n = 5 per group). (J) Western blots images of mitochondrial ETC complex subunits in indicated groups (n = 3 per group). (K) Representative transmission electron microscopy images and quantification of abnormal mitochondria in mice post‐MI (n = 8 per group). The upper scale bar = 2 μm and the lower scale bar = 1 μm. (L) oxygen consumption rate (OCR) detection and quantitative analysis in neonatal rat primary cardiomyocytes (NRCMs) with or without RTN3 knockdown after hypoxia stimulation (n = 5 per group). Data are presented as mean ± standard error of the mean (SEM). Statistical significance was assessed by unpaired Student's t test. * < 0.05, ** < 0.01.
FIGURE 4
FIGURE 4
Reticulon 3 (RTN3) binds to heat shock protein beta‐1 (HSPB1) and recruits it to the endoplasmic reticulum. (A) Schematic diagram showing the experimental design of screening interacting proteins. (B) Mass spectrometry analysis of immunoprecipitated results. (C and D) Representative western blots showing the interaction of RTN3 and HSPB1 using anti‐Flag and anti‐HSPB1 antibodies in neonatal rat primary cardiomyocytes (NRCMs), respectively. (E) Representative immunofluorescence images showing co‐location for RTN3 (green) and HSPB1 (red) in NRCMs. DAPI (blue) was used to stain the nuclei. Scale bar = 10 μm. (F) The upper: schematic diagram showing the construction of RTN3 structure and its truncated forms; the lower: H9c2 cells were transfected with wild‐type RTN3 or its truncated mutants and applied to immunoprecipitation (IP) assay. CTD, C‐terminal domain; NTD, N‐terminal domain. (G) The upper: schematic diagram showing the construction of HSPB1 structure and its truncated forms; the lower: H9c2 cells were transfected with wild‐type HSPB1 or its truncated mutants and applied to IP assay. (H) Representative western blots of endoplasmic reticulum (ER) proteins in the hearts of RTN3 CKO mice and RTN3 fl/fl mice after MI. Calreticulin was used as an internal reference for ER proteins, and Histone H3 was used as an internal reference for nuclear proteins. (I) H9c2 cells were transfected with indicated plasmids, and ER fractions were extracted for western blot. (J) Western blot analysis of TLR4 and PGC‐1α expression in the hearts of indicated mice (n = 6 per group). (K) Representative western blots of mitochondrial electron transport chain (ETC) complex subunits in indicated groups. (L) ATP production in the hearts of indicated mice (n = 6 per group). Data are presented as mean ± standard error of the mean (SEM). Data were analyzed by unpaired Student's t test. * < 0.05, ** < 0.01, *** < 0.001.
FIGURE 5
FIGURE 5
Reticulon 3 (RTN3) knockout or overexpression respectively alleviates or aggravates myocardial infarction (MI)‐induced inflammatory response. (A) Representative western blots and quantitative analysis of TLR4 and p‐IκBα in indicated groups (n = 6 per group). (B) Representative western blots and quantitative analysis of p‐NFκB or NFκB in cytoplasm and nucleus (n = 6 per group). (C) Representative immunofluorescence images and quantitative analysis of NFκB nuclear translocation in indicated groups (n = 5 per group). Scale bar = 30 μm. (D) Relative mRNA levels of interleukin (IL)‐1β, IL‐6, and C‐C motif chemokine ligand 2 (CCL2) in hearts of indicated mice 3 days after MI (n = 4 per group). (E and F) Representative immunofluorescence images and quantitative analysis of immune cell infiltration in hearts of indicated mice 3 days after MI (n = 5 per group). Scale bar = 100 μm. Ly6G, F4/80, and CD3 were used as markers for neutrophils, macrophages, and T cells, respectively. (G) Relative mRNA levels of IL‐1β, IL‐6, and CCL2 in hearts of indicated mice 3 days after MI (n = 4 per group). (H and I) Representative immunofluorescence images and quantitative analysis of immune cell infiltration in hearts of indicated mice 3 days after MI (n = 5 per group). Scale bar = 100 μm. Data are presented as mean ± standard error of the mean (SEM). Statistical significance was assessed by one‐way analysis of variance (ANOVA) with a Bonferroni post hoc test. * < 0.05, ** < 0.01, *** < 0.001.
FIGURE 6
FIGURE 6
Heat shock protein beta‐1 (HSPB1) inhibition abolishes the ameliorative effect of reticulon 3 (RTN3) knockout on heart failure (HF) after myocardial infarction (MI). (A) Representative western blots of HSPB1 different forms in primary mouse cardiomyocytes treated with J2. (B) Representative western blots of HSPB1 different forms in hearts of mice intraperitoneally injected with J2 for 14 days. (C) The timeline of the experimental design for J2 in vivo application. (D) Representative echocardiography images at the indicated time points before and after J2 in vivo application. Echocardiography parameters, including ejection fraction (EF), fractional shortening (FS), left ventricular internal dimension at systolic phase (LVIDs), and left ventricular internal dimension at diastolic phase (LVIDd), were calculated (n = 8 per group). * < 0.05, RTN3 CKO + MI + vehicle versus RTN3 fl/fl + MI + vehicle; # < 0.05, RTN3 CKO + MI + J2 versus RTN3 CKO + MI + vehicle; ## < 0.01, RTN3 CKO + MI + J2 versus RTN3 CKO + MI + vehicle. (E) Representative Masson trichrome staining images and quantification of infarct size 28 days post‐MI (n = 5 per group). Scale bar = 2 mm. (F) Relative mRNA levels of ANP, BNP, Col1a1, and Col3a1 in hearts 28 days post‐MI (n = 4 per group). (G) Representative western blots of mitochondrial electron transport chain (ETC) complex subunits in indicated groups. (H) ATP production in the hearts of indicated mice (n = 6 per group). (I) Representative western blots and quantitative analysis of TLR4 and p‐IκBα in indicated groups (n = 6 per group). (J) Representative western blots and quantitative analysis of p‐NFκB or NFκB in cytoplasm and nucleus (n = 6 per group). Data are presented as mean ± standard error of the mean (SEM). Statistical significance was assessed by one‐way analysis of variance (ANOVA) with a Bonferroni post hoc test. * < 0.05, ** < 0.01, *** < 0.001.
FIGURE 7
FIGURE 7
Elevated plasma reticulon 3 (RTN3) level is associated with decreased cardiac function in patients with acute myocardial infarction (AMI). (A–D) Echocardiographic data of patients with AMI in the low RTN3 (n = 46) and high RTN3 groups (n = 45) at 1 day after percutaneous coronary intervention (PCI). (E–H) Echocardiographic data of patients with AMI in the low RTN3 and high RTN3 groups at 6 months after PCI (n = 29 per group). Data are presented as mean ± standard error of the mean (SEM). Statistical significance was assessed by unpaired Student's t test. * < 0.05, ** < 0.01.

References

    1. Reed GW, Rossi JE, Cannon CP. Acute myocardial infarction. Lancet (London, England). 2017;389:197‐210. - PubMed
    1. Chen W, Bian W, Zhou Y, Zhang J. Cardiac fibroblasts and myocardial regeneration. Front Bioeng Biotechnol. 2021;9:599928. - PMC - PubMed
    1. Laflamme MA, Murry CE. Heart regeneration. Nature. 2011;473:326‐335. - PMC - PubMed
    1. Bahit MC, Kochar A, Granger CB. Post‐myocardial infarction heart failure. JACC Heart Fail. 2018;6:179‐186. - PubMed
    1. Gerber Y, Weston SA, Enriquez‐Sarano M, Berardi C, Chamberlain AM, Manemann SM. Mortality associated with heart failure after myocardial infarction: a contemporary community perspective. Circ Heart Fail. 2016;9:e2460. - PMC - PubMed