

HIV Productively Infects Highly Differentiated and Exhausted CD4+ T Cells During AIDS
- PMID: 38420260
- PMCID: PMC10901154
- DOI: 10.20411/pai.v8i2.638
HIV Productively Infects Highly Differentiated and Exhausted CD4+ T Cells During AIDS
Abstract
Background: Throughout HIV infection, productively infected cells generate billions of viral particles and are thus responsible for body-wide HIV dissemination, but their phenotype during AIDS is unknown. As AIDS is associated with immunological changes, analyzing the phenotype of productively infected cells can help understand HIV production during this terminal stage.
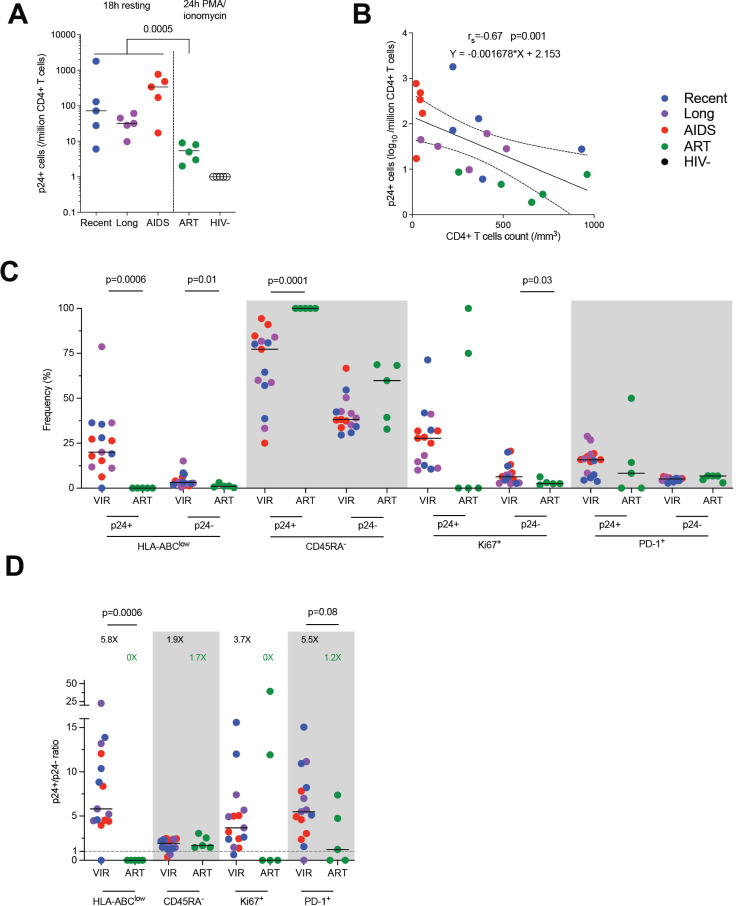
Methods: Blood samples from 15 untreated viremic participants (recent infection, n=5; long-term infection, n=5; active opportunistic AIDS-defining disease, n=5) and 5 participants virologically controlled on antiretroviral therapy (ART) enrolled in the Analysis of the Persistence, Reservoir and HIV Latency (APRIL) study (NCT05752318) were analyzed. Cells expressing the capsid protein p24 (p24+ cells) after 18 hours of resting or 24 hours of stimulation (HIV-Flow) revealed productively infected cells from viremic participants or translation-competent reservoir cells from treated participants, respectively.
Results: The frequency of productively infected cells tended to be higher during AIDS in comparison with recent and long-term infections (median, 340, 72, and 32/million CD4+ T cells, respectively) and correlated with the plasma viral load at all stages of infection. Altogether, these cells were more frequently CD4low, HLA-ABClow, CD45RA-, Ki67+, PD-1+, with a non-negligible contribution from pTfh (CXCR5+PD-1+) cells, and were not significantly enriched in HIV coreceptors CCR5 nor CXCR4 expression. The comparison markers expression between stages showed that productively infected cells during AIDS were enriched in memory and exhausted cells. In contrast, the frequencies of infected pTfh were lower during AIDS compared to non-AIDS stages. A UMAP analysis revealed that total CD4+ T cells were grouped in 7 clusters and that productive p24+ cells were skewed to given clusters throughout the course of infection. Overall, the preferential targets of HIV during the latest stages seemed to be more frequently highly differentiated (memory, TTD-like) and exhausted cells and less frequently pTfh-like cells. In contrast, translation-competent reservoir cells were less frequent (5/million CD4+ T cells) and expressed more frequently HLA-ABC and less frequently PD-1.
Conclusions: In long-term infection and AIDS, productively infected cells were differentiated and exhausted. This could indicate that cells with these given features are responsible for HIV production and dissemination in an immune dysfunction environment occurring during the last stages of infection.
Keywords: AIDS; exhaustion; phenotype; productively infected cells; recent infection.
Copyright © 2024 Pathogens and Immunity.
Conflict of interest statement
The authors declare no competing interests to declare regarding this study. The views expressed are those of the authors.
Figures


Similar articles
-
Peripheral T Follicular Helper Cells Are the Major HIV Reservoir within Central Memory CD4 T Cells in Peripheral Blood from Chronically HIV-Infected Individuals on Combination Antiretroviral Therapy.J Virol. 2015 Dec 16;90(6):2718-28. doi: 10.1128/JVI.02883-15. J Virol. 2015. PMID: 26676775 Free PMC article. Clinical Trial.
-
Low Peripheral T Follicular Helper Cells in Perinatally HIV-Infected Children Correlate With Advancing HIV Disease.Front Immunol. 2018 Aug 24;9:1901. doi: 10.3389/fimmu.2018.01901. eCollection 2018. Front Immunol. 2018. PMID: 30197641 Free PMC article.
-
Single-cell characterization and quantification of translation-competent viral reservoirs in treated and untreated HIV infection.PLoS Pathog. 2019 Feb 27;15(2):e1007619. doi: 10.1371/journal.ppat.1007619. eCollection 2019 Feb. PLoS Pathog. 2019. PMID: 30811499 Free PMC article.
-
[Deep lung--cellular reaction to HIV].Rev Port Pneumol. 2007 Mar-Apr;13(2):175-212. Rev Port Pneumol. 2007. PMID: 17492233 Review. Portuguese.
-
Divergent Expression of CXCR5 and CCR5 on CD4+ T Cells and the Paradoxical Accumulation of T Follicular Helper Cells during HIV Infection.Front Immunol. 2017 May 12;8:495. doi: 10.3389/fimmu.2017.00495. eCollection 2017. Front Immunol. 2017. PMID: 28553284 Free PMC article. Review.
References
-
- Brenchley JM, Hill BJ, Ambrozak DR, Price DA, Guenaga FJ, Casazza JP, Kuruppu J, Yazdani J, Migueles SA, Connors M, Roederer M, Douek DC, Koup RA.. T-cell subsets that harbor human immunodeficiency virus (HIV) in vivo: implications for HIV pathogenesis. J Virol. 2004;78(3):1160-8. doi: 10.1128/jvi.78.3.1160-1168.2004. PubMed PMID: 14722271; PMCID: PMC321406. - DOI - PMC - PubMed
-
- Chomont N, El-Far M, Ancuta P, Trautmann L, Procopio FA, Yassine-Diab B, Boucher G, Boulassel MR, Ghattas G, Brenchley JM, Schacker TW, Hill BJ, Douek DC, Routy JP, Haddad EK, Sekaly RP.. HIV reservoir size and persistence are driven by T cell survival and homeostatic proliferation. Nature Medicine. 2009;15(8):893-900. doi: 10.1038/nm.1972. PubMed PMID: 19543283; PMCID: 2859814. - DOI - PMC - PubMed
-
- Banga R, Procopio FA, Noto A, Pollakis G, Cavassini M, Ohmiti K, Corpataux JM, de Leval L, Pantaleo G, Perreau M.. PD-1(+) and follicular helper T cells are responsible for persistent HIV-1 transcription in treated aviremic individuals. Nature Medicine. 2016;22(7):754-61. doi: 10.1038/nm.4113. PubMed PMID: 27239760. - DOI - PubMed
-
- Fromentin R, Bakeman W, Lawani MB, Khoury G, Hartogensis W, DaFonseca S, Killian M, Epling L, Hoh R, Sinclair E, Hecht FM, Bacchetti P, Deeks SG, Lewin SR, Sekaly RP, Chomont N.. CD4+ T Cells Expressing PD-1, TIGIT and LAG-3 Contribute to HIV Persistence during ART. PLoS Pathog. 2016;12(7):e1005761. doi: 10.1371/journal.ppat.1005761. PubMed PMID: 27415008; PMCID: PMC4944956. - DOI - PMC - PubMed
-
- Gosselin A, Wiche Salinas TR, Planas D, Wacleche VS, Zhang Y, Fromentin R, Cho-mont N, Cohen EA, Shacklett B, Mehraj V, Ghali MP, Routy JP, Ancuta P.. HIV persists in CCR6+CD4+ T cells from colon and blood during antiretroviral therapy. AIDS. 2017;31(1):35-48. doi: 10.1097/QAD.0000000000001309. PubMed PMID: 27835617; PMCID: PMC5131694. - DOI - PMC - PubMed
LinkOut - more resources
Full Text Sources
Research Materials
Miscellaneous