. 2023 Nov 20;14(12):6328-6349.
doi: 10.1364/BOE.503941. eCollection 2023 Dec 1.

Real-time OCT feedback-controlled RPE photodisruption in ex vivo porcine eyes using 8 microsecond laser pulses

Affiliations

Real-time OCT feedback-controlled RPE photodisruption in ex vivo porcine eyes using 8 microsecond laser pulses

Christian Burri et al. Biomed Opt Express. .

Abstract

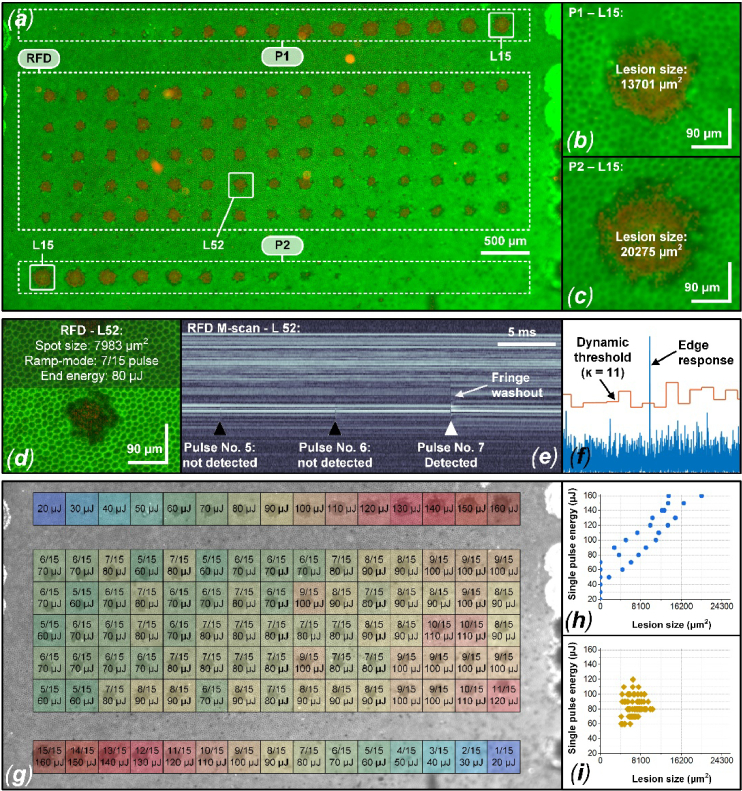
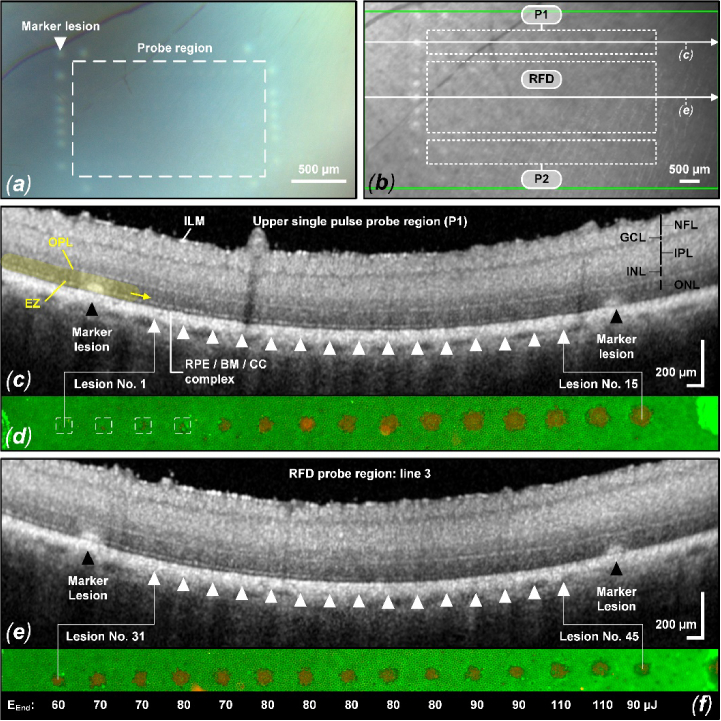
Selective retinal pigment epithelium (RPE) photodisruption requires reliable real-time feedback dosimetry (RFD) to prevent unwanted overexposure. In this study, optical coherence tomography (OCT) based RFD was investigated in ex vivo porcine eyes exposed to laser pulses of 8 µs duration (wavelength: 532 nm, exposure area: 90 × 90 µm2, radiant exposure: 247 to 1975 mJ/µm2). For RFD, fringe washouts in time-resolved OCT M-scans (central wavelength: 870 nm, scan rate: 85 kHz) were compared to an RPE cell viability assay. Statistical analysis revealed a moderate correlation between RPE lesion size and applied treatment energy, suggesting RFD adaptation to inter- and intraindividual RPE pigmentation and ocular transmission.


Conflict of interest statement

C.B. Meridian Medical (F,E,R), Heidelberg Engineering (F,R); The remaining authors declare no potential conflicts of interest.

Figures

Fig. 1.
Fig. 1.
Experimental setup and functionality of the Spectralis Centuarus device and real-time feedback dosimetry (RFD) algorithm: (a) the SD-OCT (870 nm) and treatment laser (532 nm) beams are aligned coaxially by a dichroic mirror. Behind the dichroic mirror, the treatment laser is detected by an avalanche photodetector. Retina scanning for OCT imaging and treatment laser application is performed by a galvanometric scanner. A chromatically corrected objective focused the collinear treatment and OCT laser beams to ex vivo porcine retinas. The Spectralis’s standard integrated IR cSLO eases treatment planning by displaying a fundus image for interactive treatment pattern placement. The treatment spot size on the porcine retinas was about 90 × 90 µm2 superimposed with the centered Gaussian OCT beam (b, c). (d) ramp-mode and RFD: within the RFD probe region pulse bursts (15 pulses; 100 Hz repetition rate) with increasing pulse energy from 20 µJ (247 mJ/cm2) to 160 µJ (1975 mJ/cm2) were applied. For RFD, the simultaneously to the treatment laser application recorded OCT M-scans were evaluated for fringe washouts by a dedicated dosimetry algorithm. Fringe washouts occur due to the formation of microbubbles in the RPE during laser irradiation near and above the damage threshold. M-scan processing is roughly done in four steps: 1) contrast enhancement, 2) A-scan summation, 3) convolution and 4) peak detection [46]. Whenever a fringe washout was detected, the pulse ramp was interrupted and thus the end energy for a specific lesion individually targeted.
Fig. 2.
Fig. 2.
Post-treatment overview (based on sample No. 3 (1-161)) of the laser application to ex vivo porcine eye retinas. (a) IR cSLO image (30° and 55°) of the pig fundus. The pig retina map shows the IR cSLO 55° FOV (red circle) and the three main retinal regions including vessels (white): visual streak (VS, No. 1: pale gray), midperiphery (No. 2) and periphery (No. 3: gray) according to Garca et al. [67]. The treatment pattern was placed within the VS close to the optic disc (OD). (b) Corresponding CFP image showing 19 marker lesions around the SRT probe region (white-dashed rectangle). (c) Complementary live/dead RPE cell viability assay showing the SRT treatment pattern with three different probe regions. In region P1 and P2, the same single-pulse pattern was applied with linearly increasing laser pulse energy from 20 µJ (247 mJ/cm2) to 160 µJ (1975 mJ/cm2). The energy was increased once from left to right and once vice versa from right to left in steps of 10 µJ. A pattern comprising 5 × 15 lesions was applied in the intermediate RFD probe region. These 75 lesions were controlled by the RFD algorithm. For this purpose, the lesions were applied in ramp mode limited to a maximum of 15 pulses (repetition rate: 100 Hz, Emin: 20 µJ, Emax: 160 µJ). The ramp exposure sequence was interrupted as soon as a fringe washout was detected in an OCT M-scan by RFD. (d) Magnified image of a lesion corresponding to the applied laser spot size of 90 × 90 µm2 (8100 µm2). (e) Enlarged image showing the typical hexagonal RPE structure. Staining: green-fluorescent calcein-AM (live) and red-fluorescent ethidium homodimer-1 (EthD-1, dead).
Fig. 3.
Fig. 3.
Results RPE cell viability assay: inter- and intraindividual as well as overall RPE damage threshold based on the upper (P1) and lower (P2) single pulse probe region. Overall, a median RPE damage threshold (ED50) of 87 µJ (1074 mJ/cm2) was found.
Fig. 4.
Fig. 4.
Number of applied pulses in ramp-mode (max. 15 pulses) within the RFD probe regions until the automated treatment laser interruption based on detected fringe washouts in OCT M-scans by the dosimetry algorithm (blue dots: number of applied pulses; red distribution curve). Across all samples, the median number of ramp pulses applied was 9 out of 15.
Fig. 5.
Fig. 5.
Measured lesion sizes per sample for the RFD probe region based on the RPE cell viability assay (blue dots: lesion sizes; red distribution curve). Overall, a mean lesion size of 8074 µm2 was found. IQR: interquartile range.
Fig. 6.
Fig. 6.
Scatter diagrams showing the linear and monotonic relationship between the applied pulse energy and the resulting RPE lesion sizes for the single pulse probe regions P1 and P2 (a) and RFD patterns (b). (c) distribution of measured lesion sizes in the RFD patterns. STDV: standard deviation; Low. and Upp. 95%: lower and upper 95% confidence interval of mean.
Fig. 7.
Fig. 7.
(a) live/dead RPE cell viability assay and RFD evaluation of sample No. 5 (1-163) showing the two single pulse probe regions (P1 and P2) as well as the RFD probe region. (b, c) RPE lesions at maximum treatment energy with a damage area extending the treatment spot size (8100 µm2) likely due to thermal diffusion. (d-f) exemplary OCT M-scan evaluation of lesion No. 52 from the RFD pattern. For this lesion, the RFD algorithm detected a fringe washout at pulse No. 7 / 15. (g) overview RFD region with color coding according to the applied ramp end energy and applied pulses, respectively. Correlation between RPE spot size and applied energy within the single pulse probe region (h) and RFD pattern (i)
Fig. 8.
Fig. 8.
Exemplary OCT B-scan post-treatment tissue assessment of sample No. 5 (1-163). (a) CFP image showing 19 marker lesions around the SRT probe region. (b) corresponding IR cSLO image (30°) of the pig fundus. The green rectangle marks the 30°× 15° OCT C-scan area which includes 145 B-scans with 30 µm horizontal spacing. For each B-scan, 34 scans were averaged for improved image quality. (c) OCT B-scan trough the upper single pulse probe region and corresponding live/dead RPE cell viability assay (d). (e) scan trough line three of the RFD probe region (lesion 31-45) and corresponding live/dead RPE cell viability assay with RFD end energies (f). Apart from the marker lesions, the retina shows no abnormalities in the area of the photoreceptors, except for partially subtle hyperreflectivity. Morphological porcine retina assessment according to Xie et al. [72]: retinal layers are marked by ILM: inner limiting membrane; NFL: nerve fiber layer; GCL: ganglion cell layer; IPL: inner plexiform layer; INL: inner nerve fiber layer; OPL: outer plexiform layer; ONL: outer nuclear layer; EZ: ellipsoid zone; RPE: retinal pigment epithelium; BM: Bruch’s membrane; CC: choriocapillaris.
Fig. 9.
Fig. 9.
Thermal tissue expansion and scattering change during SRT for lesion No. 52 from the RFD pattern of sample No. 5.: (a) post-treatment OCT B-scan at the laser treatment location of lesion No. 52. (b) corresponding OCT M-scan acquired during laser application. (c) complementary live/dead RPE cell viability assay of lesion No. 52. (d) change in hyperreflectivity (ΔS) within EZ and the area up to the OPL (yellow) as well as the RPE / Bruch’s membrane (BM) / choriocapillaris (CC) complex for the in depicted M-scan.

Update of

  • doi: 10.1364/opticaopen.24304489.

Similar articles

References

    1. Szalai E., Nickerson J. M., Grossniklaus H. E., “RPE histopathology and morphometry,” in Retinal Pigment Epithelium in Health and Disease , Klettner A. K., Dithmar S., eds. (Springer Cham, 2020).10.1007/978-3-030-28384-1_1 - DOI
    1. Sparrow R. J., Hicks D., Hamel P. C., “The retinal pigment epithelium in health and disease,” Curr. Mol. Med. 10(9), 802–823 (2010).10.2174/156652410793937813 - DOI - PMC - PubMed
    1. Hurley J. B., “Retina metabolism and metabolism in the pigmented epithelium: a busy intersection,” Annu. Rev. Vis. Sci. 7, 665–692 (2021).10.1146/annurev-vision-100419-115156 - DOI - PMC - PubMed
    1. Röhlich P., “The interphotoreceptor matrix: Electron microscopic and histochemical observations on the vertebrate retina,” Exp. Eye Res. 10(1), 80–86 (1970).10.1016/S0014-4835(70)80013-6 - DOI - PubMed
    1. Rizzolo L. J., “RPE polarity and barrier function,” in Retinal Pigment Epithelium in Health and Disease , Klettner A. K., Dithmar S., eds. (Springer Cham, 2020).10.1007/978-3-030-28384-1_2 - DOI