. 2023 Nov 28;14(12):6442-6469.
doi: 10.1364/BOE.495468. eCollection 2023 Dec 1.

Optimal calibration of optical tweezers with arbitrary integration time and sampling frequencies: a general framework [Invited]

Affiliations

Optimal calibration of optical tweezers with arbitrary integration time and sampling frequencies: a general framework [Invited]

Laura Pérez-García et al. Biomed Opt Express. .

Abstract

Optical tweezers (OT) have become an essential technique in several fields of physics, chemistry, and biology as precise micromanipulation tools and microscopic force transducers. Quantitative measurements require the accurate calibration of the trap stiffness of the optical trap and the diffusion constant of the optically trapped particle. This is typically done by statistical estimators constructed from the position signal of the particle, which is recorded by a digital camera or a quadrant photodiode. The finite integration time and sampling frequency of the detector need to be properly taken into account. Here, we present a general approach based on the joint probability density function of the sampled trajectory that corrects exactly the biases due to the detector's finite integration time and limited sampling frequency, providing theoretical formulas for the most widely employed calibration methods: equipartition, mean squared displacement, autocorrelation, power spectral density, and force reconstruction via maximum-likelihood-estimator analysis (FORMA). Our results, tested with experiments and Monte Carlo simulations, will permit users of OT to confidently estimate the trap stiffness and diffusion constant, extending their use to a broader set of experimental conditions.


Conflict of interest statement

The authors declare no conflicts of interest.

Figures
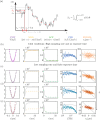
Fig. 1.
Fig. 1.
Effect of low sampling frequency and long integration time on optical tweezers calibration. (a) The trajectory of a particle (solid line) is sampled every Δt , instantaneously (black dots) or with a finite integration time δ (red dots). (b-e) Behavior of the standard methods for various sampling frequencies and integration times on simulated trajectories generated through Monte Carlo simulations of a particle of diameter dp=1.54μm in a trap with stiffness κ=4.08pN/μm and diffusion constant D=0.299μm2/s . The gray solid lines represent the analytical solutions of the standard methods, whereas the colored markers represent their corresponding estimates obtained from the simulated data. From left to right, potential (POT), mean square displacement (MSD), autocorrelation function (ACF), power spectrum density (PSD), and force reconstruction via maximum likelihood estimator (FORMA) methods. (b) When the conditions are ideal (i.e., with high sampling frequency fs=5000Hz and short integration time δ=0s ), there is good agreement between the estimators and the theoretical predictions (see Eqs. (7), (8), (10), (13) and (17)). (c-e) This agreement worsens as the conditions become less ideal (c) by lowering the sampling frequency to fs=100Hz ( δ=0ms ), and then by increasing the integration time to (d) δ=5ms and (e) δ=10ms .
Fig. 2.
Fig. 2.
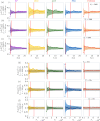
Influence of δ on the estimation of the stiffness and diffusion: low sampling frequency. (a,c) standard and (b,d) generalized formulas at sampling frequency fs=500Hz . The data points show estimates from experimental realizations and the colored shaded areas depict confidence intervals obtained from simulations using κ¯α=4.08pN/μm and D¯α=0.299μm2/s . As a reference, the gray shaded areas in (c,d) depict the range of the expected value D=0.295±0.020μm2/s . All the experimental data points were estimated using Ns=105 samples.
Fig. 3.
Fig. 3.
Influence of δ on the estimation of the stiffness and diffusion: medium sampling frequency. (a,c) standard and (b,d) generalized formulas at sampling frequency fs=1500Hz . The data points show estimates from experimental realizations and the colored shaded areas depict confidence intervals obtained from simulations using κ¯α=4.08pN/μm and D¯α=0.299μm2/s . As a reference, the gray shaded areas in (c,d) depict the range of the expected value D=0.295±0.020μm2/s . All the experimental data points were estimated using Ns=105 samples.
Fig. 4.
Fig. 4.
Influence of δ on the estimation of the stiffness and diffusion: high sampling frequency. (a,c) standard and (b,d) generalized formulas at sampling frequency fs=3500Hz . The data points show estimates from experimental realizations and the colored shaded areas depict confidence intervals obtained from simulations using κ¯α=4.08pN/μm and D¯α=0.299μm2/s . As a reference, the gray shaded areas in (c-d) depict the range of the expected value D=0.295±0.020μm2/s . All the experimental data points were estimated using Ns=105 samples.
Fig. 5.
Fig. 5.
Performance of the generalized methods to estimate the stiffness and diffusion. (a-c) The stiffness is estimated as a function of the total sampled time Ts , while the diffusion (d-f) is estimated as a function of the number of samples Ns in the trajectory (at three sampling frequencies fs and three long integration times δ ). Experimental results are shown with solid dots while colored shaded areas show confidence intervals estimated by Monte Carlo simulations considering κ¯α=4.08pN/μm and D¯α=0.299μm2/s . Dashed lines in (a-c) depict the 10% error range of κ¯ and gray shaded areas in (d-f) depict the range of the expected value D=0.295±0.02μm2/s . The vertical red lines in (a-c) correspond to Ns=5000 samples and the vertical red lines in (d-f) correspond to Ts=10s acquisition time.

References

    1. Jones P. H., Maragó O. M., Volpe G., Optical Tweezers: Principles and Applications (Cambridge University Press, 2015).
    1. Gieseler J., Gomez-Solano J. R., Magazzù A., Castillo I. P., García L. P., Gironella-Torrent M., Viader-Godoy X., Ritort F., Pesce G., Arzola A. V., Volke-Sepúlveda K., Volpe G., “Optical tweezers — from calibration to applications: a tutorial,” Adv. Opt. Photonics 13(1), 74–241 (2021).10.1364/AOP.394888 - DOI
    1. Volpe G., Marago O. M., Rubinsztein-Dunlop H., et al. , “Roadmap for optical tweezers 2023,” JPhys Photonics 5(2), 022501 (2023).10.1088/2515-7647/acb57b - DOI
    1. Bustamante C., Cheng W., Mejia Y. X., “Revisiting the central dogma one molecule at a time,” Cell 144(4), 480–497 (2011).10.1016/j.cell.2011.01.033 - DOI - PMC - PubMed
    1. Zemánek P., Volpe G., Jonáš A., Brzobohatỳ O., “Perspective on light-induced transport of particles: from optical forces to phoretic motion,” Adv. Opt. Photonics 11(3), 577–678 (2019).10.1364/AOP.11.000577 - DOI

LinkOut - more resources