. 2023 Nov 30;14(12):6607-6628.
doi: 10.1364/BOE.507949. eCollection 2023 Dec 1.

Video-based sympathetic arousal assessment via peripheral blood flow estimation

Affiliations

Video-based sympathetic arousal assessment via peripheral blood flow estimation

Björn Braun et al. Biomed Opt Express. .

Abstract

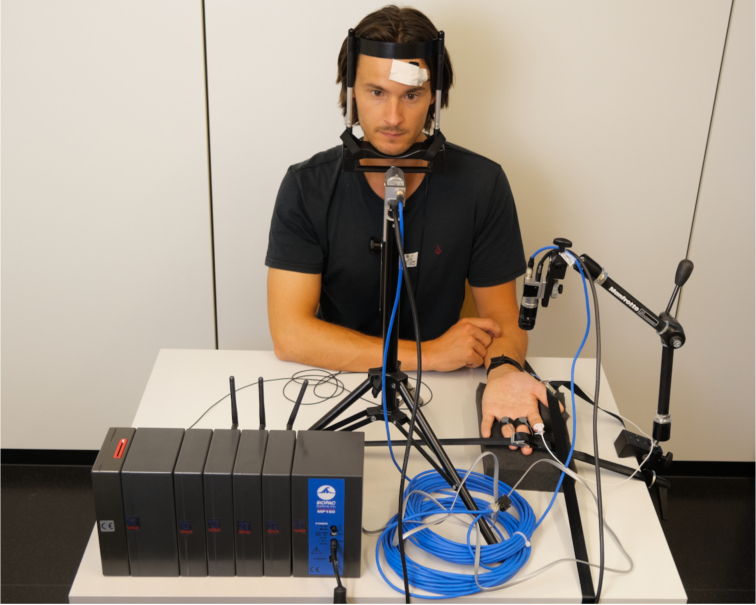
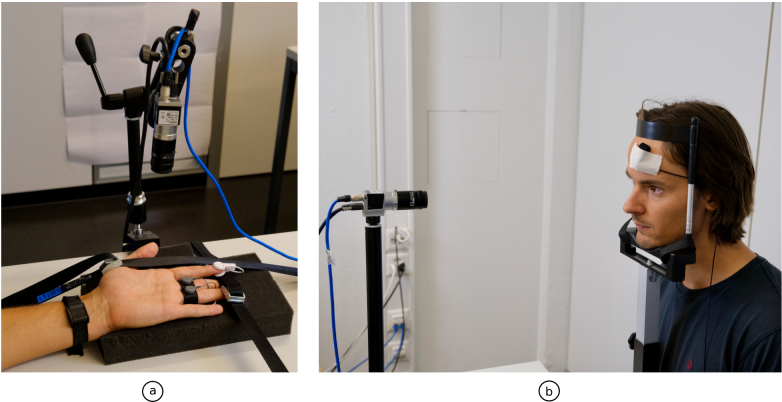
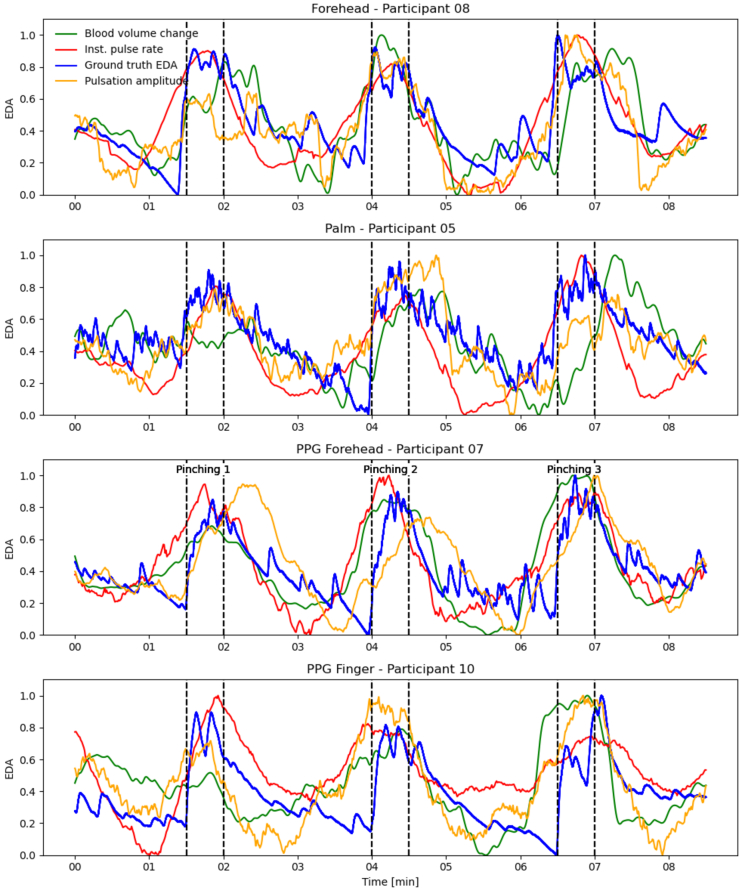
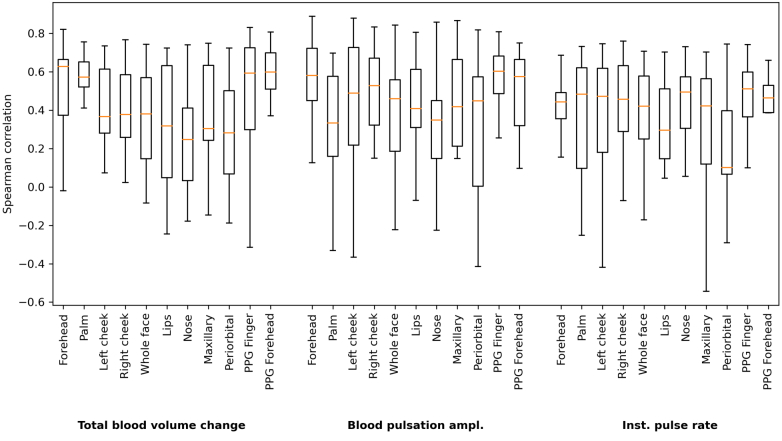
Electrodermal activity (EDA) is considered a standard marker of sympathetic activity. However, traditional EDA measurement requires electrodes in steady contact with the skin. Can sympathetic arousal be measured using only an optical sensor, such as an RGB camera? This paper presents a novel approach to infer sympathetic arousal by measuring the peripheral blood flow on the face or hand optically. We contribute a self-recorded dataset of 21 participants, comprising synchronized videos of participants' faces and palms and gold-standard EDA and photoplethysmography (PPG) signals. Our results show that we can measure peripheral sympathetic responses that closely correlate with the ground truth EDA. We obtain median correlations of 0.57 to 0.63 between our inferred signals and the ground truth EDA using only videos of the participants' palms or foreheads or PPG signals from the foreheads or fingers. We also show that sympathetic arousal is best inferred from the forehead, finger, or palm.


Conflict of interest statement

The authors declare no conflicts of interest.

Figures

Fig. 1.
Fig. 1.
A method to remotely measure a person’s sympathetic arousal with a camera. Using a sliding window approach, we estimate a person’s peripheral blood flow changes from a video of the person’s face or palm. We show that these blood flow changes strongly correlate with a person’s electrodermal signals.
Fig. 2.
Fig. 2.
The overall setup of the study. The face and the palm of each participant are recorded using a Basler acA1300-200uc camera. The participant’s EDA signal is recorded on the fingers (ring and middle finger) of the non-dominant hand using two electrodes, and the two PPG signals are recorded on the forehead and at the index finger of the non-dominant hand. The participant uses the dominant hand to pinch the back of the non-dominant arm or the legs as a stressor to cause a spike in EDA. To minimize motion artifacts, the participant’s head is placed on a chin rest, and the thumb, middle finger, and ringer are placed under a belt such that they do not interfere with the physiological measurements.
Fig. 3.
Fig. 3.
The individual components of the setup. (a) The camera which records the participant’s palm. The participant’s thumb, ring finger, and middle finger are placed under a belt to minimize any possible motion of the hand. The participant’s EDA signal and PPG signal are recorded from the index (PPG), middle (EDA), and ring fingers (EDA). (b) The camera which records the participant’s face. The participant’s face is placed on a chin rest to minimize any motion of the head. The PPG sensor is fixated with medical tape on the forehead of the participant.
Fig. 4.
Fig. 4.
The spectral power distribution of the lighting in the study room. The lighting conditions were the same for all study participants. We always used the same lighting source and a room without windows. The spectral power distribution was measured using a spectroradiometer (StellarNet BLUE-Wave).
Fig. 5.
Fig. 5.
The bounding boxes of the orofacial regions. This figure shows where we placed the different bounding boxes on the face to analyze how well a person’s sympathetic response can be measured from the different orofacial regions on the face.
Fig. 6.
Fig. 6.
Distributions of the participants’ EDA levels and two example responses to the stressors. (a) shows the distribution of the absolute EDA values of all 21 participants of the study. Three of the four participants, 02, 12, and 14, which did not have a significant change in their EDA values before and during the stressors, also have the lowest EDA values. (b) shows two example contact EDA signals from participants 04 and 12 for the entire duration of the study. In the top plot, the spikes in EDA during the stressor periods are clearly visible for participant 04. In the bottom plot, no such changes in EDA are visible for participant 12.
Fig. 7.
Fig. 7.
Visual comparison between the ground truth EDA and the calculated sympathetic responses. This plot shows the ground truth EDA signals, the calculated total blood volume changes, and the calculated instantaneous pulse rates for four exemplary participants using the four different input signals for four representative participants. The correlations between the calculated signals and the ground truth EDA signals are between 0.50 and 0.75.
Fig. 8.
Fig. 8.
Box plot of the Spearman correlations between the calculated signals and the ground truth EDA signals. This shows the Spearman correlations between the calculated signals and the ground truth EDA signals across all participants and for all regions using the total blood volume change, the mean blood pulsation amplitude, and the instantaneous pulse rate. The regions are ordered in descending order for the median correlations obtained using the total blood volume changes with the results from the two PPG sensors as last for all three methods.

Similar articles

References

    1. Billman G., “The lf/hf ratio does not accurately measure cardiac sympatho-vagal balance,” Front. Physiol. 4, 26 (2013).10.3389/fphys.2013.00026 - DOI - PMC - PubMed
    1. Thomas B. L., Claassen N., Becker P., et al. , “Validity of commonly used heart rate variability markers of autonomic nervous system function,” Neuropsychobiology 78(1), 14–26 (2019).10.1159/000495519 - DOI - PubMed
    1. McDuff D., Nishidate I., Nakano K., et al. , “Non-contact imaging of peripheral hemodynamics during cognitive and psychological stressors,” Sci. Rep. 10(1), 10884 (2020).10.1038/s41598-020-67647-6 - DOI - PMC - PubMed
    1. Dawson M. E., Schell A. M., Filion D. L., The Electrodermal System (Cambridge University Press, 2016), pp. 217–243, Cambridge Handbooks in Psychology, 4th ed.
    1. Posada-Quintero H. F., Chon K. H., “Innovations in electrodermal activity data collection and signal processing: A systematic review,” Sensors 20(2), 479 (2020).10.3390/s20020479 - DOI - PMC - PubMed

LinkOut - more resources